Monday, November 26, 2012

NASDAQ FUTURES UPDATE

The NASDAQ futures are hitting a new level of ugly, hopefully that will work well for the AAPL puts.


While it's still early in the overnight session, the NQ futures started out a bit ugly, bad enough for me to publish the chart. Now we have a negative leading divergence hitting new lows below the 9:30 market open, that's a substantial negative divergence. Hopefully this holds up overnight as it would fall in line with expectations for weakness early in the week.

Initial Early Overnight Indications

I really love the day when the market gives strong indications and I can finish up work at 6 or 7 pm, with the exception of a few things I keep an eye on, but a day like today is more difficult, although as I showed many times today, I stick with the longer timeframes when there's any doubt and those were clearly negative just as I expected late last week with the opinion, "We'll see market weakness early next week".

Well other than charts, the fundamental news that is unravelling as we go can't even be counted on. Less than an hour after the "Greece is fixed" announcement we saw EU officials say it was "Unclear how long Greek talks would continue", of course implying that no definitive deal had been reached and just to make that more clear, an EU official said, "Greek talks are still ongoing". 

Almost 2 hours later we have a webcast that outlines a number o the initiatives that I said in the original plan were, "Unclear". Apparently the press conference fills in the details, but it looks like the original announcement was probably pretty close to on track with additional details filled in at the press conference.

Apparently among the initiatives that I assume are part of the reduction of Greek debt that the EU and IMF agreed upon to get Greece to 124% debt to GDP by 2020, those seem to include:


Greek debt buybacks 
-Return of Securities Market Programme (SMP) profits to Greece
-A reduction of Greek Loan Facility (GLF) interest rates 
-Significant extension of GLF and European Financial Stability Facility (EFSF) maturities 
-The deferral of EFSF interest rate payments.

In any case, I let some time pass before looking at futures and while these are early indications, they are indications that I think have enough time behind them to be valid, I'll of course update any significant changes or signals as I see them.

Earlier today the signals in futures were absolute mush, they looked like this:
The arrow is the open, this is useless mush, but I do believe it is a fair representation of what the short term underlying trade was reflecting-chaos.
Since then, signals have improved dramatically.
Lets take a look at some signals...
 ES 1 min with  relative negative divergence, also there's a leading negative divergence between the two in the red box.

 On a 5 min ES chart we can already see a hint of a negative divergence that has started with a decent size relative negative divergence, this is a significant change of character on this chart.

 The NASDAQ Futures 1 min chart are seeing a small relative followed by a larger leading negative divergence. This particular divergence is pretty ugly for being so new.

 Here's the EUR/USD 5 min chart with what is a very clear negative divergence.

 Remember an hour or two ago I mentioned a head fake scenario above $1.30 out of this triangle? I also mentioned it early today, this could very well be it especially with the chart above.


Here's the Euro hitting the $1.30 area with 2 failures thus far, but the idea for a head fake move is to draw in the longs so I suspect we'd need a stronger move above $1.30. Should the negative divergences continue, we have the clearest signal of the day, except in overnight trade.

For now it's time to let the market develop and to eat some dinner.


On the Greek Fix

"Oh My", That's my first thought after having read what the deal the Troika & IMF just reached on Greece.

I say "Oh My..." not to be sarcastic, not to be dramatic, I say it because it's so ridiculous that it puts even the G-20 forced "Leveraging of the EFSF" to shame in how plainly obvious it is that they weren't looking for a real solution, it appears more like they were looking to get home before supper time. I say it because I truly feel horrible for the Greek people.

The deal reached (one of many) is to lower Greek Debt to GDP to 124% by the year 2020. Just setting aside that Greece has missed every target set forth for them and has had to come back for more bailouts, more time,  has sought to and has changed terms numerous times (the Greek bond-holder's haircut is a prime example) and is generally incapable of hitting any target set that isn't set below instead of above, this deal is unbelievably naive and that's probably why the market isn't going to buy it in my opinion; it may serve as the catalyst for the head fake move outlined a few posts back, but this is not going to be the last meeting and deal on Greece by a LONG shot.

Eurozone finance ministers and the IMF have reached a deal to cut about 20% of Greek debt (details here are sketchy), but the idea is they are making it easier for Greece to reach the target of 124% debt to GDP by 2020.

Whether the IMF and EU stick to their side of the agreement, whether Greece sticks to its side of the agreement so the Troika doesn't have to have these meetings to decide whether or not to disburse the next tranche of Greek aide is totally irrelevant in this case.

Even with the goodies that were just thrown in, Greece would have to grow their GDP by nearly 28% by 2020 to hit the 124% debt to GDP, that's $51 billion dollars and the Greek economy or rather GDP would have to put in one of the most amazing reversals of all time (they better discover teleportation to replace their shipping sector to do this). Here's what the reversal of Greek GDP would have to look like EVEN WITH this deal...

To the left we see actual Greek GDP trending lower in 2010 from about $222 bn Eur to what is projected to be $184 bn Euro before their GDP turns upward and moves to the projected $235 bn Eur GDP by 2020. Considering all the cuts to their jobs/economy in the name of austerity, can you imagine Greece putting in this kind of reversal this fast?

And if you are wondering how the track record for the IMF's previous forecasts for Greece has fared so far, take a look...

I see 5 ever-more optimistic forecasts and each one has seen a dramatic miss, but this one above is going to be the one they actually got right?

It's no wonder the Euro's initial enthusiasm has turned a bit choppier...

On this 1 min chart of the EUR/USD the party lasted all of about 35 minutes before some serious doubts and reservations crept in to trade.

It should be an interesting overnight session. I think sometimes keeping the market guessing is better than a bad answer.


S&P and NASDAQ FUTURES-SURPRISE

I just looked at futures for the S&P and NASDAQ, they have been very sloppy and mushy today, now we have our first clean divergence of the day, IT'S NEGATIVE!

Greece Puts the Euro in Play

So if you were watching the EUR/USD pair as it has been in a triangle all day (and thus kept the market in a narrow range all day) you may have noticed something happened...

 Here's the triangle in orange the Euro has been in since late last night, in green a breakout which can only mean one thing, the Euro-Group/Fin-Min meeting came to some resolution that benefits Greece.

 However it's way too early to start chiseling this in to stone (I do think the Euro passes the $1.30 mark which is psychologically very important and I think it takes the market on a ride much higher through probably at least the rest of the year, of course with scattered shakeout moves. This is the cycle we have been watching under construction since late October.

However, no matter which way the Greek situation went (and I think everyone knew Greece wouldn't be allowed to default) the uptrend in the Euro followed by one of the most recognizable price patterns, a symmetrical triangle, almost demands a head fake move as it is like taking money from a baby. Longs will buy the breakout and when the market lets price drop a bit, longs start selling at a loss, shorts come in and about that time it is reversed back to the upside, this time forcing new shorts to cover. You see what I mean, the longs and the shorts can both be hit on this pattern so I wouldn't assume this is what we will see tomorrow morning yet based on seeing it now. Also as I said, the Greek situation was going to be resolved one way or another, it was just "when?" so I don't think this is a surprise. I have to take a look at the particulars to see if there are any surprises in there, just about EVERY EU solution we have seen, there have been holes in them that sent the market's initial optimism dropping back down and these are almost always obvious immediately-there simply isn't a good solution.

Here's a closer look at the move, EUR $1.30 is coming up and is the first real test of this move.

More on the Greek solution soon...

The Last 6 Minutes

There was an obvious push/ramp to try to get the SPX to close in the green, they missed by -.21% but did manage to hold 1400, they did get the IWM/Russell 2k up, they tried for the Dow, but didn't make it -0.34% and the NDX pushed through the range of the last hour to close up +0.45%. Typically the IWM/Russell 2000 leads risk on moves, however today AAPL's weight gave the NASDAQ 100 the edge.

The final TICK reading still wasn't anything exciting like we saw last week when the market was coming off the bottom and hitting +1800.

Today's NYSE TICK (the number of advancing stocks minus the number of declining stocks for that bar) was very mellow, spending most of the day between -750 and +750, both luke warm readings with no clear breadth winner. The afternoon ramp is obvious as the TICK moves above zero around 3:45 to hit some +1000 to +1150 readings, not bad, but even with a ramp, not that impressive or rather I should say it doesn't stand out.

High Yield Corporate and Junk Credit ended the day almost in line with the SPX, High Yield on its own didn't fare so well and instead sold off from the open right to the close so when the market moved up intraday from about 11-11:30 HY Credit just kept moving lower.

Yields also lagged on the day along with commodities which broke off with the SPX around 11:25 and headed lower as the SPX moved up intraday-still missing the closing green target. That was an interesting move in commodities because they are very US dollar sensitive.

As for sector performance, like the market in many ways, it remained almost totally unchanged on the day, it was like a market frozen in time waiting to see what comes out of the meeting of the European task masters.

I'm going to run some scans and see if there's anything obvious sticking out that I'm missing, but on the whole I think both the ECB and the IMF threw the market for a loop with news that for now has balanced the market out, which way it tips, toward the ECB or toward the IMF "should" be the deciding factor, but I don't really believe anything unless/until I can confirm the probabilities. One thing that did stand out were treasuries, they were in a place we expected them to be, but a place they didn't really belong in quite yet according to where the market was.


AAPL UPDATE

This is a set of signals that are the type I don't ignore, even though I have no idea how the EU resolves Greece, I would almost always take this as a short term short position.

 AAPL 2 min

 5 min

10 min

Another Interesting Chart

This is the EUR/USD...
This is an intraday 1 min chart of the FX pair, note the white box where I mentioned the Euro is trying for a breakout move, then note where 3C is, AT THE LOWEST READING ON THE ENTIRE CHART and right at the same time.

VERY INTERESTING.

EUR/USD- Important

This is where you'll see any information on the EU before news even has it and it looks like the Euro is trying to make a move above the triangle, this is something I said earlier I was surprised it didn't do and then head lower as a head fake move, but now it's hard to know whether it's a head fake on that price pattern or the real thing without seeing the news.

Because the 5 and 10 min charts look bad in the Euro, I'd say if anything it is more likely to be a head fake move.

This may not be settled until the overnight session. I'm not moving any positions, still long the leveraged longs for the cycle that has been put together over the last month, still keeping the AAPL put and FAZ call open for a near term pullback and still holding core shorts, all of which are at a profit for the longer term, but those may be closed upon any pullback, depending on how the underlying tone reacts.

The Difficulty- Fundamental News Not Discounted

In essence as this Euro-Group/IMF/ECB meeting goes on, we are hearing several proposals that have never been heard before, therefore the market hasn't discounted them, there hasn't been a resolution so the market doesn't know how to discount them (up or down) and we are seeing one of those rare moments that the market actually works as it should and isn't (as far a I can tell) manipulated, it's showing indecision because it doesn't know how this is going to end.

Here are some examples among the major averages and which way I tend to lean...
 The DIA intraday 3 min chart shows 1 positive divergence around 11 a.m. and the rest is pretty much moving in line with price, except a small negative divergence later in the day, many times this can be market makers/specialists adjusting inventory/risk.


 The problem is although we had already expected a pullback last week based on last week's charts, this 5 min DIA negative divergence is in addition to last week's charts, it happened today. When I'm in doubt I tend to gravitate toward the longer timeframes. However a case can also be made there that we have a very positive divergence in the cycle that has been under construction the last month+ that looks like this...
This 60 min DIA chart is much higher probability, if I have to take 1 position and not touch it for a month, I'm going long without a doubt and that is how many of us are set up for this timeframe. It's the pullback that is in the right place, sent out good signals and is deteriorating even more today that is caught in this Fundamental news flow as it happens in the EU.

If I have to take 1 position over the next week and not touch it based on what I see above, then it's short for a pullback move. The 5 min is more important than the 3 min, but the 60 min is infinitely more important than the 5 min. This is the web we try to navigate every day, today just happens to be extra difficult as news is effecting the market as it happens from the EU.


 IWM 3 min, this looks better than it should, but still a 3 min chart.

 The 10 min saw a lot of deterioration today alone. All we have is probabilities, not crystal balls, so I'm more apt to stick with the near term probability of a decline/pullback based on this chart, followed by a much stronger/longer move to the upside.

 QQQ 2 min has improved to the point where it is in line or in confirmation of the price trend.

 The longer term 5 min has seen more damage today than last week.

 This SPY 1 min looks almost perfectly in line and it is intraday because the market doesn't know how this resolves.

 The same chart zoomed out though is in a leading negative position, thus the expectation of a pullback early this week.

 The 2 min chart saw a positive divergence at 11 a.m. like the DIA and then moved to in line/confirmation.

However the longer charts that are more important with less noise show more deterioration today than was present last week.

Interesting... Always something new.

Why this triangle dominates ALL trade

We saw this earlier and commented on it, it's the triangle in the EUR/USD...

Why is there so little movement there, a virtual deadlock? This may or may not be fundamental news that was or was not discounted, depending on how good your expert network, uh I mean inside information is.

This is all about Greece and the Euro-Group meeting in which they are trying to solve the perpetual problem that is Greece.

-It is said that the ECB WILL accept Greek Bonds as collateral (you can't get much junkier than that) IF, the next tranche of aide is approved. It's hard seeing that tranche not approved, but when?

-The ECB is also softening its stance on a number of other Greek Bond issues such as their portfolio profits.

Next the IMF (which has recently been at odds with the Euro-Group), the IMF is said to have taken the position that the IMF WANTS EURO ZONE TO CUT GREEK DEBT BY 20 PCT OF GDP UP FRONT, COMMIT TO FURTHER REDUCTION LATER; this could be a $40bn cut in Greek debt. 

The market obviously doesn't know what to do with this one.  

EUR/USD Update

We had an earlier update of the EUR/USD pair that showed a negative divergence as it consolidates laterally in a triangle.

It's looking like the pair are about to make good on that divergence as some pressure is building. Remember a move down in the Euro typically leads to a move up in the $USD, this is market negative equities, commodities and sometime PM's depending on the sentiment.

 UUP (proxy for the $USD Index intraday) with a 3 min leading positive...

 A 10 min leading positive.... For confirmation FXE (proxy for the Euro) should have the exact opposite signal.

5 min FXE/Euro with a strong leading negative divergence since around 1 p.m.

I might Consider Taking Some Profits in FB

As you know I'm a FB fan at the moment, I believe it is putting together a large base and we have thought that since August. I still like FB for the longer term based on the base, but for shorter term trading positions, I might consider taking some profit off the table as many of you have +25% to +40% profits , which is a really tough call right here because we are looking for FB to make a breakout move on high volume to signal the transition from a stage 1 base to a profitable stage 2 mark up period.

I certainly don't like the idea of closing FB altogether as this is in my opinion, just the start. However if you are a trader in FB, it may be time to take some profits and wait for a pullback to re-enter.

 Our first trade in FB long at the green arrow worked out well, in white the base. FB is one of those few stocks that trades on its own no matter what the broad market is doing.

 The long term 2 hour base, very positive so I still love FB as a longer term long position.

 On this +*% move today there's a negative divergence on the 2 min

 The 5 min

 The 15 min and just about everything in between.

I still would like to have some exposure to FB as at the 30 min chart we have confirmation and of course the longer term charts look great.

This hopefully is a great opportunity to pick up some more FB at better prices and lower risk.


AAPL Update

AAPL is updated frequently at certain times, not just because it's a stock of interest to a lot of traders, but because it's a bellwether or a sort of proxy for the market, especially the NASDAQ 100.

Here's some of the action in AAPL that recently changed intraday (changes in character precede changes in trend) and some of the more important charts for near term trade (day/s) as I mentioned in a previous update.

 First in the yellow, even on the fastest, most detailed timeframes, AAPL put in NO positive divergence, recently we have the 1 min putting in a relative negative at the first red arrow, that created a lateral consolidation and during that is where we often see institutional movement (in what most people consider the most boring place) and you can see the leading negative divergence which makes these the only two divergences in AAPL today on this timeframe.

 On the 3 min, again NO positive divergence at all, a relative negative at the arrow followed by  stronger leading negative in the red box).

 The 5 min chart (interestingly where we've seen the action today in a number of other assets and averages) which is the most important thus far in a leading negative divergence.

Even the 10 min chart which is showing excellent confirmation over this period has gone from a relative negative divergence to a leading negative divergence, this is a pretty powerful signal for a pullback move.


GOOG is Another

While we have a longer term Core Short Equity Call on GOOG, I might consider covering it on a pullback at a small profit.

I do believe GOOG is another stock that will pullback in the coming days/s and looks like a decent opportunity here for a very speculative/short term put position.

When the pullback is near over, I'll decide what to do with the larger core short which is already profitable.

LEADING INDICATORS

These are a number of indicators that typically lead the market that we keep an eye on, divergences between most of them and the SPX can lead to early signals or confirmation of other evidence, "3C" is short for some of the best advice I've heard from one of the most under-appreciated technician's and developer of technical indicators that I've ever seen, it stands for his advice to, "Compare, Compare, Compare".

So looking at leading indicators, there isn't anything scary on the charts that would make me fear for our trend expectations, not only early this week, but the intermediate timeframe as well.

The charts I showed you earlier (longer term 5, 10, 15 min) are still developing on the same trajectory, pointing to near term weakness in the market.

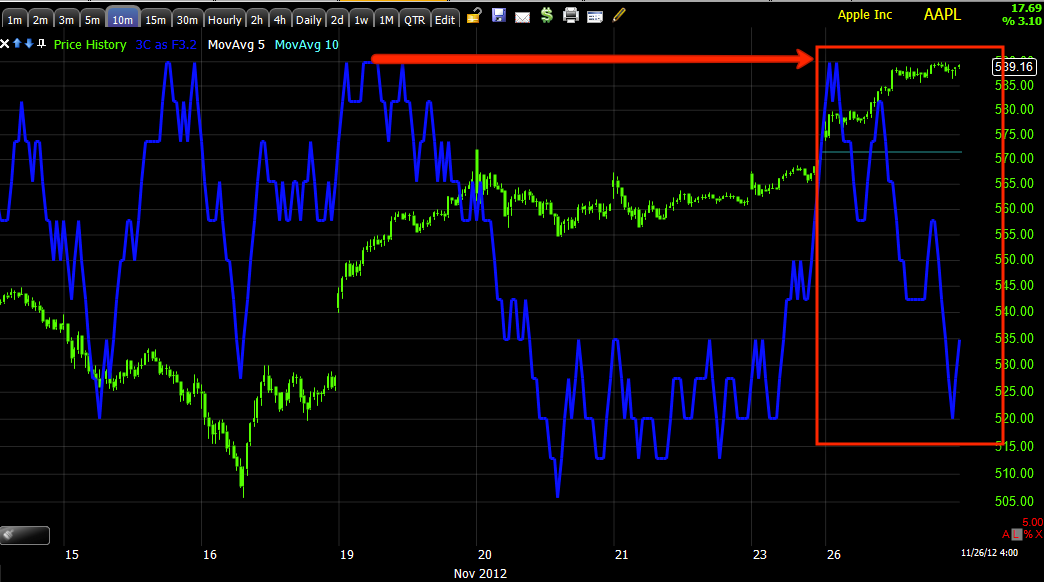
I also noticed a nearly parabolic intraday move in the IWM, those always grab my attention as they typically fail. I also noticed AAPL's intraday charts are starting to give way as they hadn't before.

As for leading indicators, the signals here are very much along the lines of a market pullback as we expected, nothing really too surprising, but good confirmation.

 The EUR/USD pair has been consolidating in what most technical traders would consider a bullish consolidation/continuation triangle, that makes it a perfect price pattern to manipulate and send the FX pair lower (which also would put pressure on stocks and there are plenty of excuses in the EU to do it). The Psychologically important $1.30 level isn't too far off, I'm surprised we didn't see a false breakout above that level and then a move lower, but in any case there's a 3C negative divergence in the EUR/USD as seen above.

 FCT just happens to be a good leading indicator, don't ask me why. Look at the reltive price levels of both FCT in lavender and the SPX in green between the two relative points, FCT is in a negative divergence here.

 On an intraday timeframe FCT pretty much followed the SPX, but recently it made a new low on the day as the SPX was near the top of its range highs intraday.

 Yields show a couple of positive divergences sending them higher, they act like a magnet for equities. Today's intraday price action has seen yields diverge to the downside significantly, this is still a short term signal, but one worth noting.

 "Credit leads, stocks follow" as they say. High Yield credit (in this case Corporate) is used to express a bullish view on the market, Investment grade is a flight to safety. Here HY corp. Credit sees a negative divergence at the highs Friday which also look like a head fake move and it is underperforming the SPX on a relative basis.

 High Yield Junk Credit is seeing similar action starting with a negative divergence at Friday's closing highs.


 Straight High Yield Credit is also showing a divergence at the same place Friday as well as a recent turn to the negative as the SPX was near the top of the intraday range, that was a very specific cue.

 As you can see above, Treasuries trade opposite the market (SPX green/TLT red), so...

It's interesting today that there's a gap up in a flight to safety trade like this when the market has not yet broken down to the same extent, beyond that there's a 15 min positive divergence which we had seen (in other timeframes) last week as part of our analysis for this week, this points to a pullback as well.


Sector Rotation on a relative basis since Friday vs the SPX has seen Financials rotate out along with Energy (2 of the 3 most important groups)  and the high Beta Basic Materials Group. Utilities (another flight to safety trade) are rotating in, Industrials and Tech also look good at least up to this point.