Friday, September 7, 2012

It's All about Easing

When I say easing, that means to market participants, money entering the economy/market which is what has driven risk assets higher since 2009 with the F_E_D's extraordinary measures which were clearly telegraphed by smart money, they understood very quickly that the F_E_D was putting money in the market which these banks with huge loan losses could then make up money rather than the F_E_D having to deal with a Bear or Lehman every month, essentially give them a fool proof way to make money so the F_E_D wouldn't have to give it to them.

In Congressional testimony Bernie defended QE1 & 2 as helping the average stiff by way of the "Wealth effect" (not the same at all as trickle down economics), he argued that the Russell 2000 specifically was up significantly which made average Americans richer by the way of their investments. The problem is, around that time the "U6" under-employment rate was hovering near 19% (25% during the Great Depression), I doubt there were too many average Americans watching their portfolios grow.

Through this process of QE-lets just call it what it is, printing money or dollar debasement, guess who was hurt the most? The most responsible of Americans, the savers as the value of their savings were and are still debased. Guess who else? All of those patriotic Americans that use to believe in buying treasuries and putting them away for retirement. In this manner the Treasury will almost certainly NEVER default, they will pay back debt, just at a fraction of what they sold it for, again through dollar debasement and inflation.

While Bernie was right about the R2K, what few Congressmen would ask (except Ron Paul every chance he had) was what was the downside? The reason they don't want to ask about the downside is the answer would point squarely at their out of control spending. China went from the primary holder of US debt to a secondary holder as the F_E_D absorbed what China was no longer willing to pick up at auctions; the F_E_D who is barred from participating in primary auctions found a simple way around the law, have the Primary Dealers like Goldman Sachs and roughly 45 others including John Corzine's  now defunct MF Global (Remember that? If you had an account with MF Global and lost all of your holdings through re-hypothecation, you remember... *Read your broker agreement, I can almost guarantee you have signed a document allowing your broker to do the exact same thing). The process was called Permanent Open Market Operations or POMO in which the PD's picked up whatever wasn't sold and in many cases they held the Treasuries for a week or two and then flipped them to the F_E_D through the secondary market and made billions on each POMO day which was risk free/free money that went in to the market to bid up any and all risk assets.

The downside (other than what has already been mentioned)?
All risk assets were bid up like commodities in green or the R2K in red; the scam is easy, as a PD like GS you buy Treasuries at auction, hold them for a short period with no risk and then flip them to the F_E_D at insane profits and the same day put those profits in to a self-fullfilling prophecy/market, just inflation started to hurt average Americans and companies as well as Emerging Markets (remember how they were supposed to be the next big thing until Bernie flooded them with inflation as the US's primary export?). You may also remember some of the big Wall Street firms had quarters in which they didn't have a single losing trading day.

So why end the party?
Commodity inflation entered the manufacturing base and every other corner of the economy and input costs sky-rocketed while profit margins were squeezed.

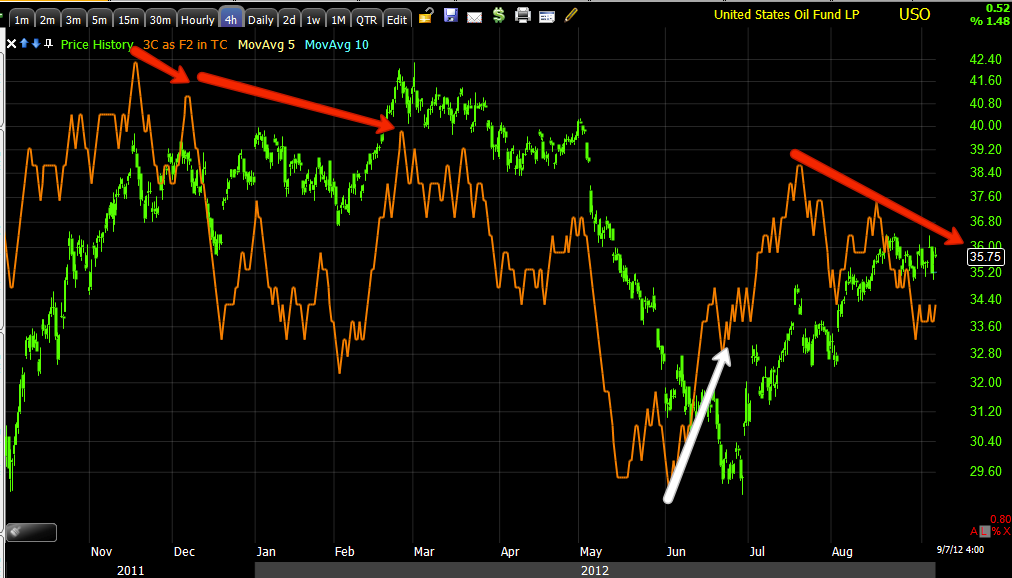
In the red box you can see what has happened since no QE3 followed up the end of QE2, commodities have sunk while the market has remained hopeful that at the next meeting (not literally as in next week, but every next meeting since QE2 ended) the F_E_D would announce QE3 and it's simply wash, rinse, repeat-second verse same as the first.

Gold is the reflection of those hopes as gold is the single biggest beneficiary of Quantitative Easing (When fiat currency depreciates, people move assets in to gold).

Higher gold prices as you can see are not new to the QE cycle, but if yo apply a Rate of Change indicator, you can see the only time the ROC for gold was stable and growing was during the F_E_D's easing, as soon as QE2 ended look at the ROC for gold.

Now gold reflects the hopes for more QE, HOPES! Gold has essentially become a sentiment indicator for the probability of more easing, case in point was VERY obvious today on the leaked NFP number out at 8:30 a.m. today.

 It turns out 3C works pretty well with gold futures, you can see here, to the right is accumulation on a leaked NFP number before the report.

 The NFP came in horrible, for those looking for QE, this is GREAT news and it was reflected in gold as it jumped immediately at 8:30 on the lousy NFP report, but all may not be what it seems as the day wore on. For larger players, they probably understand the gold/macro economic relationship, they probably also understand QE this year is highly unlikely, but there's no reason they can't still ride the gravy train as it appears they did today.

Gold Futures on a longer, more important 3C timeframe, accumulation on a leaked NFP (something the BLS has already admitted is a problem) and distribution in to the move up; note where the first negative 3C divergence is...RIGHT AT THE HIGHS.

As for GLD...
At the blue arrow we had a huge trade in GLD, you can read a bit about it from back then in this post from June 1. This was a 4% 1 day move and about 6% overall, but many of you used calls and made over 100%.

This 4 hour chart shows where the positive divergence was that led us in to the trade, although it showed up in 2 days on an hourly chart. I figured GLD would pullback to the $150 area and then head significantly higher, but since thinking that first Draghi jawboned the market higher with promises of not letting the Euro fail, the next week was an ECB meeting in which he did a lot of talking, but punted, then Jackson Hole in which everyone hoped for a 2010 repeat, but Bernie punted to Congress and this week the ECB bond buying program that is inherently and purposefully flawed so it will seee very little light of day, but the head line was enough to send the market higher yesterday with Gold, yet no follow through in the market today. This 4 hour chart is also (along with the gold futures) showing distribution in GLD, why?

The F_O_M_C is coming up next week, but why I believe with conviction that there will be no QE3 (other than Bernie's less than inspiring Jackson Hole comments), this simple chart...

16 countries that have reported Manufacturing PMI including the US, the Euro-zone, China, Japan, etc have ALL come in below 50, which means contraction in manufacturing; that's 100% of the countries that have reported over the last week or so (many in contraction for multiple months). Of all of the countries we have data on in the world, 80% are in contraction below 50.

When US Manufacturing ISM was released this week, other than being in contraction, one of the key take aways was even with commodities much cheaper now, their input costs are rising. For the average American, food and gas are rising, as a matter of fact, I believe gas hit a new historical high mid-week.

So if you ask what would keep the F_O_M_C from QE3, there it is.

Smart money seems to have this figured out and I'm pretty certain that by the time the F_O_M_C passes or even before, gold is going to be lower.

When we consider the only thing that has propped up the markets, the hopes for more QE, then we also have a problem there. It seems smart money knows this and has known it for some time, at least that's what the charts would indicate, so why not sell at the best prices possible before September and then January redemptions come in on the 89% of hedge funds under-performing the SPX?

Have a great weekend, obviously I have some other thoughts, particularly on the ECB and market charts.

Working on the wrap post now...

FB Update

I think it was just yesterday we were talking about FB entering an area where a pullback was likely and so long as a pullback is healthy, it's a good thing. I don't mean to rule out a consolidation pattern either.

 The area of resistance mentioned in yesterday's update...

 The X-Over Screen is still all 3 long and a pullback to the 22 ma which is typical after the first move to the yellow 10.

 The 1 min went relative negative on the open, but it has gone leading positive since in the afternoon today.

 The 3 min with confirmation, a relative negative on the open and another leading move in the afternoon.

And the same thing on the 5 min.

Just like I doubted the first move in FB as not having enough base support to do too much, I also think these positives in FB are not going to send it higher immediately, but it's not pulling back much here wither and that's where we'd see strength build in, I'd suspect FB is going to consolidate and we'll have some choppy action, probably a price pattern, but I doubt that will matter on a head fake as the stock is so hated, but it may offer some opportunities to add/build a position.

We'll see what it does, but usually we'd get a decent pullback and then accumulation in to price weakness, it's already showing positive divergences, so I think a lateral consolidation is more likely.

BPZ Follow Up

When a decent looking chart like this starts to get a little ugly, it usually has broader implications for at least the sector its in, if not the market.

I still like BPZ a lot and I'll be looking for another position there, for now though, I wouldn't buy it here so I don't see much point in holding it here.

 It's close to daily resistance at the base neckline, there's the chance it pushes through, but I'd rather see a consolidation, some strength gather and a move that will stick.

 Short term charts are raising some red flags, 1 min

 2 min

 5 min

 15 min

 On a longer term basis, I see no reason BPZ doesn't head higher, the 30 min chart is perfectly in line with the trend, but even that has become a little too parabolic.

The daily chart shows what looks like a clear base so I'm sure I'll be looking at opening a new BPZ long on a pullback.

Closing BPZ Long position


Looking for a pullback here and as it's not a core position, but a trading position, I'll be closing it here.

Charts to follow.

AAPL

Some of these charts don't need commentary...
 1 min trend

 1 min intraday, I'd like to see a new intraday leading low.


 2 min trend

 2 min intraday , no commentary needed.

 5 min moving to a leading low.

 Bigger picture 15 min

30 min

Key Trend Channel Levels for USO

 On a closing basis, under, $35 for a major trend reversal.


 On a tactical or intraday basis, the 15 min chart may be a little wider than needed, but around $35.60

And a 10 min chart already has a break.

USO is Close

The core short in USO equity is only about 1.5% away from being green.

 USO 1 min

 2 min

 3 min-the migration we look for....

 5 min, I'd think here there is probably some opportunity to position on slight volatility in about a $.25 range or so.

The major trend in USO

Market Update

I just want to let you know, if you sent an email, I will try to get to it ASAP, I'm working my way through them in between going through charts.

I picked a few charts that are decent representations, they are not cherry picked though.

Futures...
 ES

 NQ (NASDAQ)

 DIA daily chart, the bearish ascending wedge is expected to break to the downside as it did, the only problem was the downside break would have already stopped out any or most shorts as yesterday made a higher high (red) above local resistance and also above the apex pivot of the wedge. Technical traders are taught that Technical Analysis is virtually infallible, so if the the chart pattern doesn't go as expected, reverse your position (in this case go long which yesterday was an emotionally VERY easy thing to do). This is really a perfect chart pattern to manipulate traders, yesterday's knee jerk move on already leaked (a day earlier) ECB policy was in my opinion, more of a psychological set up than anything.

 This DIA 60 min chart shows yesterday's parabolic move, while a 60 min chart "could" confirm, especially if underlying trade was as strong as price made it appear, it usually takes a little time, but there was no effort so as much as I don't trust parabolic moves to start with, as much as I don't trust Central Bank Knee-jerk reactions, this chart adds the 3rd strike.

 A 15 min chart could have easily confirmed yesterday's move, again, not even an effort, in fact quite the opposite.

 Intraday, the 1 min chart is in leading negative position, it does have a small positive intraday divergence within that so maybe some upside volatility, but I wouldn't be buying or chasing it by any means.

 DIA 3 min shows a larger leading negative with a positive divergence within it, it wasn't good for much of a gap, but sometimes it's more about just giving enough support to keep price from pre-maturely collapsing. Today we have a new leading negative low. I used the DIA as an example of what I'm considering when looking closely and stepping back.

 IWM 2 min today leading negative, but...

 it's worse than that, zoom out and include yesterday and the extent becomes apparent.

 QQQ negative, note all the candlestick wicks rejecting higher prices and today's leading negative new low.

 The same QQQ chart with more perspective, adding several days.

 SPY 1 min today, the price range/flat trend often tells us a lot without any other indicators.

The same chart with perspective, today is exceptionally sharp.

Market Update

Lots of ugliness, ES, NQ, SPY, IWM, DIA, QQQ, as well as stocks. I'll get charts up, but this is developing faster than I can capture charts.

GLD Bonus Charts

Here's a look at Gold Futures, I haven't used 3C with these particular futures before, but this version is pretty robust.

 If this version of 3C is correct with this future (I can tell from doing some back and forward testing), then the lows at the pre-NFP release were accumulated, the move up on volume is EXACTLY 8:30 a.m. when the NFP was released, this should clear up any doubts about gold acting as a QE sentiment indicator.

Since yesterday's regular session in dark blue, the overnight session saw gold futures moving to lows well below yesterday's regular hours trade, again at the white arrow is the 8:30 Non-Farm Payrolls release.