Monday, March 10, 2014

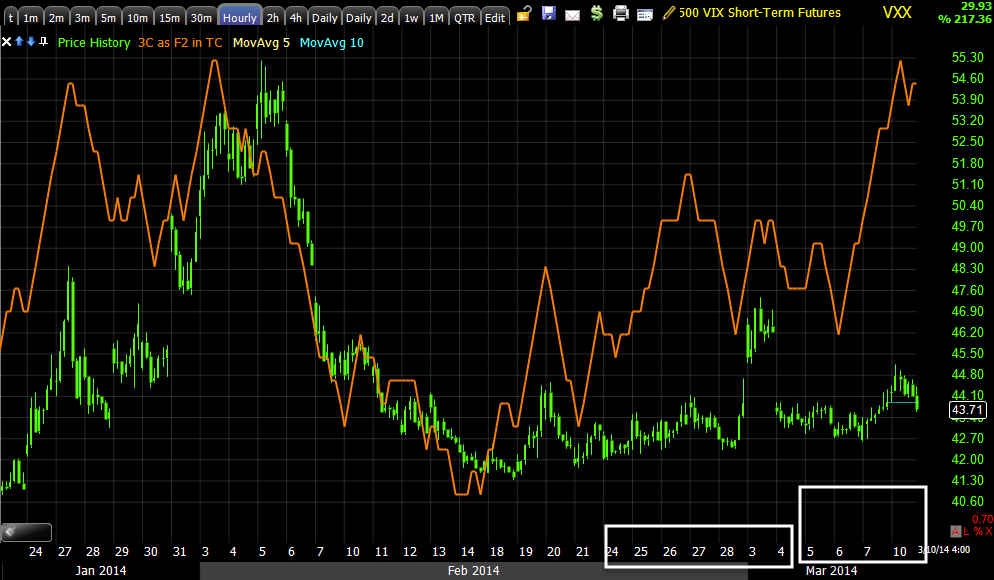
How VXX Ended the day

Being this is a key asset, I think it's important. My personal feeling is that we get some market upside tomorrow as it picked up from where Friday left off and completed some divergences and then they started to deteriorate a little, but not enough that I would change my expectations/guidance.

I think tomorrow VXX will form the rounding bottom that we saw in risk assets/the averages/PCLN, etc today, and that will likely be that, the cue on a VXX long which is the same as a market short call (timing-there's already overwhelming evidence for a market short).


VIX futures are still VERY strong, having migrated from 5 min to 15 min then to 30 and 60 min leading positive divergences.

 This was the negative I saw Friday afternoon that confirmed some market positives, it's still only a 1 min chart, it hit it's pivot on the divergence around 10 a.m. this morning, picking up from where it left off at Friday's close.

This is the exact same 1 min chart on an intraday basis, no leading negative, just perfectly in line with price moving down which is decent relative strength and what we want to see as tomorrow I'm fairly sure we'll be seeing this go positive.

 2 min chart, in line, negative but small at 10:30 this morning and in line on the downside today like the 1 min.

The 5 min still leading positive which is just like the market averages leading negative on the same timeframe as they trade opposite each other.

Of course the 15 min is leading positive and flying as are the 30 and..

60 min charts, that's a HUGE base in VXX, this cycle that started the first week of Feb. but was set up the last week of January was no accident and the fact that VXX has been positive through nearly all of it and held up much better price wise than it should have is just evidence of that.

We're still in excellent shape for new positions and for timing the market's pivot to the downside.

How AAPL Ended

Today's 0.09% gain in AAPL is NOT what we are looking for in a trade coming to us, that doesn't mean it's over, but like a lot of other assets things improved in the morning (they picked up where they left off on Friday's closing 3C charts) and then they went flat or even deteriorated.

AAPL I'm guessing should still be on our radar, but it didn't add anything today which may be seen as a negative in itself.
 The 5 min chart's positive as of Friday which was behind the trade idea, as of today that basically came in to line with price.

This is a closeup or intraday view of the 5 min chart so  as you can see, it added nothing today, maybe lost some ground.

The 3 min chart as you can see deteriorated which would explain why the 5 min is having some trouble.

I think we do need to consider whether or not these divergences from Friday are temporary place holders or temp. support as we often see with 1 and 2 min charts intraday acting as consolidations.

AAPL is still on my radar.

PCLN Update

I think a few of you did take a weekly call out on PCLN and I do think it will move, it's essentially the same set up as AAPL, just replace AAPL with PCLN. The 1-3 min charts look like they'll move, there's a decent, although only day long, reversal process in place. The problem is the 5 min charts and beyond, the 5 min looks horrible so as a long, I'd not hang around too long, I think some money can be made, it's more risk than I'd feel comfortable taking, but I think it will set up another great, "Come to us" trade.

Here's the 5 min chart that is really the fly in the ointment and why I won't get involved (if it were positive or inline I'd probably get involved in an ultrashort term/ultra-leveraged trade, but with this on the radar, it's a matter of probabilities and high probabilities and LOW RISK.

PCLN 5 MIN CHART, A HUGE DIFFERENCE FROM THE 1-3 MIN CHARTS.

As for targets, look at the H&S type top in PCLN, it looks like it needs a right shoulder, that may give you some idea of where to look at a tighter trailing stop or of course we will see things earlier with 3C.


XLF /FAZ

XLF is looking exceptionally bad, almost to the point I can't believe it hasn't crashed, but from looking at UYG, SKY, FAS and FAZ, we have that 1 min positive like most of the averages and then things get ugly. The reversal formation in FAZ is very mature, I'd put these out there right now, but like the market and VXX, I want to see if these 1 and some 2 min positives lead ANYWHERE, it's clear though there's some real damage in the market that was obvious and called out in Friday's afternoon and EOD posts.

I'm glad I have my short positions pretty much squared away, hopefully we'll get a shot at a few more and just have that much more VIX strength and market weakness.

GLD Update

I'm still holding DZZ (2x short gold ETN) as a trading position, more or less as a long swing trade.

Gold has had some very strange price movements, but whenever there's any doubt about a trend, I go to the longer charts and look for underlying action, it's pretty clear in GLD still despite this funky volatility.

 This is that lateral , funky volatility, it's stage 3 and I think you know where I think gold is headed.

 The 30 min chart confirms my suspicions/positions.

As does the 15 min

And the 10 min and several others even though there's some craziness short term, I think this makes for a good swing PLUS short trade.

So I still like GLD short/DZZ, but prefer not to use options here.

Afternoon Market Update

IT IS AMAZING HOW LITTLE HAS CHANGED ALL DAY.

Instead of posting all the charts I'll tell you where they stand, SPY 1 min is positive, 2 min is in line and it goes negative at 3 min and beyond.

QQQ 1 min is positive, 2 min positive, 3 min and beyond are negative.

IWM 1 min is in line, 2 min and beyond are negative.

I said on Friday that I was glad I already had a UVXY position because of this scenario exactly.

The VXX still has a 1 min negative, but that's it, otherwise it's strong.

I'm starting to wonder if these divegrences are just place holders, enough support to keep the market from collapsing while retail buys as they have been doing as far as we can tell from stocktwits, not a great idea in my view.


Market Bounce

Just in case you are considering something like some weekly calls that you may end up needing to close today, I don't think we get too much closer to bounce time than we are right now.

I'll still note that the SPY 1 min is positive which is an improvement over Friday, but NOTHING at the 2 min chart and the other averages aren't too different so if you do try to hitch hike a bounce here, you better be nimble and I'd look at it as a VERY speculative position.

PCLN Update

This is one that just about an hour ago I might have considered as a quick trade using the leverage of weekly options for a bounce and then short in to it like the AAPL play or VXX in reverse, but again, recent deterioration and what is just beyond a 2 and 3 min chart stay my hand in taking these kinds of risks.

 PCLN 1 min positive

Much like AAPL or any number of interesting shorts, all can come to us and VXX remains the timing mechanism.

The 2 min is positive like the 1 and 3 min above, but note the recent weakness in the 3 min to the right like so many other assets I've seen or posted today, I don't think it's enough to keep PCLN from bouncing and offering up a nice entry like AAPL, but this does need to be watched in case these are falling apart.

Also note the nice rounding bottom area, not very large, only several hours and they are proportionate with the preceding move so again it is as expected, but when considering taking the chance of a weekly call for that quick bounce, take a look at the 5 min chart...

That's a major problem and as high as my risk tolerance is, there's a certain amount of evidence you need to have to make a trade high probability. This is a decent probability trade for weekly options (calls / long), but it's not high probability and I make a distinction between the two, over the long run if you don't I think you get carried out feet first.

HYG still hasn't fired...

I figure we still have a bit of time, that's why I hate giving time tables, they always are longer than you expect. In any case, the averages, VXX and HYG were all part of what went in to Friday's call for early this week....This is an abbreviated version and this has more charts and more in depth.

The point being the HYG divergence that was run over Thursday formed up again Friday which fit with the VXX and most market averages for a bounce which you might recall I wanted to set up the AAPL trade which you can find here.

The point is, these few charts can tell us a little bit more about where we are in the analysis.

 HYG's 3 min positive and rounding/reversal process, not very large, but this is what we saw forming Friday so it made sense.

There's some deterioration already setting in even though HYG hasn't made good on the positive divegrence yet, I assume it still will, but the fact there's deterioration setting in already just goes to show why the market or rather Index futures are showing relative weakness vs the Carry trade (USD/JPY).


As for AAPL, you might recall the trade set up is looking for a bounce in AAPL, all of the other charts say AAPL is a decent looking short good for 100-125 points I'd estimate.

AAPL hasn't really made that much of a bounce, but it is much stronger than when we put the idea out as we expected it to be, the point of the idea is to get ahead of the trade and let it come to us.

So I think HYG will fire off and AAPL will at the same time, that should set up the AAPL short trade linked above.

This all makes sense as VXX still looks like this...
The 1 min negative we saw on Friday taking shape matured this morning and turned VXX, but it hasn't pulled back much. Note as well that to the right there's improvement in the VXX, it's small like the HYG deterioration as these two trade opposite each other, but 3C is higher than it should be.

I'd still like to see HYG and the averages up a bit and VXX down a bit, that allows VXX to accumulate with stronger divegrences which are already flying, and that really becomes our market pivot/turning point and where a lot of trades make sense like PCLN short (I'd wait a bit on it like AAPL and VXX) and many others.

So it's kind of a waiting game...

Market Update: Friday's Analysis is Coming Together

For me, I see this as a good thing, when a market does what you expect that's evidence you are on the right track and you may recall I had two expectations, some early strength this week (likely Monday, but every time I say 1 day it ends up being longer so lets just follow the market) and the second part was the pullback in VIX futures would strengthen them, that would open up the VXX long and at that point, I'd essentially be saying, we are at the downside pivot after 2 trading weeks of lateral trade.

I'll admit earlier this morning it looked like things may slide, but we are back on track and still have good confirmation on the second part of the analysis, the pivot.

 This is the 1 min VXX chart with a negative I expected on Friday to see some early minor weakness which should help it's positive divergences as that is accumulated, that's really the timing key.

 The 2 min VXX is in line, the point being is the negative intraday divergence is very weak, exactly what was expected Friday.

The SPY that had no positive at all and was just losing ground earlier has formed a 1 min positive as you can see so this is good as it joins the Q's which have actually weakened a bit.

 And just as the 2 min VXX is in line, the 2 min SPY is weak, being these trade opposite of each other, this is excellent confirmation.

The 2 min SPY on an intraday basis is no more than in line, again the positive divegrence we expected the charts to pick up from where they left off Friday, but it's very weak which was the expectation Friday.

 QQQ  2 min strength from Friday, but it's losing a bit now.

The 1 min chart may explain why, new divergences (weakness) start on the earliest charts, it looks to have skipped over to the 2 min a bit as well.

 QQQ 3 min is already weak so you can see where the market has a problem even with some strength, also note the price pattern, that's likely a reversal formation, it's also quite small, Friday's analysis seems to be right on track.

Finally the IWM 2 min joined the SPY.

I have some assets to look at for entries, but from this point it should be just waiting for our analysis to play out and then taking positions which may come in a hurry.

VIX Futures and VXX / UVXY

These assets are also key in understanding what the market is up to, when I put these out as an entry (long), I think that's when we have an exact turning point in the market, as of Friday after waiting on the signals to mature all week, I thought we were very close and most likely would see these posted as longs today, WHETHER YOU ARE INTERESTED IN TRADING THEM OR NOT ISN'T THE POINT, THE TIMING IS.

So far we are starting to see the flying leading positives that we pretty much only see in the Fear Index, however short term , like Friday they still tell me, "Not quite yet, but real soon" as in, could happen in the blink of an eye.

 You can tell by the shape this is a large base in VXX /UVXY and a strong leading positive divergence like I was looking for all the way out to a 30 min chart here.

VIX Futures went from a leading 15 min positive early last week to a 15, 30 and 60 min leading positive divegrence by Friday, so these are pretty much there, their "Force readiness" has been put in place and checked and rechecked.

The 5 min divergence is starting that "Flying" move, as I said Friday, early market strength this week /Monday will only make these divergences stronger.

 However for the immediate future, the analysis from Friday still stands which is in line with short term QQQ charts...
The 1 min VIX futures looks just like this 1 min VXX 3C chart, a negative intraday divergence, that means a pullback here confirms the Q's 1-2 min positives and a pop higher there, however as you could see by the averages and the VIX charts, it doesn't have long and won't carry far.

This is still one of the best barometers we have on position timing. Of course some charts/assets are ready before others, but with overall flow of the market determines about 66% of the flow of stocks directionally.

Market Update: Escalation...

I'm going to have to watch what's left of some not very impressive positive divergences on intraday charts the last two or so hours of Friday, in fact certain averages didn't have anything like the SPY, it was the Q's that had the best positive divegrence and that early strength or at least not a full on collapse was predicated on the divergences not being run over, a 15 min divegrence doesn't get run over very often, but 1 and 2 min ones are really like flies for what's going on in the world right now.

.Here's a look...
 As we saw late Friday not even the most sensitive 1 min chart could find a divergence on the SPY, it is in line which is price/ 3C trend confirmation, no analysis was based on this because there's no signal there other than what price is doing.

However as you may remember our AAPL set up (possible trade) from Friday and what we saw in the Q's late Friday made that set up seem more likely, it still does for now...
 QQQ 1 min has stayed positive since late Friday and even added a bit, that AAPL set up may just work, but this needs to be watched and I'll tell you why in a minute.

The QQQ 2 min chart also leading positive from the same time as the 1 min chart above Friday.

However, as I said, I didn't expect much as the divergence stopped there... 
 the 3 min QQQ is where there's a transition to in line and as you go longer it transitions in to the negative, thus my thoughts Friday that we wouldn't see a huge collapse early this week, maybe even a little strength, but I didn't expect it to last very long, the IWM is a good example as to why...

The IWM 1 min chart is now in perfect confirmation, no divergences and it's headed down on some recent escalation in the Ukraine.

As of Friday.. this was the other half of the analysis... 
5 min leading negative in the Q's so a 1 min and 2 min positive in the Q's can only take or hold us so far for so long, eventually (and not that long a time) we will see the market have to contend with this and worse, this is just the closest.

As to what's going on, late last night I mentioned Ukrainian forces were mobilizing from all over the country moving Howitzers, APCs and other heavy armor under the guise of "Routine military readiness drills", the mobilization over the weekend was anything but routine and it appears to have set the Russians off a bit as it may have been intended to, although the Ukraine and the rest of the West has been several footsteps behind Putin this whole time, if the leaders bought Putin's Tuesday olive branch like the market did then shame on them, the market doesn't know any better, they should have.


  • RUSSIAN TROOPS OPENED FIRE DURING TAKEOVER OF UKRAINIAN MILITARY POST IN CRIMEA, NO ONE WOUNDED -INTERFAX QUOTES UKRAINIAN BASE COMMANDER
More... As Putin clearly sees the Crimea as Russia's, the referendum is less than a week is a mere formality, it's when the Eastern section of the Ukraine seeks the same that we have a REAL problem...


"Russian troops opened fire with automatic rifles during a takeover on Monday of a Ukrainian naval post in Crimea, Interfax news agency quoted a Ukrainian officer as saying.

The unnamed officer from the motor vehicle battalion of the Ukrainian navy said Russian troops broke in to the base near the inland town of Bakhchisaray some time after 2 p.m. (noon GMT), took mobile phones from the Ukrainians and began trying to remove vehicles. None of the Ukrainian troops was hurt and the base commander was trying to negotiate an end to the action.

Further details were not immediately available. Russian forces who have taken control of a number of military installations across the Black Sea peninsula have not so far exchanged fire in anger with Ukrainian troops."

As mentioned last night, "Putin might invite talks on Ukraine, but not Crimea which he sees as a done deal". In response Sec. of State John Kerry has cancelled his Russian visit...
  • RUSSIA'S PUTIN SAYS TOLD FOREIGN MINISTER LAVROV TO INVITE U.S. COUNTERPART KERRY FOR MORE CONSULTATIONS ON UKRAINE
  • RUSSIAN FOREIGN MINISTER LAVROV SAYS HAD INVITED KERRY TO RUSSIA TODAY, BUT KERRY SAID ON SATURDAY HE WOULD LIKE TO POSTPONE VISIT
  • RUSSIA'S LAVROV SAYS RUSSIA HAS OWN PROPOSALS TO RETURN UKRAINIAN SITUATION TO THE FRAMEWORK OF INTERNATIONAL LAW, TAKING INTO CONSIDERATION INTERESTS OF ALL UKRAINIANS

I don't know if tensions will hold in check long enough for these baby divergences to get something off the ground, but I'd certainly be looking to add some positions that I've so far been very patient with such as VXX or UVXY long or any of the inverse leveraged market ETFs like SQQQ, SPXU, SRTY or SDOW.


Changes...

After really outperforming the correlation that has existed between USD/JPY and ES since November of 2011 on the February run, I've noticed at least 3 times over the last week ES and other Index Futures' weakness in underperforming the Carry Cross (carry trade) correlation, this morning and since last night's futures open is just the latest example even though I still estimate that ES is still about 70 points rich to the overall correlation due to the short squeeze in February after a bear trap was set during the Jan 27th-Feb. 6th accumulation period, a true head fake move and the Feb. rally was the result, one example that will definitely be in my 3rd article in the series, "Understanding the Head-Fake Move: Examples".

 This is the USD/JPY in red and green price bars vs ES in purple on a 1 min chart overnight and through this morning...you can see the clear underperformance this morning since about 7:30 a.m.

This is the opening of the new week to the right on a 5 min chart in which ES is also underperforming, it's a bit more in line with AUD/JPY, but that carry trade seemed to be hit the hardest on last night's futures open and just before on the FX market's open.

The point? Regardless of the short term "Pick-up where you left off" 3C concept, "Changes in character lead to changes in trend", and just what has the trend been? As I showed Friday afternoon, over the last two weeks the example average, NDX-100 had lost .32% over the last 2 weeks, I'd call that a lateral trend which is certainly a change in trend form the February rally, what usually comes next, well that's what I was mentioning late Friday after going through the 3C signals, whether a short cycle of a week or one of 2 months, we'd be at stage 3, stage 4 or DECLINE comes next.

The market is not as hard to predict as you might think if you know where you are in a cycle.


Futures

Just as envisioned late Friday based on the 3C signals picking up today where they left off, that patch of weakness last night on the open of futures was filled in with a small USD/JPY ramp around 3 a.m. so we should have an open pretty much as described Friday afternoon, I still have no reason to change my mind as to where we go from there, also part of Friday's analysis.

ES 3 a.m. ramp to take up the opening weakness and further deterioration from last night's open.

I don't see any news of note.


The Week Ahead

I hope you a great weekend.

Moving in to the new week, other than the Ukrainian/Russian situation, we have a collapse in credit in China with some of the worst export deficits seen. Copper is in free-fall as the collateral is being sold as Chinese banks make cash calls, bond deals are being halted, Chinese banks are hoarding cash. Japan is imploding with some of the worst macro data on record and Abenomics an utter mess. Tensions are rising between China and Japan and Europe's fate may reside in Russia's Gazprom, but other than that and a plane missing like it flew through the Bermuda triangle, everything is hunky-dory.

First in China, the Global Recovery is perhaps not as real as some would have hoped or tried to sell. China's Exports collapsed Friday -18.1% y.o.y on consensus of a +7.5% rise making this the BIGGEST MISS ON RECORD and the second biggest deficit on record. The February month on month Exports printed DOWN -34%!

China banks are hoarding cash as evidenced by the 7-day repo rate being near record lows, but the Chaori default being allowed to happen has spooked the Chinese market. Corporate Bonds are falling, banks won't lend , new deals on debt/bonds are being cancelled for lack of cash as the banks hoard it. Copper has gone limit down in Shanghai for the day as cash calls (as copper has been used as collateral for cash) are coming in, down -5% as companies sell whatever they have to meet bank cash calls, Iron Ore is following in the same footsteps for the same reason. The Yuan has dropped the most in trading since 2008. Most Chinese futures are down around -1.7 to -2+%

Other BRIC nations are faring no better with seeing 20+% declines in exports as the Emerging Market Crisis is truly taking on the shape of a crisis.


In Japan, Abenomics as we saw when first released with QE-Zilla, is the disaster we predicted in the two articles on the member's site, "A Currency Crisis " written April of 2013, it was evident back then and is more so today. Sunday night Japan printed the WORST account deficit on record and the worst GDP growth since the introduction of Abenomics.


If that weren't enough, Japan scrambled military jets as China provoked them again by flying a spy plane and two bombers between two Japanese Islands (but still in international airspace) out to the Pacific and then back on the same route.

However the real trouble is still in the Ukraine.

Saturday morning pro Russian forces fired in the air at a convoy of the Organization for Security and Cooperation in Europe (OSCE) who was making a third attempt to enter Crimea, they were turned away as they were told they had no authority to enter Crimea.

Russian soldiers are said to have stormed a border post, seizing Ukrainian border guards' weapons, BEATING THEM and sending them and their families fleeing the area after taking their mobile phones presumably to make sure no photos or video were released.

Next the Russian Defense Minister is said to be considering canceling inspections that are part of the 2010 Start treaty to reduce nuclear arsenals , saying that the US/NATO threats are seen as an "unfriendly" gesture.

Sunday morning we saw news that the Eastern City (this is where the real problem and threat of break away would be most damaging) of Lugansk in the Ukraine (not in Crimean territory) saw Pro-Russian mobs take over the City's Administration building with demands that they too BE ALLOWED TO PARTICIPATE IN THE MARCH 16TH CRIMEAN REFERENDUM TO JOIN RUSSIA.

It appears, despite denials from the Ukrainian government, that Ukrainian forces are being mobilized across the nation as all kinds of heavy weaponry was on the move. Meanwhile Russian forces are digging in in Crimea and pro-Russian forces are laying mine fields.

The USD/JPY and other Yen based carry trades opened like this tonight...

5 min chart, the pair gaps down, meets resistance at the gap and is rather flat. The Index futures are down a bit, but not that much of a move.

ES down a bit on Sunday night's open , about -.34% while the Yen which I mentioned last week has the highest probabilities of gains, has retraced just about all of Friday's losses making me wonder if it indeed was a head fake move on Friday as I suspected.

30 min Yen and possible head fake move on Friday, recovering well tonight, remember a higher Yen sends index futures lower on the carry trade being covered.

It would seem to me that unless something major happens that Friday's late day 3C analysis of some early price strength or at least not a complete collapse is probable, there's talk Putin may consider Ukraine talks, but says Crimea has the right to self determination and Russia is there under international law so that's obviously off the table, but perhaps the news that Putin is willing to consider talks will send the retard market up early, of course anyone who believes Putin, just remember the Tuesday de-escalation of tensions as Putin seemed cowed, he was obviously ANYTHING BUT which could bring the rest of the analysis of broad market weakness early in the week in to play, for a recap of that analysis, check this link  and this link...

I see nothing that changes my mind as to early action this week since Friday's posts based on the charts linked above.

See you in a few hours.