Thursday, October 18, 2012

GOOG and Analysts

I found an article interesting reading on GOOG and analysts, as you know GOOG has already been a core short position in the equity model portfolio, I was hoping to add a bit more to it and still may, however, here's what is interesting.

Of 44 analysts covering GOOG, 82% have a BUY rating (the others are SELL/HOLD), the highest target was $910, the lowest $660. We've been watching GOOG and other than price action which clearly has undergone a change of character in the last month, it was the underlying 3C trade that enticed me to open GOOG short. I'll say right now, my target is quite a bit lower than $660! A simple 5 day chart with a few years of history shows you that $660 is nothing in perspective.

For an interesting read, check out YESTERDAY's (Wednesday's) GOOG update!!!

The GOOG daily charts...


 Negative and positive divergences in 3C since 2007.

Note where price topped in 2007 and where it recently topped and then compare where 3C is at each area, right now it is in a leading negative divergence at new lows, even below the 2009 bottom!

As I showed earlier today, parabolic moves tend to end badly...


USO Trade Setting Up

It looks like we have a trade on deck ready to jump in to the boat, these are the ones I like, it's Oil or USO (short), SCO could be used (long) also.

The beauty is the lower risk, if it doesn't give us the setup with lower risk, we don't have to take the trade, it's good to be picky and that's your edge over Wall Street.

I don't envision this as a primary trend trade, there's too much uncertainty in the world, but a trip to about $30 sounds about right and with a little leverage like SCO, it looks all the better.

 Here's a flag-like consolidation, except it's actually a bullish ascending triangle, in either case what we want to see is a gap up above the $34.70 area, $35+ would be good. So long as the charts stay negative on that gap the way they did when the SPTY tried to break out intraday today, the trade should be great.

 Short term it's going negative, so it seems as if it is close to being ready, the head fake move is all that is really left.

 The mid-term charts are negative-10 min

The 15 min-and this is about all we need to get to $30.

As for CL/Crude Futures...

 CL 30 min


CL 60 min

They're on board too.

CMG -10.5% in AH

After missing earnings, CMG is down -10.5% in after hours. A member asked if there were signs of a leak, I don't really need to look for signs of a leak, when a stock looks this bad, it's just a matter of time, but there is an interesting little final life raft in the trade.

After really getting knocked around there was one last lifeboat for some money to flee CMG, it's in the red box. Below is the 3C action for that period.

 As you can see price was low, some shares were accumulated lifting price by 21% and those shares were promptly dumped, not only did they get out, but they made some money on the trade too to make up for whatever was lost on the first gap down.

When a multi-day chart looks this bad, few stocks come back from this, but could most traders sit through a 21% move against their short? This is why we need to see the underlying trade.
CMG heavy distribution in to 2012

Manipulation

I can't think of a better name for this post because from what I have gathered we are not only in the middle of manipulation in the form of a shakeout, say AAPL...

 AAPL broke below the daily H&S pattern (red arrow), that's where the shorts would enter as it provides confirmation, but the next day AAPL put in a bullish hammer reversal candle as well as support and for 8 days now there hasn't been 1 follow through day or move below that hammer.

We're looking for a volatility shakeout of the shorts at the orange arrow, but that was halted right there, I now it's a key short set-up and the next day down would be the confirmation, but after that there was no reason not to bust through the neckline and start the shakeout.

This 30 min AAPL chart shows a positive divergence strong enough to lift us from the lows and a leading positive position strong enough to finish the shakeout, yet we flop around in the range.

Today after seeing downside, but NOTHING that would alter AAPL's technical position (essentially a noise day), we see a 3 min positive divergence start to lead, that means the downside in AAPL was almost certainly accumulated today and it may be for the volatility shakeout above the neckline which I think we see either way, but it also very well could be this...

This is probably not based on the most up to date options information, but a pin of AAPL somewhere around $640-$650 looks like it would cause the most damage and cause the most options to expire worthless, seeing as it is mainly Wall Street that writes options, collects the premiums and then seemingly works hard to pin the asset so they can keep the most amount of premium, I can understand why nothing technically significant has happened in AAPL in about 8 days.

I calculated that on YahooFinance data using open interest and strikes, but the best way is to use cash value and according to a website that calculates this for you (again probably not using the most up to date option information, but close enough, this is max pain...

That would be $640, that may explain why we see a positive divergence on a shorter timeframe when AAPL closed at $632.61

I'm guessing that we'll see that shakeout as op-ex Friday passes tomorrow.

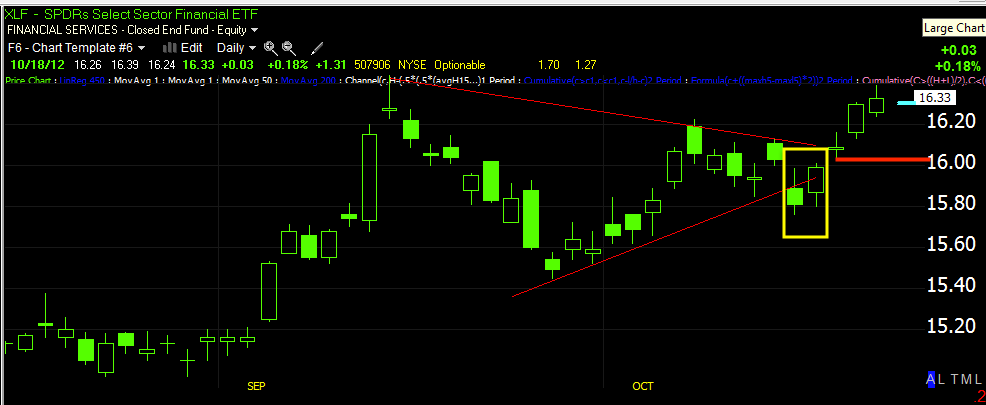
How about XLF as it looked very much to me like we'd see Financials rotate out tomorrow and tech in?

XLF closed at $16.33, so far max pain is at $16.

Lets see what would happen...
We saw the move below XLF's triangle and called it a head fake and that XLF would move higher before it really moves lower. If you look at max pain at $16, it puts price right at the apex, essentially right at the place in which anyone buying puts or calls would have NO OPINION on which way Financials move from here. It would also be about a 2% drop, that would be a 6% gain for FAZ (here's hoping) in a day.

 The XLF short term 1 min chart went from positive sending XLF higher to quite negative suggesting XLF moves lower in the very near term, like tomorrow!

The longer term 30 min chart isn't that bullish, but it is in line which means XLF could do what we expect and move higher from here before it makes a real leg down lower.

As far as manipulation goes, that would not only be manipulating the shakeout to the upside we have been looking for , best exemplified by AAPL, but also manipulation of the pin on options expiration.

Like I always say, even if the market is quiet, there always up to something.

Many of you may recall my posts this week showing negative divergences in the 5-10 min timeframe and prices moving sideways, I talked about consolidations and how they could move through time (sideways) or through a pullback and remarked that I had never seen such strong divergences only cause a lateral consolidation, well it seems the reason is pretty simple, options expiration pin.

Last months op-ex pin saw the market or the SPX move about .50% the entire op-ex week, essentially it was pinned all week. We have seen similar behavior this week.

As for Tech, which I said I thought would move in to rotation with financials moving out, XLK's max pain is $31, it closed at $29.98 today, so we'd expect to see a positive divergence...

And there it is, I thought XLK fell apart as it closed the gap, but it was really GOOG, in any case it looked to have been headed down either way with an intraday negative divergence in place, during the afternoon we see a positive divergence, but perhaps more important than the divergence in XLK/Tech is the one in AAPL as that should lift Tech.

As for the QQQ, keeping in mind this isn't the latest and best options data, it's from YahooFinance, this 3 min end of day positive leading divergence in the QQQ as well as that of the divergences in Tech would suggest for the op-ex pin the Q's would have to move higher.

 And max pain ? $68, we closed at $67.32.

Most interestingly to me was this chart below and the same type of chart can be found in nearly all of the averages...
A 10 min leading negative divergence caused a consolidation, but not a pullback. There's nothing wrong with that as far as 3C is concerned, it's just not usual, but that divergence held the QQQ in this range for 2.5 days and when it fell out, we have the short term positive that looks like it will send it right back up toward the $68 area.

Interestingly, with the data on Financials from my market hours analysis and from the data above, since the SPX carries a lot of weight in Financials, you might think max pain for the SPY is lower than where we closed today-again that rotation of one group or average closing one way and another closing the other way.

The SPY closed at $145.87, max pain for the SPY as of tonight is $145.


Since the positive divergence sending the SPY higher and toward the level Max-Pain figures is the area, we have seen that negative divergence (here a 3 min chart) that has kept the sPY consolidating sideways and losing some ground today after a failed attempt to breakout earlier in the day.

Still, as far as the continuation of the upside shakeout, the SPY 30 min chart like the others, says it is certainly possible, in fact likely.
SPY 30 min in a slightly leading positive position still has room for more upside as we have been expecting.

So if tonight's numbers are correct from MaxPain or close to it, they confirm what 3C ha been saying not only about the averages, but industry groups, the different trends we have expected and all kinds of interesting stuff such as the lateral consolidations. I for one am excited to see what happens tomorrow.

As for plans, I'll still listen to 3C and the message of the market, but I'm guessing that short term trades for the pullback will be closed, I may look to enter some new longs for the shakeout move we have been expecting and that started this week, other than that, not much has changed in the outlook.


Have a great post coming out

I think you'll really enjoy this next post, you are going to see the inner workings of the market and specifically as it relates to option expiration.

I was just thumbing through the charts and it came together all at once, you should benefit from the knowledge, it may change some of the short term trades and help you understand the future moving forward.

I have a lot of charts to capture, but it will be up, don't miss this next post.

Financials vs Tech

I'll get the charts up ASAP, but I do think more rotation is what we are in for, Financials are showing more negative trade today whereas Tech's underlying 3C trade is improving. They may bother be down tomorrow, but I think we will see worse relative performance in Financials.

Chances are excellent that for the market averages, we don't move too much from where we are now, Op-Ex pin, that's just the way it's been.

Member Question re: GOOG's impact

I had a member email asking the question I asked earlier, what will GOOG's impact be on the market in both the near term as far as our plans go and if it has a longer term effect. The truth is it will take several days to really know, but this member was specifically interested in FB and MCP, two longs that are both longer term positions (FB more so than MCP) and the truth is, I don't see much that has effected them, especially MCP.

One thing I noticed since QE3 was announced, the high fliers haven't been looking good, the stocks that are maybe overvalued (P/E) and I suspected that we would see people looking for bargains that have been beaten up and selling stocks they feel they may get caught in a bursting bubble, GOOG may do more in that area of market psychology than anything and this creates the Super-Stock-Pickers environment I have been talking about.

As for our two positions, FB did move with the market which isn't surprising, MCP not so much.

The charts...

FB
 The red arrow is about where GOOG came out on this 2 min chart and FB did respond as I imagine most of the market did, but seeing a positive divergence in to that pullback this afternoon is the first hint that GOOG maybe didn't have much of an effect on the intensions of those putting the base together. Will they welcome lower prices? YES! There isn't a negative divergence and this is where we'd see it, there isn't even an in line, it's a positive so while some stocks may be effected, I think FB will probably not be among them.

 FB's longer term 30 min chart is still in a very positive place, it will need a day or so to settle and catch up, but I don't see anything that is sending up red flags.

MCP
 MCP daily volume is picking up, we aren't seeing a strong close, but we have follow through thus far on volume so that's a good sign and it's no different than this morning except we have the volume.

 We also have a bull flag consolidation, normally I'd be looking at whether this gets manipulated or not, but I think MCP is probably not on too many longs' radar right now.

 The 2 min chart is in line, it didn't suffer any GOOG inflicted damage, so thus far the answer is no.

A bit longer term and MCP is still in good position.

I do think GOOG will be a poster child for the high fliers and the parabolic movers this year that we have seen, I think those get sold off-AAPL included, I think the stocks that have been neaten down are where people will feel more comfortable being in the market right now.

FAZ Long Equity

Earlier in the week it was FAS long for a quick 5+% gain in a couple of days, now I'm going to open a speculative FAZ position.

I don't expect this will be much longer than a day or so, but the signal is there, sometimes you just have to take what the market offers.

Another Quick Trade-FAZ long

This might be worth a shot, Financials were in rotation today -.12% vs. -1.35%. It seems to me we have more downside in the pullback and it is likely to rotate just as the longs did earlier in the week between Tech and Financials.

If that's the case, then Financials short would be the play, but again keep in mind these are very speculative and nimble trades that you have to be able to get out of pretty quickly, also the position size should be speculative, this is about as speculative as you get.

When comparing FAZ (3x leveraged BEAR Financials) to FAS (3x leveraged BULL Financials), some interesting things appear suggesting that rotation.

These charts show confirmation and they show that it's a short term trade.

 FAZ (short financials) 2 min leading positive divergence suggesting in the near term financials fall/pullback. The trade would be FAZ long.

 FAS (long financials) 2 min chart have a negative divergence suggesting the same thing, Financials fall in the near term/pullback.

 FAS long financials  3 min is leading negative

At 30 min there's still a positive position so this fits with the market outlook for short term and more upside after a pullback.

Basically it's speculative, it counts on rotation and it's a quick leveraged trade, but I think probabilities are good that it works.

Leading Indicators

What I notices in leading indicators (formerly Risk Asset layout) is that the suspected head fake move above local resistance in the SPX today could have been confirmed with other evidence from leading indicators, but 3C did a good job on its own there and what I mentioned in the last post about sector rotation among the averages as the QQQ is down the hardest today, the next to go down will likely be one of the other averages.

*Comparison is always the SPX in green unless otherwise noted
 In High Yield Corp Credit, there was a positive divergence in HYG vs the SPX early in the day and a negative at the suspected head fake area, right now they are pretty much in line. This is part of the confirmation I mentioned above.

 Longer term (as in to maintain a bounce higher), HYG credit has a pretty impressive positive divergence here and now on this last bottom reversal, it should allow for more upside before HYG starts leading with negative indications.

 Junk credit showed the same confirmation of the head fake breakout in the SPX today as it failed to follow, the longer term (bounce higher) chart is the same as HYG right above this chart.

 Strangely Yields are a bit more bullish right now than the SPX intraday, we'll see if there's some closing reason why.

 The $AUD is almost exactly in line with the SPX intraday...

 Longer term (bounce higher), it has the same positive posture as HY credit, but we are still only talking about enough for a volatility move up to shake out shorts, go even longer term and it turns very ugly like the 4 hour 3C charts.


 The Euro as mentioned many times is a better confirmation currency than a leading indication, it also would not confirm the SPX's intraday attempted breakout run.

 Commodities intraday are stronger than you'd think, this is obviously part of the rotation we are seeing as the QQQ isn't commodity heavy if it has any at all of note.

Sector rotation makes this clear as well, Industrials (Dow) are in rotation, basic materials and energy (Commodities, S&P, Dow) are in rotation today, Financials (S&P) are in rotation, OUT OF ROTATION, TECH and look at the QQQ.

I think we'll see this shift just as we saw our longs for the first two days of upside shift from Tech to Financials.

Market Update

This market is getting very emotional, it's hard to believe that short interest is so low. I still want to check the Leading Indicators and I will next.

As for the market, I was checking for a few things, 1) since in several averages like the QQQ and SPY we have either seen a pretty big move on the day or a big move intraday (range),  I wanted to make sure there were no positive divergences on short term charts that would threaten the 10 min negatives that suggest the market see downside which I have been calling a pullback. Secondly I wanted to make sure that the 30 min charts that have had enough of a positive divergence to move the market higher after a pullback haven't fallen apart, so far so good.

We probably have more room for downside although it may rotate from the Q' today to the SPX tomorrow or maybe the DIA/IWM. I'm still holding speculative positions for a pullback move such as UVXY and FXP, after that I'll be looking to add back the longs I closed near the top of the 2 day move up like TQQQ and FAS, maybe URTY. Eventually I want to get to an area where I can close those and finish up with core shorts.

So far I don't see much that throws that plan off track, although signals are getting more extreme for obvious reasons.

 DIA is still sufficiently negative to expect the probabilities to be on the side of a DIA move down (pullback).

 The 30 min chart has held together well enough to expect the longer term trend after the pullback has enough gas in the tank to take the market higher.

 QQQ 10 min negative is seeing the expected move, it may indeed have more to go, I'd think it does, but I think we will see rotation and perhaps tomorrow the SPX will be the downside leader (as an example).

 The 30 min QQQ chart saw some damage, but it can still lift the Q's.

 SPY 3 min looks like the SPY owes us some downside.

The 15 min chart here really looks good for continued upside after the pullback.

So I think we are still on track, it's just getting more interesting in how rotation in the market has come back with a vengeance, but I'm not sure it's for the right reasons or will signal what it use to signal in the past. Things change.