Friday, January 18, 2013

ES Still Diverging

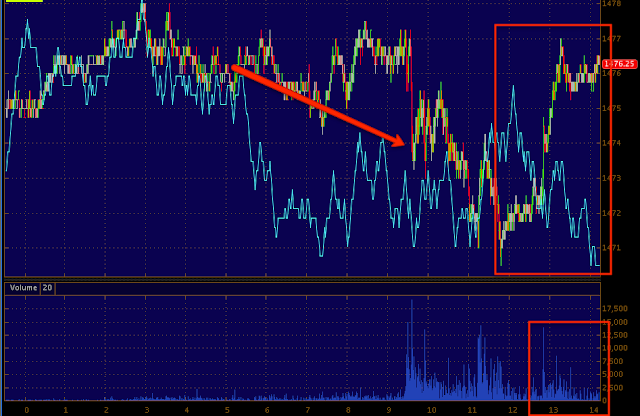
Just 1 minute before the close ES hit a new high for the week, but 3C is in its second day of a persistent divergence and a new low on the leading negative divergence today as ES hit a new high, this isn't normal action, but we have seen it before, you may recall the outcomes?

3C for ES is pretty darn reliable as an intraday indicator, to see a persistent negative divergence totally threw me the first time, the second time I trusted it and I trust it this time. We have a new high and a new 3C low.

It seems like $148 was the pin for the SPY, a member checked as I had mentioned and emailed me that $148 was the pin. Volatility /VIX was the lever as you can see the Euro couldn't get the job done with the $USD's strength today vs. yesterday. It looks like a QQQ pin at $67, the DIA just above $136 ($136.07) and AAPL was so predictable, I said it a few times today, it closed at $499.96!!! FOUR CENTS AWAY FROM THE MAJOR CENTENNIAL MARK AND PSYCHOLOGICAL $500 LEVEL. 

I'll be looking around and seeing what's interesting, what's not and I'll be reporting back as well as adding a few things this weekend to the site.

Have a great weekend and I'll be posting again soon.

I just can't believe that AAPL pin even though that' exactly what I expected ($500).

Lots of Emails About UNG Today

I'm actually surprised how many emails there were about UNG today, it "seems" like a boring stock compared to AAPL or AMZN, but long term members who know all the reasons why we like it and now a lot of newer member who have been buying it are pretty excited about it and honestly for a asset with such a low Beta, I'm really excited about it.

For newer members, since we have been following developments in UNG since probably this time last year when not only the Rate of Change (ROC) in price gave away a change in character, but volume was a huge change and changes in character precede changes in trends, I want to share a few reasons why I'm excited about UNG.

First of all its a commodity and a clean energy source that is abundant in the US, it's really the center piece of US energy independence and doesn't have the resistance that oil, coal or nuclear have from different groups.

While we knew something was going on, the same way 3C spotted something going on in the home builders during the 2000 Tech crash (who would have thought homes that were appreciating 2-5%  year on average were going to lead the next bull market after the tech revolution?), we didn't know exactly what it was. This is how the market and 3C's view of the market always aren we, if you want to wait for certainty and understanding, you'll miss the chance to make money.

Then we had the Arab Spring, without getting too much in to the geo-political landscape being redrawn in an oil rich region of the world, the fact of the matter is it' hard to put a solid new government in place that isn't a dictatorship. Why do you think Saddam and these other dictators have stayed in power so long? It's because the middle east is deeply divided, whether religion -Jewish, Sunni, Shiite, etc or  Arab or Persian, those who have vs those who have not, there are a lot of things that separate these countries and a lot of it is because of the arbitrary borders drawn up in the mid 20th century that created countries like Iraq with Sunnis, Shiites and Kurds all in the same mix; only strong handed dictators can hold those countries together. With all of US/coalition military might in Afghanistan, 11 years later the government  still can't project power outside the capital on their own.  Basically, as far as geo-political ramifications go, we haven't seen anything yet from the Arab-Spring-just look at Egypt recently.

Putting aside the cost of gas and the potential cost f trouble erupts in one of the canals, there's obviously been a push toward energy independence and a lot of strange characters have been popping up, not because they have great ideas, but because they see the profit of an all new energy industry.

One of the things that really struck me about Natural Gas was Bernie's semi-annual Congressional testimony which is like the Superbowl for anyone in finance, they all watch it. I found it very strange that one Congressman asked Bernie about energy independence and specifically plugged Natural Gas, what does Bernie have to do with shaping Energy policy-if anything he tries to ignore it in their inflation figures. However this was that Congressman's opportunity to get a free commercial during the Superbowl and it was really a rhetorical question to push NG.

Later in 2012 the administration/EPA (I believe) passed a new emission standard for any new US power plants that eliminated clean coal and left only nuclear (URRE) and Nat. Gas (UNG). All of the sudden, Nat. Gas just saw a huge potential demand increase. So things are starting to fall in to place.

Many of you know that I had a "Person in my life" who worked for one of the big 2 ticker investment banks and he passed on to me the analysis research papers that the different trading desks used, whether FX, commodities or stocks. I thought I hit the lotto, but every idea I tried to follow failed, you now why? Because Wall Street plans these things way in advance, they need to because of the size of their positions.  If I tried the same idea 9 months after I read about it, then it worked.

So whatever happens in the market over the next few years, I think Natural Gas enters a secular bull market and we are in at the bottom, this is why when I talked about the pullback this week, I said "It really doesn't matter over a few percent, just don't miss the opportunity."

As for the charts, not a lot has changed, but here's the basics...
 There are 4 stages to an asset's life cycle and they tend to repeat: Stage 1-Acumulation/Base; Stage 2- Mark-Up or the bull market trend; Stage 3-Distribution/Top and Stage 4-Decline. UNG came out of stage 4 and entered Stage 1, we are looking for stage 2 as that's where the easy money is. We have a large base with huge volume through it that should support a large move. I mentioned the last breakout we identified as a head fake or false breakout that failed and mentioned you might want to take profits (nearly 040% in many cases) and buy after a pullback. It's also my opinion that UNG needed a pullback to gather energy for a real breakout to stage 2 and that's what the yellow area is all about.


 We had a good day today, I think the new format of the EIA report for Nat. Gas inventories really helped UNG. We are right at gap resistance which tends to be the strongest resistance so a pullback is still on the tableAfter that we have the Stage 2 Breakout level and then it should be a trending trade.

 As for trending, my Trend Channel set to the smallest size for UNG's volatility, captured over 50% in this one move. If I widen the channel it captures over 90%.

The blue indicator at the bottom tells us where the close was within the weekly range, as you can see this is telling us something we might not have seen otherwise, the closes recently have been very bullish and growing, this tells us a lot about the character of UNG.

 This is the daily MoneyStream positive divergence.

I've already made the 3C case, but...

 A 4 hour chart goes from confirmation to a leading positive divergence in the base.

This is the last head fake breakout-not all head fakes are bas and not all declines are bad. We knew we could take profits there and enter at a better price, we could have essentially made another 20+%, but that's nothing compared to what I think UNG will do.

If you are interested in the trade and maybe need some ideas about how to play it, feel free to email me. This is a long term trade, more like an investment; you need a wide stop as we are still in a volatile base. I can help you figure out the risk and position sizing.

If we get the pullback, fantastic, if we don't, I look at it like this, "Am I going to give up on a potential 400+% trade over 4 or 5 %?"


FAZ Add to (Long)

We are getting some upside movement in to a leading negative divergence,


 I'm assuming this is op-ex pin action, but nonetheless, it makes for a better entry on the FAZ long position as far as price goes.

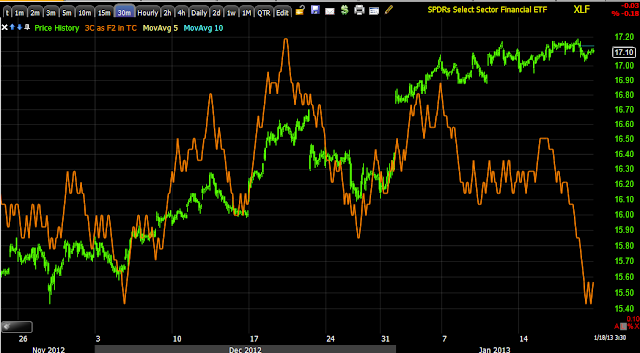
 XLF-Financial Sector 30 min (I didn't think I needed to draw annotations on the chart, the divergences see pretty obvious.

 XLF short term 1 min

 FAS (like XLF except 3x leveraged long) 15 min

 FAS 30 min

 FAS 2 min trend

And FAZ-3x leveraged short- 15 min.

For some reason I can't get the rest of the FAZ charts to upload.

Futures Market Update

Especially considering the VIX move, these charts are very informative and good news for our analysis.

Here are the SPX and NASDAQ E-mini Futures (ES and NQ respectively).

 ES 1 min-Not only are we seeing the second day of a very rare anamoly in the Futures / 3C charts that have only been seen a couple of times and have been very successful in calling both tops and bottoms, the "Persistent negative divergence", we also see a new low on a leading negative divergence at the intraday price move that occurred as an inverted or reverse correlation to the VIX drop. This not only makes me feel better about being long VXX and at this depressed level, it also makes me feel confident about our analysis and the timing of it and the bearish nature of underlying trade.


Recently the NASDAQ Futures have been stronger as the QQQ has been as well, I suspect because the average was the furthest away from the resistance zone all of the other averages broke above and needed more support in trying to accomplish that goal. Again we see a persistent negative divergence and a new leading negative divergence in to the VIX correlated move to the upside.


AAPL Charts

I consider this speculative for a lot of reasons, AAPL specific news, market position, the way ES is performing, that it might have been a day trade, but that looks less likely now, but in any case, I wouldn't feel comfortable with a full size position, but there's enough improvement that I feel it's worth a shot here.

 Earlier I speculated that the initial leading divergence may actually consolidate sideways and create a bigger base, this isn't the size base that I expect to support a move of any duration, this is why options and their leverage seem to be the best vehicle for the trade idea.

Note the distribution to bring prices back down to lower levels where they can be accumulated , was very minute, just enough to get an intraday turn downward.

 The 2 min chart showing the first hint of a divergence yesterday, this would suggest to me (since there's been no real run on that divergence, that the move should exceed the $507+ area). The leading positive today is even larger.


 Just like the IWM before it ran early this week as well as when we took the last AAPL call trade, there was a 5 min positive divergence that looked almost exactly like this, although this is a 3 min chart, the length is more important.


 And the 5 min chart is showing the improvement I was hoping to see, not as much yet, but moving the right direction.

And we even had a little action o the 10 min chart at the last play, just like this.

I also like a "Speculative" size AAPL Call-Feb. (monthly) $505

This is speculative and may in fact even be a day trade. Charts coming.

Volatility Tumbles

I'm not sure what exactly this is about, there's a chance it is about the Debt Ceiling debate as Boehner (Grand Poobah of the Republicans in the House and House Leader) kicked the can to Senate Democrats, saying if there was no budget, there's no talk on the Debt Ceiling. The House will propose a 3 month extension of the debt ceiling in exchange for spending cuts from the Senate according to Dow Newswire. The House is expected to pas the 3 month extension next week (although Boehner couldn't gather enough Republican votes to pass his plan B).

Honestly this seems to be more theatrical than anything, to dare to imagine a budget with spending cuts comes out of the Senate is to imagine a flying pony named Wilson.

Whether the VIX move down was in response to this is unclear, but if the debt ceiling is moved out further, than like last time, the VIX is sold as hedges are moved out further to try to cover and hedge exposure around the area of the debt ceiling fiasco/debate. I'm not sure traders actually are falling for this and thus taking that action, but we have seen it once before and that's how the market figured it doesn't need to ramp AAPL to ramp the market, it's easier to use the VIX.

If this was a ramp of the VIX to try to support the market or move it up to some op-ex pin, then that's another scenario, the other is that this is a capitulation move, massive shakeout which is something that would fit right in with a move higher in the VIX expected as it hits all kinds of stops, orders, and creates massive supply which of course is something Wall Street needs and judging by the momentum in the Financial 3C charts alone, I'd say we are at the point in which buying the VIX (derivatives) on this move probably sounds more reasonable than anything (as difficult as that may be to swallow).

The VIX ix now at new lows stretching back to June or July of 2007, this is EXTREME complacency and a hallmark of a market top, a big one.

Here are some of the charts, the initial move in 3C as volume swelled was one of positive divergences, of course that would be the point of creating supply.

The Euro (red) is not the lever today as you can see vs the SPY (green), it doesn't have the juice to "juice the market". I believe a Credit short squeeze was used as  mentioned last night and this looks like they are going back to old faithful (of recent), the VIX as the lever, but why? Is the selling in the market that strong that their pin is endangered? Is this hedges being rolled forward on a 3 month extension of the debt ceiling? In either case, it doesn't seem to matter judging by the looks of the charts, the probability of this political ploy actually going anywhere and the reaction of the market during the move up as the VIX moved down, it wasn't even confirmed.

 ES is in a new leading negative low on the ES move up as the VIX was money hammered down, look at volume too (although late Friday on a 3 day weekend is probably a big part of that.

 The SPY saw a negative divergence as well on the move.

 Oddly, the SPY (green) didn't move anywhere near the correlation you'd expect when comparing the intraday VXX (red). The correlation would suggest the SPY moves above yesterday's highs on a new VIX low, that comes back to the question of, "Just how weak is the market right here and now?"

 The daily chart of the SPY looks like it will end with a Dominant Price/Volume relationship today, this is something I thought we might see just before a reversal as I mentioned maybe 2 nights ago. I would guess the relationship would be "Close Down/Volume Up" which is the most bearish relationship among the 4. We don't need SPX volume to be higher, just the component stocks.

 The VXX reaction and it keeps moving positive.

 The weekly VIX at a new low stretching back to 2007, around the area of the last MAJOR market top that wiped out 5 years of gains in about 16 months.


And the volume of the VXX as it breaks below support, this is one of the reasons for head fake moves, the supply is created that large positions need to buy at good prices and not drive price against them.

My first instinct after looking at these charts was, "Buy volatility", like Warren says, "When there's blood in the streets..."

Filling out VXX Position

Te VIX/VXX/UVXY just took a massive plunge, I'll cover it in the next post, but I like this opportunity to fill out the rest of the VXX long position.

Financials Update/Trade XLF, SKF, FAZ

Seeing accumulation or distribution is not hard, hat's more difficult is knowing when you are so far along in the process that your probabilities are so high that if you wait much longer the move starts and your positioning is worse, your risk is higher, etc.

Looking at the big picture, it's hard to say that a few days of the market turning would be a deal breaker for a position as there's so much potential.

In any case, Financials are now at the point in which I find the signal very hard to ignore much longer. There's patience which is absolutely essential and then there's the fine line of timing. Luckily the charts tend to tell us when things are going from distribution to something much worse and with Financials, we look like we are at that point. Intraday or within a small period there's probably a slightly better entry, but I don't think waiting much longer is going to be beneficial.

Here are Financials as a broad sector (I prefer to start most positioning with a broad ETF and go with sector momentum and at the first correction, have an idea of what specific stock I might want to replace the ETF with). If you don't want leverage you can short XLF, for 2x leverage you can buy SKF and for 3x leverage you can buy FAZ (the last two you buy, but thy are bear or short ETFs). The reason I prefer to move to an actual stock at some point is there are advantages to being short rather than being long an inverse ETF.

Here's the update of XLF (Financials) which I consider a short, FAS (3x long financials) and FAZ (3x short financials) which would be a long position and probably my choice as an add to position. I use all 3 as confirmation of each other.

 XLF (Financials) 1 min trend. This entire area is "Trend #1", the idea of trend #1 with respect to trend #2 for our purposes is to act as a segue or a transition to trend #2; it's along the lines of the head fake concept or the bull trap. There are a number of reasons why; I keep saying it, but I will get the first 2 of the 3 part article, "Understanding the Head-Fake Move" linked on the site.

The expectation for trend #1 was mostly distribution, maybe a little initial confirmation to run prices up (we really couldn't say how long trend #1 would last, only that it would be shorter in duration than trend #2). This most recent divergence in the red box is not only leading negative at a breakout area, the  change in character of the 3C momentum is really astonishing-especially as we see the rest of the charts.

 XLF 3 min shows the actual accumulation for trend #1, essentially smart money buying a long position, not nearly as big as you might think, but necessary to provide the support and spark to get trend 1 moving up, they also make money obviously, but they don't want a position so large that they can't quickly get out of it and find themselves stuck like many did and still are in AAPL. This is a new leading negative divergence, essentially there's less money long here than there was at the lows on the chart at much lower prices, this is through not only distribution, but short selling as well.

 XLF 30 min, this is interesting because before trend #1, most of the negative divergences were around the 15 min area, which is substantial, but not like the 30 min charts, these are a much bigger deal. The trend on a chart this long becomes much more clear at the expense of some detail, but when a 30 min chart falls as fast as this one did the last 2.5 days, there's a major move in underlying trade.

FAS-3x long Financials -essentially the same as XLF, just with 3x leverage on a daily basis, this is not  meant to mimic the 3x leverage over a period greater than 1 day -this can be troublesome in certain markets like rangebound or very volatile chop. This is one reason that I prefer to switch to an outright equity short at some point for longer trends that may have longer consolidation periods.


 FAS 2 min chart from the start of trend 1 to present, also seeing a sharper momentum move in 3C at recent highs.

 FAS 10 min. including the 11/16 cycle and trend #1, note the confirmation until trend #1, also note the recent downside momentum in 3C.

 FAS 15 min, an important timeframe, here you can get a feel for how large the accumulation period was vs. the distribution period, also the recent 3C downside momentum change. For me, this is nearly an impossible signal to ignore.

 FAS 30 min, much longer, stronger. Accumulation at the 11/16 cycle lows, confirmation through most of that cycle (note that faster timeframes will show some distribution, it just isn't strong enough to show up on a chart this long/strong). Look at the recent 3C negative leading divergence, that is VERY fast for a 30 min chart.

FAZ 3x leveraged Short Financials-Remember if you want to use this to go short financials, you buy it long and it gives you short exposure, don't short FAZ unless you effectively want to be long 3x leveraged financials. Some brokers won't even allow it with a pair ETF like FAS.

 This should show roughly the opposite signals compared to XLF and FAS above, on a 5 min chart we have a strong leading positive divergence recently.

 15 min FAZ with the negative divergence at 11/16 and a strong leading positive divergence with exceptional momentum the last several days.


This is FAS, it might as well be XLF as far as the LR Channel is concerned, this is why I say there's probably a bit more upside, but at this point it's getting myopic. I'd like to wait for the perfect entry, but in my particular situation that's my last priority, the first being to members so I'll likely fill out the FAZ long at some point today. Don't forget we have a holiday Monday in the U.S. markets for Martin Luther King Day.

AAPL intraday charts

 1 min-that's improvement, but is it enough to move the 3 and 5 min chart? Some of you may feel comfortable taking this as "enough" for an intraday trade in options, for me I may think the probabilities are higher than 50/50, but I have a higher standard and would rather miss the trade than not meet that standard.


 2 min is flying, can it make it to the next chart?


3 min, not yet.

Another possibility is that AAPL consolidates laterally a bit more and that may be where the 3-5 min divergences develop, that would be a better situation, but requires you choose before you know for sure.

AAPL's improvement

Intraday AAPL's 1 and 2 min chart just saw huge improvement, if you are nimble and have the stomach for it, AApL as a day trade (long) here is looking better. Still not there for me on the 5 min chart, but the 1 and 2 min are flying.I'll post them next.

QQQ / TECH / AAPL Indications & More...

Just thinking about AAPL and options expiration, $500 HAS to be a psychological level of some importance. There are calculators on the web, although I haven't checked one, that will give you their best estimate of the pin, but you want the ones based on actual prices, not open interest because open interest i not always indicative of where the maximum money actually is. If anyone has time to find one of these calculators and check AAPL, please send me an email, if I have time I'll post it, but I'd think $500 figures in the equation.

As for the NASDAQ, Futures and Tech, thy look mildly and increasingly supportive intraday.
 Both ES and NQ have intraday positive divergences, they are small and intraday, but maybe enough for the trade mentioned. I think the probabilities have gone up, for me that's not enough with options, they have to look stellar.

 QQQ 1 min at yesterday's highs and right now...

 QQQ 3 min,bigger picture is negative clearly, intraday is slightly positive. Since the divergence is past 1 min, it is more likely an upside correction than a consolidation.

 The other side of the coin is the 5 min chart exerting a strong downward gravitational pull, that doesn't mean we won't see intraday corrections, but this is just some bigger picture information for everyone.


 Tech looks similar to the Q's of course on the 1 min

 Look at the accumulation in Tech on the 15th, this apparently was an effort to try to help the Q's cross their resistance area like the other major averages did, since the highs yesterday, not so good and not much here right now.

The same thing is seen earlier in the week for Tech and the same 5 min chart is exerting a lot of downside pressure as far as the bigger picture goes.

All of the other average are also supportive of an intraday move up, especially the DIA, but very short term.

AAPL might present another options trade

Yesterday AAPL tried to get it together around noon and onward as you may have seen the post in which I mentioned considering AAPL as a day trade with a trailing stop.

If AAPL can make a few more improvements, I'd consider it for another short term call trade.

Here's what we have and what I'd like to see to consider the short term options trade. What may be most telling is the near term action on the recent news yesterday and this morning. The news wasn't good, but remember it isn't the news, it's the reaction to the news and even if these moves or attempted moves are just short term set ups to dump AAPL at higher prices (which we don't know yet), they can still be traded as long as they have high enough probabilities.


 AAPL 1 min today is trying to get something together right now, I'll probably keep a close eye on this chart as it means a lot to the following charts.

 The 2 min chart showing the improvement I talked about yesterday and from that post AAPL gained 5 points, ok, not a lot, but a 1% move in a few hours. The leading positive divergence today would be helped greatly by the 1 min chart strengthening, but this isn't really where the decision needs to be made.

 The 3 min chart also improved around the same time yesterday and is in a relative positive divergence now, if this chart can start to lead positive then probabilities look better.

The same with the 5 min chart which is also relative positive (it's a weaker divergence, but often how they start), so if the 3 and 5 min can start to lead, I'd consider a long trade in options, even if its a day trade.