Monday, December 13, 2010

Blown Opportunity

Today the market had a lot of advantages, Asia did well, China did not raise rates, the Euro snapped back from its gap and went parabolic sending the dollar lower, the averages gapped up, there was no bad economic news out, POMO operations came in at an excellent rate leaving primary dealers with cash to burn in equities, but despite all of this, the market does nothing. This is starting to smell like a shift in sentiment, certainly a shift in sector rotation as the theme most of the day was the shift in financials as it continued to unfold today.

Today t
he NASDAQ breaks 8 straight days of gains and closes down -.36%, the S&P went no where, and the Dow eeked out .16% with a shooting star candlestick. The NASDAQ put in a reversal candle called “dark cloud cover”. All in all, the market had every advantage and gave them all up.
 QQQQ 10 min-serious damage done today.


QQQQ wedge, with a dark cloud cover reversal candle.
As I talked about a lot today, financials are not looking good, they've rallied and smart money looks as if it has taken their gains and are now done playing the sector.
This negative divergence now seems to be shifting down, this of course puts pressure on the S&P-500 which is financial heavy.
This is the SPY 15 min chart, all of the 3C damage in the red box was done today alone!

The NASDAQ also saw some pretty bad losses across the tech and a few other sectors.
Semis clearly coming under heavy selling pressure.

ADBE down -3.13%, this is one of our featured short positions as the test of the flag-or the Kiss the Channel goodbye have sent it lower, it should see a new low.
INTC 60-min showing nearly a month of distribution, down nearly 2% today.
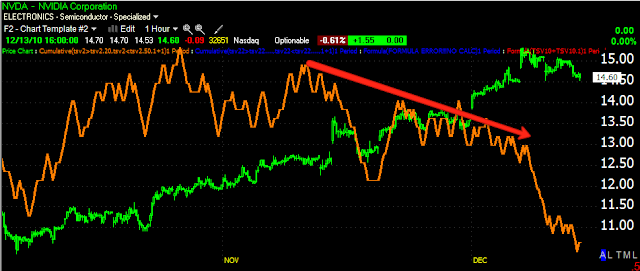
NVDA 60 min also looking ready to turn down-down over 2.5% today
EXPE showed quite a loss today, there are other stocks I'll highlight tomorrow in tourism/travel/hospitality that look to be under pressure, including casinos.

Dell was also down -3.82% , not helping the NAS 100 today.
My computer will e working overtime tonight as I have set up some scans to look for sector rotation, but by the amount of different industries I saw break out Friday and give it back today, I think there's a serious shift of sentiment going on, that or smart money is done playing in the long sandbox.

Keep an eye on the trade list tomorrow as new ideas will be up as a result of tonight's scans. That is if my computer doesn't freeze up-that's right it's 30 degrees here in S. Florida. I can't remember the last time it was so cold, I know, all of you up north are really feeling for me.

The Dollar or the Banks?

Earlier today I suggested that with little news/macro-econmic data out today, the dollar or EUR/USD trade is likely to influence much of the action.

However, from last week's sector rotation into Financials, which supported the financial heavy S&P-500, was certainly showing signs of distribution as the accumulated shares (for the bounce) are distributed into higher prices. That distribution accelerated today, leaving the XLF which was seeing gains last week of +.83% to + 1.65 (and the week before, one day  gains of +2.5%) finishing the day at 0%, that from an earlier gap higher.

Here's the comparison of the EUR/USD vs S&P and Financials vs S&P

 Above, the SPY is in red, the FXE-Euro is in green. The action in the SPY was similar earlier on in the day, but it diverged badly at the end of the day as financials started falling apart.

Here the SPY is in red and the XLF is in green, again note the FX/Currency market controlled the early session until the XLF went into heavy distribution. Ultimately, the Financials were responsible for today's loss of upside.

The S&P- +.01 %

Dow-30 +.17%

NASDAQ-100 -.35%

Update

 Amazing leading negative divergence in the Q's 10 min!

SPY 15 min leading negative divergence

A Look at Some of the Market Sweethearts


AMZN started strong price wise, but a 3C negative divergence showed sellers into the early gains, down now about 1%

 AAPL 5 min, broke support on a 5 mi negative divergence

 AAPL taking out intraday support and giving back a majority f its gains today

 NFLX-lost over 10 points-down -5.62%-see comments about shorting NFLX (I'll link them tonight)

PCLN had a nice opening gap, that's turned into a 1.7% loss

BAC- Canary in the Coal Mine

BAC is indicative of the distribution in financials I talked about last week. BAC started today with a gap up and a gain, it's now down nearly 1.7%

5 min negative divergence.

Financials Update

Today is the day I've been wtching financials as they have been showing distribution into the uptrend, now it looks like that phase may be over and the decline phase starting.


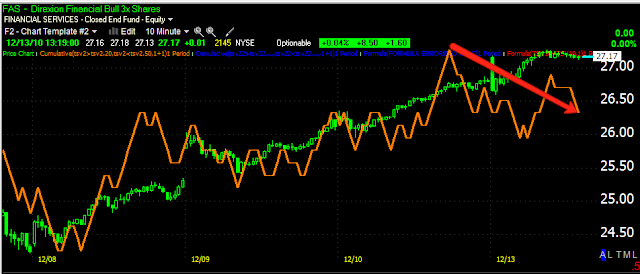
 FAS looses 1.2%- 2/3 of it's gain in about an hour (FAS-ETF long financials)

 FAZ gained even more in the same time period, nice 5 min leading positive divergence.

XLF 5 min looking bad, XLF has taken out the first support level.

Make it 12 for 12

Here's BAC

 BAC 5-negative

 BAC 10 negative

BAC 15 negative

The divergences/distribution are there, a downward reversal should pressure the S&P

The Continued Unwinding of the Financials

Financials are under continued pressure-remember last week they were basically holding the market up as they performed very well. I said then it would take several days to unload the accumulated position. So I compared 3 charts all related to financials to see if there was confirmation among them, below is XLF, FAS (long leveraged financials) and FAZ (short leveraged financials). The charts are remarkably similar.

 FAS 5 min -long financials -very negative

 FAS 10 min -negative

 FAS 15 negative

 FAZ-since FAZ is the inverse of FAS above (it is short financials) I'd expect to see accumulation to confirm what is being seen in FAS and XLF-Positive 5 min

 FAZ positive 10 min

 FAZ positive 15 min

 XLF is financials itself with no leverage, for the above charts to be confirmed, it should look the opposite of FAZ (it should be negative) and similar to FAS. 1 min negative

 5 min very negative in XLF

XLF 10-min negative

XLF 15 min negative.

So we have 3 independent equities, on 3 different timeframes all showing the same thing, the financials that have been strong are in negative divergences while the (Short financials) FAZ is positive. Confirmation wise, that's a solid 9 for 9.

USO Showing Its Colors

Recently we've had to depend on short term charts to try to discover USO/Oil's intentions, the reason being is the longer harts had been in confirmation with the price move and didn't tell us much. Now those short term charts have filtered through to the longer term charts and we have a better picture of USO.

USO 5 day now showing resistance from the gap on May 5th-the latest negative divergence shows resistance at that gap.

The amount of green arrows on this daily chart made it difficult to gain any insight into the longer term outlook for USO, but now as it is at the resistance level, you ca clearly see negative divergences.

This weekly chart shows the resistance level at a strong gap formed May 5th-gaps tend to be some of the best support/resistance.

The 1 min chart showing a negative divergence on this morning's gap up. Right now there's a small positive divergence, most likely an intraday bounce.

 The 10 min chart is what we had to rely on for weeks, negative divergences are clear at resistance and today's gap up.

 The 30 min chart went from the green arrow (confirmation-which didn't tell us much) to a negative divergence at resistance and this a.m.'s open.

 The 60 min chart also demonstrates the confirmation recently making it difficult to see what the longer term underlying action was, now we see the negative divergences.

It looks like we should see downward pressure on USO over at least the next week or so, with the normal bounce here and there.

SRS Pullback Opportunity

Last week I listed a lot of major stocks that are bucking the overall market trend and heading down as the breadth readings have suggested, several of those stocks were real estate stocks. SRS is a leveraged short on real estate.

 SRS 1 min-the pullback appears to be under accumulation-1 min

 SRS 5 min

The daily chart showing a bullish wedge that has broken out and a small pullback that offers a good Risk:Reward ratio in this area.

SRS continues to be one of my favorite ETFs for an implied measured move of approximately $32.

Euro May Get Volatile

Earlier this morning I posted a chart of the EUR/USD in which the Euro saw a parabolic move up, those kids of moves are not my favorite if I'm bullish the Euro, they often end with a parabolic move down.

There are signs in the FXE that an at least short term (maybe more) topping process may have begun as the Euro loses it's momentum and starts to round.

 FXE-Euro Trust ETF 1 min chart in a leading negative divergence

FXE 5 min -another bad divergence
 UUP-early signs of a positive divergence

 Note UUP found support and 3C didn't follow price down, considered a positive divergence also

 UUP 15 min looking quite positive.

And support for UUP on heavy volume today. Note the big red volume spikes in UUP, each one was at an upside reversal point, we are o track for quite heavy volume today.

On a light economic news day, the FX markets are likely to influence the equities market more then usual.