Thursday, March 7, 2013

What's Up with the Failure of Dow theory Today?

Dow Theory is or was great when it really mattered, Charles Dow came up with the ideas behind Dow Theory when he was running the Wall Street Journal in the early 1900's, it wasn't until after his death that Dow Theory was actually born, but back then it made a lot of sense; the Dow Industrials were true industrials like the US no longer has and the transports were the railroads that delivered all of this stuff, if one diverged from the other, it was significant, after all, the Industrials can't be in good shape if there's a fall in shipping traffic right?

Well we are a services oriented economy now, IBM is one of the Dow Industrial's largest components, I'd say their closer to services than a production line and transports, they may be more reflective of EBAY or Amazon stocks now than IBM, however dumb money reads the theory in a book and they trust it.

 Remember this low volatility, slow melt-p with no pullbacks when investor sentiment was at record levels? It was a perfect time for dumb money to enter and enter they did, I just wonder?

Why all of the sudden did transports just break away with the industrials? There's a -1.42% differential between the two over the last two days alone after having moved together tick for tick all year.

FX

I'm not sure if I'm going to try to cover the FX markets, what happened today, why it likely happened and what it means.

As you know the BOJ announced their policy statement last night, the outgoing governors, despite pressure by the Prime Minister, rejected immediate, ope ended asset purchases. The new incoming BOJ governors are expected to be a sort of extreme departure from the current/outgoing ones and they are in lockstep with PM Abe.

In fact Dallas F_E_D president, Fisher actually voiced concern that Abe is "Politicizing" the Bank of Japan and adding to his comments on Abe, "He is aggressive".  I think it's pretty telling when a regional F_E_D president comment on or rather criticizes another central bank and he's far from the only one.

At least one current member who will be staying on board made her loyalties clear, she'll stand with Abe's choice of new leadership, but she is only 1 of the 9 member policy board. The conventional wisdom seems to be the other members may not be so keen on abandoning the current path for a much more extreme policy stance, obviously led by the PM.

I don't know what will happen longer term, but the Yen figures prominently as a Carry trade pair which is important as many hedge funds and Institutional investors not only take advantage of the carry trade, but use it to finance their equity operations, small moves in the FX market at the leverage some of these professionals are using can lead to catastrophic results so I think it's fair to say there's some uncertainty as to what the BOJ will actually do, there's little doubt of what the new crop of leaders want, but can they get it?

In any case, we have more FX traders than I was aware of. Yo may recall yesterday I felt very strongly that there is at least a temporary floor in for the EUR/USD at $1.30 and yesterday that was broken to the downside, which essentially means I'd take the pair long, well one of our member's wrote to me this afternoon,

"Hey Brandt,
 
What you're posting is helping. Taking advantage of the euro trade from yesterday allows me to take those profits and flip it into today's position. And when dealing with leverage, the security of 'free money' is a big bonus.
 
Just wanted to give some positive feedback before I forget."

After asking a bit more about what he's doing and his permission to repost the exchange, he offered up some more thoughts (I've always liked the FX market, I feel it trends better than commodities or equities, but as he admits and as I commonly say, "There's a right tool for every job")...

" In fact, it works great when an option trade isn't appropriate. Different tools for different scenarios. I went long aud/jpy yesterday when you brought up those positive 1 min charts. I got a few more pips on that one than I expected(when i woke up this morning). You can definitely enter some short term trades with the tight correlations. 1 SPY weekly call would not have netted as much as the aud/jpy.
 
TOS has those mini pairs in the commission fx pairs(you pay for a tighter spread). So they don't even have to enter full positions if they don't feel comfortable yet."  

While I mostly use FX analysis for broader market analysis, as you can see, one of our members made two profitable trades in less than a day on just very basic information posted. I'm not trying to push anyone toward FX trading if they are not comfortable with it, but as we both agree, the more tools you have at your disposal, the better your chances are of having the right tool for the trade.

In any case, here's my take on FX as of now. It seems to me that the Yen has already discounted Abe's policies and BOJ picks, now it's a matter of whether all of them get through and then whether they can get the votes to push through what most would call a radical agenda. The G-7/20 pretty much stopped short of calling Japan out on the carpet for currency destruction because most of the member countries are doing the same thing, they just don't have the same amount of dilution yet. The fact a sitting F_E_D regional president called the policies extreme shows that no one really wants to go toe to toe with Japan when it comes to a currency war, the problem is, many will be forced to.

In my mind the real wild card is China who has already started draining money out of their system, they know hot money is flowing in to China as a result of the currency wars which will only get worse, China will pay for it so don't be surprised to see China take drastic measures to curb inflation which is now hitting their housing market.

I see the Yen as a trading short for now and maybe something like AUD/JPY short, but only in small trades. I'd expect the Yen to move lower on confirmation of Abe's picks, maybe move higher if all 3 are not confirmed. However I think to a large degree, the Yen has discounted a lot of what Japan wants to do. I wouldn't want to be short the Yen near any kind of policy or decision moments.

The EUR/USD seems like it will head a bit lower from here, to me it's not worth the trade as the $1.30 level seems to have a floor in, any moves below $1.30 and I'd be looking at the data and looking at  long EUr/USD lie our member above pulled off yesterday for a big gain.

Currencies are connected to our markets and assets in many more ways than most would imagine, I think this is a time for some wild volatility in currencies as the devaluation wars heat up which will lead to trade wars and China will not allow inflation as a result of worldwide currency devaluation, what they will do and how far they will go remains to be seen, but I personally can't imagine the limit at which they would back off to keep hot money from entering and inflating their economy.


Max Pain

This was a choppy, frustrating day if there ever has been one recently.

Earlier I mentioned weekly op-ex and I had not looked up the max-pain or the op-ex pin yet, this of course can change as tomorrow is another day and we only have the data we have now, but if this is close to correct, than we should expect a move lower tomorrow. It seems to me op-ex Friday's see an early move toward the pin and then are a bit more free to move during the last hour of the day.

Here's the max-pain or op-ex pin for tomorrow's weekly QQQ, SPY and IWM expiration, should we get a gap down, I'd be looking to get as much of that momentum as possible and as soon as it starts fading, get out, I can see it happening and being worth some money as the QQQ weekly $69 puts were worth over 20% at several points today.

 IWM weekly max pain $91

 QQQ weekly max pain $68

SPY weekly max pain $153

All of the above at max pain have enough ground to cover that the momentum would almost certainly make the puts worthwhile.

I'm going to cover another topic and update.

AMD for momentum traders

I think a close below $2.52 and I wouldn't let it get below that before the close, is probably about where AMD will end up stopping out very short term, as I said, I prefer to hold it longer term and I showed you why, but for momentum traders, here's the 15 min stop which is as wide as I'd go on an intraday move like this.

Quick Futures/Market Update

It looks like both ES and NQ should be making a leg down in to the close

 ES intraday

NQ intraday

AUD/JPY-Trade

For our FX traders and general analysis as the movement in both currencies is bearish for stocks, the AUD/JPY looks like it's going to fall.

As mentioned earlier, the Yen looked like an upside reversal was building, it has only gotten stronger since. It would seem there not a lot of risk in shorting the Yen here, I don't know how long the trade will last, but it looks like it's worth a short.
 The AUD/JPY is already starting to roll a bit, but that's not why...

 Here's the yen 2 min

 3 min

And now the 5 min is moving.


Short Term GOOG Update

It looks like intraday GOOG is going to see some upside, I don't know if it's enough to add to the April Put position, but I'll keep an eye on it.

Quick Market Update

Everything has been very choppy, even the TICK, it looks like the market is going to try and make another leg lower shortly (before the close).

I've been thinking about the weekly option expiration pins we have been seeing and if memory serves me correct, we usually see a move toward the pin on Thursday and then a deeper move to the pin on Friday, so this is just me writing out loud, but a move down today would seem to imply a lower pin tomorrow. It would also seem to make sense to me from a sentiment perspective, although I haven't run any max pain calculations yet.

EUR/USD Update

I mentioned it earlier, although more focus has been on the Yen, it looks like the EUR/USD is going to come down shortly, I don't know what that will mean for the Euro as $1.30 seems to be a floor, but I know what it would mean for the $USD and risk assets.

 5 min chart of the pair, not much movement today at all.

Here in the futures it has gone negative in the short term.

GOOG April $810 Puts

This is a position that I have wanted to fill out, but I definitely don't want to add to a put on this downside momentum so I'll let what's already in place stay and look for a better area to possibly add to that one. As for an equity short, it's a little different, i still would not chase it, but there's much less harm in opening or filling out an equity short, however i do think it will have to be a fairly actively managed position for a while.

 I think there are two head fake levels here, one right around $775 which is the bigger and one around $808 which is the smaller, breaking of the $775 will have a lot more impact on price, the concept, "From failed moves come fast/deep moves". We even have a small intraday head fake.

 This is not at all the kind of momentum I want to but a put during, but it's important to line up the market and the stock (as well as the sector) to get the best entry, highest probability and lowest risk.

 Here are the levels in white, the 15 min chart is leading negative at the lower trendline, this is where I think GOOG can really see some fast downside momentum, below the $775 area so we may have some time before we hit that to add or create a new position.

The 5 min chart shows an intraday head fake move, you can check the charts, it's distribution, but retail chases it as a new breakout.

GLD Update

As long as GLD keeps forming that smiling bottom, I'm happy. It looks like today the lows were accumulated and it should add to the "smiling bottom"

 GLD 1 min leading positive

GLD 3 min intraday leading positive

Yen Update

This is mostly for our currency traders, but it is also a piece of information for market analysis, the weak yen has been very helpful to the market moving up, it seems as if my earlier initial impression of a reversal in the Yen to the upside is gaining credibility, this is not of any assistance to the stock market bulls.

 Initially the early smaller divergence was seen in the Yen futures, it has grown since then.

 Now it's clear in the Yen ETF, FXY as a leading positive divergence on the intraday timefrmes and moving out- 2 min

 3 min

The next to take on is the 5 min.

I'll try to follow this up in more detail for the FX traders and for market analysis.

I was considering adding to the IWM put

However I have so many open positions in options, I want to let some of these settle first and concentrate a little more on the bigger picture.


What I'm watching in the IWM

I mentioned earlier that I was watching the IWM closely, here's what I'm watching and so far it's moving in the right direction.

Today's trade is obviously very choppy, but the iWM made that high above local resistance that I was talking about yesterday during the day and in the nightly wrap, if it were another average it might not be as important, but the IWM should always be the leader of a risk on move.


When there are a series of shorter term, even intraday divergences and they disappear, it doesn't mean they didn't have an effect, it's accrual. It would be like you making a series of small deposits in a savings account, although each is nothing big, the series of them accrues in to a larger sum, it is often the same with distribution and accumulation because of the size of their orders, they often break them up in to smaller orders and if there's a trend among the small divergences it can show up on the longer term charts just as your bank account's balance would show a large amount despite the small deposit you were making that day.

So we'll start from the long charts, the balance or accrual area for the IWM and work toward the middle timeframes.

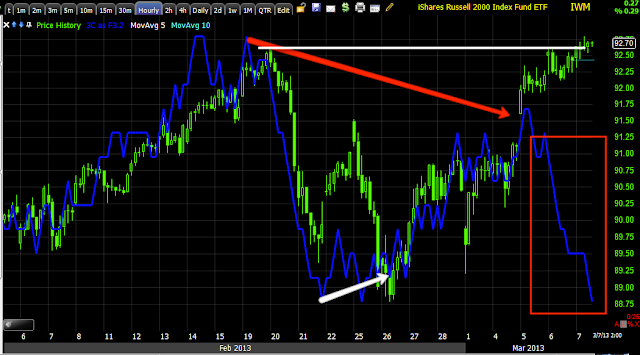
 This is the 60 min chart, one of the most important, highest probabilities and cleanest underlying trend, also one of the strongest signals and here we show accrual of divergences, especially recently as the 60 min is leading negative off only a very small positive divergence to send it higher, not enough to be an accumulation zone for a big upside move.

 We have the same on the 30 min chart, it shows more detail and both tops negative, but like the 60 min, this most recent move to the upside is leading negative much deeper.

 The 15 min chart under less extreme market scenarios is the swing chart where many turns occur, four our purposes though we are just looking for a leading negative divergence which helps confirm the above charts.

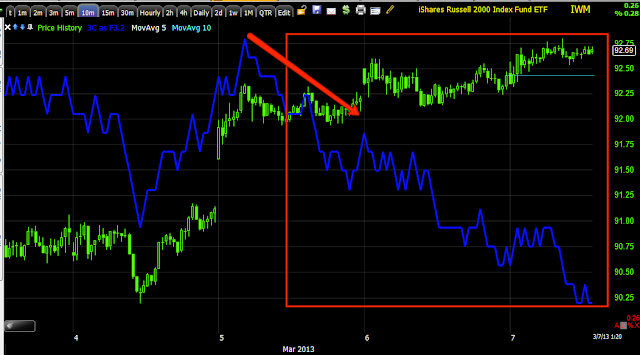
 The 10 min is shorter and therefore more detail and sharper, it too is leading negative. Now we will start from the fastest charts and work toward meeting the 10 min chart. This is what I have been watching.


 The intraday 2 min chart went negative at the highs of today and then leading negative, i want to see this divergence migrate to the next longest timeframe.

 On the 3 min chart we have the same, as the IWM hits the intraday highs, distribution sets in and it is leading negative, now only the 5 min charts stands between connecting the intraday divergences and the long term divergneces.

 And the migration of the neg. divergence is now on the 5 min chart, leading negative. The worse it gets the better.

As for our intraday momentum, it's starting to look "not so good too"


Yen

It is too early to get spend too much time on the Yen at this moment, but suffice it to say, I see a few things that suggest the Yen made a parabolic move this a.m. and it may be ready to reverse, this would also hold a lot of importance for the market as well. I see a hiccup in the AUD/JPY, EUR/JPY and USD/JPY while the AUD/JPY is a little different, there's not much movement in the $USD or EUR on their own, so the Yen looks to be the potential mover in the pairs, that would be Yen strengthening.


For now I'll only post this chart of the intraday YEN futures as to not spend too much time writing when I should be watching.

There are also signs of Euro weakness and improving $USD strength, these all would pressure the market.


Watching the IWM Closely

It's negative in the short term charts, yet has accomplished what I talked about last night as the continuation of yesterday's plan, the short term charts going negative after it has run through the range is significant, it's at a pivotal moment. I'll keep you up to date if this migrates more.

MCP Follow Up Charts

As you know, the Trend Channel moves up with prices to lock in gains so it's not a static stop, if you aren't using the Trend Channel, a 22 bar exponential moving average works fairly close to the trend channel stop for MCP, it's more accurate from 5 to 30 mins, it starts to lag a little at 60 min, but not that much, so that's another option.

 3 min chart is losing a little momentum, it's not really what I'd call negative, just profit taking after a +12% run the last 2 days.

 The 5 min chart is similar.

 At 10 min we are more in line and this would make sense, this is why I view any downside as likely a consolidation, it just depends on how active you are as a trader and what makes sense to you, your schedule, account and position size, etc.

 The 15 min chart looks great here, leading positive.

 As does the 30 min chart.

 The 4 hour chart shows what I think is ultimately the MCP base, a larger "W" base so I think there's good probabilities for higher prices, going by this chart they would be much higher, something around $18 according to the price pattern measuring implications.

 I also like the 50-bar 5 min m.a. for an intraday stop if you are looking to trade around momentum and consolidations.

As for the intraday momentum, we seem to be losing it, 5 min RsI is slightly negative, MACD is as well, but the 50-bar 5 min Stochastics is still embedded.

This is more of a personal preference choice, take profit and try to re-enter at lower prices or just hold, for me I'd rather just hold at this stage until the trend is more developed and likely to see a larger correction that may make more sense (to me) to try to trade around.

MCP Update

MCP has a nice move in it today, as far a a tight intraday stop, the 5 min trend channel would be around $2.40.

There are some nice looking charts that suggest MCP has more in the gas tank, but for today, I think it may be getting pretty close to losing some momentum, depending on whether you want to trade around it or not. I'll follow this post up with a broader update.

This is the 5 min stop.

The others are:
1o min $6.35
15 min $6.30
30 min $6.20
60 min $6.07.

I'll post the 3C charts next. I will probably look at this as more of a longer term position and not trade around it to much, but I do think that can be accomplished, depending on where your P/L and risk are according to your own tolerances.

Stabli-ateee and Italeeee

So far the only thing that seems to have moved the Euro during Draghi's press conference that is wrapping up has been the subject of Italian elections as a referendum regarding austerity measures and being ruled by a Goldmanite. The direction Italy takes obviously has a large effect on what Draghi feels is most important, "Governmental Structural Reforms" which could look very different in Italy with the recent elections, depending on what kind of government come out of all of this.

 The larger picture since the press conference...


The Euro since Italy came up.

There are many other interesting notes, I don't think they are essential to cover right now.

The market is moving or has a lack of movement which is very much in line with the movement in the Euro while the press conference continues.

Fragmentation of the Euro-area market has also been a touchy point, at least as far as the movement of the Euro goes during the press conference.

More to come...

Sorry, I can't help but chuckle after all that has been made of Draghi's favorite word, Price "Sta-bill-ateeee"


Market is transfixed on Draghi

Very little movement as the comments are taken in

Listening to Draghi now-Watching the Euro

The Euro and not so invisible hand

I know we have a couple of FX traders here, yesterday I was harping on my view that the Euro would not be allowed to stay sub< $1.30, sure enough if you too that trade and went long EUR/USD or another EUR long pair, you should be pretty happy this morning as it just crossed $1.31

 This was the Euro under $1.30 yesterday, something I did not think the Germans would allow to stand, although the French were probably pretty excited and hopeful it would stay below $1.30, but in the EU the Germans get their way first and on that note, a pretty much parabolic spike in the Euro.

 Here's the Euro(FXE) vs the SPX... Not much difference so far as far as the market is concerned when it would normally send the market surging with the $USD gapping down as much as it did.

However don't forget the bigger picture, the Euro is still massively dislocated from the normal correlation with the SPX, so maybe it's not so exciting to the market. From my rough estimates the Euro would have to be over $1.36 to even be back near the correlation.

Anyone go long the Euro yesterday?

Overnight

It looks like we are getting that move in futures that was starting yesterday, which I thought would be done by yesterday, unfortunately it got a slow start.

French unemployment hit 11 year highs at 10.6% on the 6th rise in a row.

German factory orders were down -1.9% on an expected rise of +.6%.

The ECB left rate unchanged today.

Initial Claims came in better than expected at 340k from  revised 344k (previous 344k)-that would be seasonally adjusted, non-seasonally adjusted rose at the fastest rate of 2013.

Productivity dropped at the fastest rate since 2008 with unit labor cost rising t the fastest rate in 11 months... hmm.

Seasonally adjusted, that's all I'll say.

The January Trade Deficit shows us December was a fluke, the deficit spiked back to $44.4 billion - it recent long-term average - as exports were $2.2 billion less than December exports of $186.6 billion while January imports were $4.1 billion more than December imports of $224.8 billion.

The EUR/USD just recently popped back above the $1.30 level as suspected.

Futures don't look like anything interesting...yet, that should change soon...

 ES

NQ