Friday, January 27, 2012

Long/Short Term

This took longer to capture then I hoped, so no notes below, but the timeframes are in the upper left corner, they are 1 min and 30/60


SPX 5 day chart with a doji star

 DIA

 DIA

 IWM

 IWM

 QQQ

 QQQ

 SPY

 SPY

 XLE

 XLE

 XLF

 XLF

 XLK

XLK

RIMM Update

RIMM is one of the stocks we have seen something bullish developing in since before earning, I put out a long Call trade on the positive signal which I assumed was earnings related, they took about a -9% hit on earnings but the strong positive signal stayed in place, so the position was left open and closed last week at somewhere around a 30% gain.

Then they had their management shakeup this week, which apparently was not enough of a shakeup and a signal was sent to RIMM by the way of lower prices, however, the charts suggest that there's still some belief in RIMM as they introduce their new OS this year.
 The X-over system's long signal and RIMM's pullback.

 On a swing basis, the pivot low was put in at the white arrow, the long signal was on a break above Wednesday's highs at the green arrow.

 Several short term charts show accumulation of RIMM's pullback as seen above

 As well as this 5 min chart which show the original accumulation as well as confirmation of the uptrend in green.

The 15 min chart put in a sharp leading positive divergence yesterday of all days.

On a swing basis, I'd consider Wednesday's lows(just below) as a stop. On a position trade, the Trend Channel right now is in the same area, but it will keep locking in gains, email me for updated stops.

RVBD an example of long term distribution

With distribution length and depth, it's akin to, "The bigger it is, the harder they fall". Furthermore RVBD beat on earnings yesterday, should be up right? No, the market is about perceptions and today the US decoupling perception was shattered with the release of Q4 GDP. In RVBD's case, guidance didn't quite meet consensus despite both a top and bottom line beat. I post these charts as an example because it has many things in common with the broad market.


 The long term 4 stage cycle in RVBD 1) accumulation 2) mark up 3) distribution/top 4) decline

 Since the start of the new year RVBD has racked up an impressive 27% return through yesterday as it also made a new local recovery closing high yesterday.

 The short term 3C chart, unlike what we have seen in several stocks like UNG , URRE and several others, did not confirm, this would mean there was distribution at the new high and since traders like buying new highs, it's easy for Wall Street to sell short in to demand without raising any suspicion as someone has to take the other side of the trade.

 Here's RVBD's 3C chart during its run up, leading negative, distribution of the entire run or short selling by smart money, this chart looks almost identical to the market's.

Today, RVBD gave back nearly all of the new year gains in 1 day and it is just getting started.

Fitch Downgrades 6 EU countries under review.

On the downgrade list:

Belgium, Cyprus, Italy, Slovenia, Ireland and Spain.

Interesting indications

Today s certainly seemingly slow, but often our best insights in to the market are in fleeting glimpses.

 Rates are selling off hard, the market usually is attracted to rates like a magnet, take a look at the longer term chart.

Rates and the SPX were in lockstep on the October rally, which had strong 3C accumulation, since they fell out and the market took a sharp downside correction, through the last area in the red box not only have they diverged/dislocated badly, but are at multi-year lows now.

 The correlation between the SPX/Market and the Euro has been totally shut down today, which is odd being they have tracked so well recently, I mentioned earlier why I think this is happening and the disappointing GDP today I think is no coincidence.

 Here's the normal correlation, note today's distinct change in character.

Commodities which have a tight correlation to FX markets are responding in general to the Euro, Equites however have been shut down completely.

Impressions on Gold

Well Gold is back in the limelight, every place you look there's a different take on why gold is a buy here, it may be, but it is still a suspect top. One of the things that all bubbles have in common (at least from every major bubble I've studied over hundreds of years, from the Dutch Tulip Mania to the South Sea, to the Dot.com and recently the housing bubble) is the phrase, "This time it's different". There also is a number of bubble related businesses that pop un around the bubble, in gold's case, the $300 courses on how to become a precious metals scrap dealer. Then there's the layman turned expert, I've seen a lot of them among my peer group, they proudly proclaim that they are buying gold and silver. When one of my friends recently showed me some silver Eagles he picked up on the internet, I asked him why the edge had an obvious seam? As far as I know, the coin wasn't originally minted in two separate sides and put together (which leaves a seam). To make myself even more unwelcome, his wife was showing me a Tiffany Heart bracelet she picked up on the cheap on Craig'sList, apparently it was an unwanted Christmas gift. The only problem was a knick in one of the links that had scratched away the silver plating, revealing some yellow colored core.

These were the same friends who became real estate speculators in 2006-2008, yes they flipped a few houses as the wife who is a home schooler went around the neighborhood talking to people about buying their houses before they were listed. Long story short, after making $90k profit on the last flip they did with some other friends (which ruined their friendship as they argued over what type of base moulding should be used in the rehab), they got greedy and bought two houses to flip and the bubble burst, particularly bad in our area, about a 50% decline. They got out of one, but now have 2 mortgage payments to make as the renters in the second house don't cover the mortgage, so that's about a $500 extra payment every month for the last several years. Meanwhile they're about to lose their wind insurance because their own roof needs to be replaced.

Get the gist of the mania that runs wild among bubbles? No one can ever imagine the end, but despite all odds, the end eventually comes.

As for gold,

 Here's the notorious 150 day moving average that has been the best buy point upon a pullback for the last several years, it broke for the first time and to show it's still widely followed by GLD traders, look at the volume as price broke through on Wednesday, the follow through has been less impressive and this is the normal behavior we've seen at virtually every top that has broken, a rebound after the break back toward the top, just like we see in equities right now.


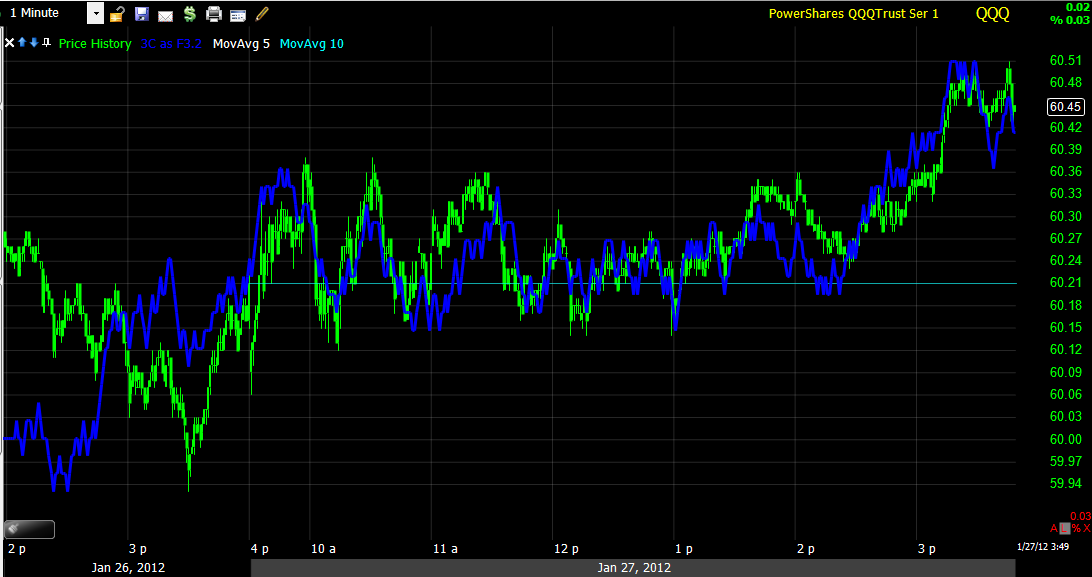
 Short term 1 min 3C at the break above the 150 ma

 There was accumulation setting this run up, however once again at the breakout,, 3C is not confirming.

 The 5 min chart shows accumulation for the breakout and is thus far trading sideways. Weakness in 3C always starts on the lower timeframes and if it is serious enough, it migrates to the longer timeframes, so we have a hint, but not confirmation of this being a false move.

 The 15 min chart accumulation and a not so great looking placement of 3C right now.

 Here's the big picture, GLD was accumulated and we have confirmation here, whether that stays or whether we see distribution will likely answer the question of whether this is a gold top.

I created a quick indicator of the average true range of GLD prices, during the uptrend it was quite stable, however volatility is seen both at the bottom and the triangle which I suspect is a top.

As for myself, I'm not a buyer of precious metals right now. I actually prefer Reef Coral propagation, it's a hobby that isn't going anywhere, it's not saturated with laymen, there are more corals on the endangered species list which means they have to be sold as tank raised and it's something I enjoy, plus the fact that the corals I use to buy for $50 are now fetching $400.


More on the algos

Take a look at USO vs the Euro
 USO has failed to follow a stronger Euro/weaker $USD, this tells me the arbitrage algos have been manually shut off, apparently they don't want extended long exposure and it would seemingly be over the GDP release. In plain English, they don't want their portfolios chasing anything higher because they are scared they may get stuck with higher positions on a potential market decline.

 There is a small positive in USO, but t hasn't even made it to the 2 min chart below.

I'd say that between the F_E_D disappointment and GDP, there's a bit of fear of a Black Swan as the SKEW Index has shown over the last week at elevated levels.


Quick Market Update

 Here's the move in the Euro since the open, the market thus far has not responded as it normally would in following the correlation higher.

 However the SPY has broken below the triangle on a pick up in volume, this is not a major sign and as you can see below 3C is in line with no positive divergence.


 However looking at the DIA, it almost looks like a little head fake as the volume is large here on the break and below we see a little accumulation. I assume the arbitrage algos are shut off today and we are seeing humans set this up. So in conclusion, if we do get a move higher based on the Euro correlation which seems to be turning down now, it will likely be a short lived move and should head back down. I don't know f it will move enough to warrant a quick fade trade on any potential move, but it is something to watch for.


Market Update

So far the market seems tame, it is still early. However there are a few things worth noting...
 Since yesterday's reversal of the F_O_M_C knee jerk reaction, today thus far has formed a small consolidation pattern where it should be and volume confirms it. This is actually a bit more bearish then it first appears.

This is the SPY vs the Euro (red) and the Euro has taken off on a parabolic climb, the typical correlation would have seen the SPY move up with the Euro, it may still, but it hasn't thus far and even if it does, it's showing a significant lag.

URRE Consolidation

It's always that 3rd trend traders forget about when faced with a reversal, (up and down and sideways).

The forecast was for URRE to meet the 10-day moving average and it looks like it will do it by simple treading water and waiting for the rising 10-day to meet it. Remember that a consolidation can occur through price (pullback) or through time (consolidation).

 The consolidation

 We are seeing some accumulation in to the consolidation which is what we want.

Long term the trend is looking good.

GDP Analysis from the Squid itself

Goldman Sachs at 200 West St. in NY City is chiming in on the GDP release.

-GDP worse then their forecasts, there was more inventory growth, less consumer spending, less business investment.

-The composition of growth was slightly negative for Q1 (2012) outlook

- Growth in domestic final sales--GDP less inventories and net trade--was just +0.9%, in contrast to our expectations for +2.0%.


-The weakness reflected: (1) slightly weaker than expected consumer spending of +2.0%; (2) weaker than expected business fixed investment, reflecting a 7.2% decline in structures investment; and (3) a 12.5% contraction in federal government spending on national defense. National defense spending tends to be volatile, and we would therefore discount this component as a signal about the near-term growth outlook.The misses on consumer spending and business investment are arguably more meaningful.


- Inventories increased by $56bn during the quarter, adding 1.9 percentage points (pp) to GDP growth--much more than we had expected. In contrast, net exports actually subtracted 0.1pp from growth. We had forecast a positive contribution from net trade of +0.5pp. GDP excluding motor vehicles increased by 2.5%, implying that the rebound in the auto sector added 0.3pp to growth.


- The GDP price index increased by just 0.4% (annualized) in Q4, far below consensus expectations for a 1.9% increase. Nominal GDP growth was therefore quite soft at just +3.2%.


Translation, the US was supposed to have a golden quarter which backed the hype from Jamie Dimon of JPM that events in the EU won't have much of an effect on the US as the US economy has decoupled with the world (presumably because GDP was supposed to reflect robust growth as proof). 


Reality: The US is more likely then not simply lagging events in Europe, however when the real dominoes start to fall, Dimon's theory will really be put to the test (remember he's presumably in well with one Bernakacide and towing the party line). However, if the US housing debacle sent a shock through the world economy through a vast global financial spider-web that eventually provoked the EU crisis, what would happen when a continent starts to fail and the shock wave travel back in the opposite direction through that same global financial spider web?


The US has been caught flat-footed more then once for a failure of imagination. I will point out that the Great Depression in the US was 70 years before globalization and we haven't really had a test of the system to understand exactly where the weak points are in a new globalized era.

Moving the Market

ES was subdued for most of the night, by the 3 a.m. EDT European open, ES was close to the regular hours lows of the day. A successful short term Italian debt auction which was financed with LTRO cash as they were182 day bills and 331-day bills, well within the 3 year LTRO and with the ECB spreading rumors that the next LTRO could be up to $10 Trillion dollars, why not go ahead and spend that cash at this point when the next LTRO in February will likely take care of all of their financing needs? However, should the bills fall outside of the 3 year LTRO, I wonder what the hit rate and yields would be then?

ES climbed a bit on the good news out of Italy, but it didn't last long, interestingly about a half an hour before USE Q4 2011 GDP was released, the market stalled, we all know that the news networks all had the GDP number in advance under embargo from their audience, who's to say though that a quick coffee break call wasn't made to 200 West Street? Financial news perks, that quick call must be worth at least a Lamborghini!

To say Q4 GDP missed is to miss the point. Yes, Q4 missed at 2.8% vs consensus of 3% and word is the whisper number on Wall Street was significantly higher. However to see a .2% miss is to MISS the real Q4 GDP and its implications as head line numbers are all most investors look at.

How about if nearly 1.95% of the 2.8% number was due solely to restocking? Some might even say Channel Stuffing. Well that would be the truth which has some dire consequences now and in the future. First without the huge restocking contribution, GDP would have come in around between .7 and .8%. As far as the effect that massive restocking will have on Q1 2012 GDP, well Q4 2010 restocking subtracted  1.8% from the final .4% Q1 2011 GDP and the kicker is that restocking in Q4 2010 was only .9%, this qtr. we are near double that, so Q1 2012 GDP is already set off on a nasty and very likely decline.

That's the stuff that headline numbers miss.

You can imagine what ES did from 8:30 on.

Although there's been lots of other filler news, nothing of real consequence has come out, especially from Greece where the clock is tick, tick, ticking away. However Mitt Romney did ask Newt Gingrich for an apology in the Florida debates. Of course I know it's political theater, but I personally wouldn't want to be the buy running for President who is playing up that his feelings were hurt during a campaign.

Here's ES overnight, note the trajectory in 3C even after the EU open.
Who knows how far a leak may actually go back?