Tuesday, September 6, 2011

OK, IT'S BEEN A LONG NIGHT, BUT....

Thanks to the help of David DT from Trading-to-Win, it seems our email issue is finally solved. Thank you for your patience and my apologies for the inconvenience. Once again, thank you David, a friend who is always there whenever you need him.

EMAIL SERVICE RESTORED ... I THINK... Options

Sorry for temporary inconvenience


Ans remember - I do not know that something is wrong unless it is

reported - so do not hesitate to bombard me with hundreds of nasty

emails - I will tolerate all of the abuse - that is what SOME of you

are paying me for.

One day I will just RE-SUBSCRIBE every single one - I bet half of

emails will be gone :-)

And - please do visit blog itself when in doubts

The Wiggles

As I posted in my last QQQ update, I thought the market would see "the wiggles", just intraday movement typical of any trading day...

 Here's the area from negative divergence to positive divergence, but both on the short term 1 min chart that is typical of intraday moves.

And here are the divergences...

The RIMM Trade

If you have been following the RIMM Trade since the start, you'll see that EVERYTHING that we expected to happen thus far, has happened.

 Back in July when RIMM was in a trading range, we expected a downside head fake move below support, that happened. Then we expected a move back in to the trading range and ultimately a move above the resistance of the trading range-That happened. Then we expected  pullback that would most likely fall back into the trading range on a head fake move. That happened today. We expect RIMM to move up from here, likely in to the high $30's and even the $40's. This will set up the BIG trade. When RIMM makes it up to the target area, we expect to see heavy distribution and RIMM become an excellent short and ultimately make a move lower that will create a NEW LOW!

 The 1 min RIMM chart shows the head fake this morning below support, RIMM quickly moved back above the trading range. Right now it looks like some profit taking is gong on. I don't expect RIMM to move back in to the trading range.

 The 10-mn chart shows the accumulation we expected to carry RMM higher eventually.

The 15 min chart has shown a lot of improvement today.

Financials

FAS Financial Bull 3X
 FAS5 min went from distribution to accumulation and a leading positive divergence, this is the accumulation we expected to see on a fall in the broad market, except quite a bit faster then anticipated.

 FAS 15 min-this is an important timeframe, it went from a negative divergence sending FAS lower to a current leading positive 15 min divergence in 2 days, this often takes 3-4 days or longer.

FAZ Financial Bear 3X
 The 5 min chart showed accumulation over the last few days in to lower prices, it has run up and is starting to show distribution. Distribution/Accumulation will always show up on the short time frames first and if they are strong enough, bleed in to the longer, more important timeframes.

 FAZ 15 min accumulation last week and the 2 day run up, we now see signs of a leading negative divergence or distribution.

XLF
 XLF5 min showed distribution before it fell, now we have a leading positive divergence-or accumulation.

 The 10 min chart shows the same as the 5 min was strong enough to bleed in to the 10 min.

And now we have leading positive divergences on the 15 min chart.

Reversals are often a process, not a 1-day event and Financials are obviously under accumulation. I'm starting to close out my shorts and head towards flat, but I still maintain some short exposure as I think we'll have another day or so of base building at least.

Financials Short term

I'm going to follow up with a more complete picture of financials after this post...
 Both FAS (financials long) above and FAZ (financials short) below are both trading in line with the price trend.


XLF is showing a positive 1 min divergence along the lines of the last update for the market.

Intraday movement

The last post showed some intraday downside, I think this s just the normal wiggles we can expect on any day, but the QQQ are showing the start of what may be the end of the last signal down, which means stocks can do 3 things, go up, do down or sideways. I would think slightly up to sideways are probably the path of least resistance, although this is a very new signal and just in the QQQ so far.

Market Update

As I mentioned in the GLD update, a bounce there could have downside for the market, however these are short term signals.

 DIA 1 min negative relative divergence

 QQQ 1 min negative relative divergence

 QQQ 5 min current negative divergence

 SPY 1 min negative divergence

SPY 5 min negative divergence.

The longer term/bigger picture timeframes remain positive and are adding to the positive stance, however on a short term, it looks like some intraday downside in to the close is probable.

USO Update

Starting from the longer trend and working down to intraday...


 15 min USO in a negative divergence sending it lower

 The more detailed 10 min chart shows some positive divergences the last 2 days

 The 5 min chart shows a positive divergence on the open and USO higher intraday, but there's now a negative divergence suggesting some downside.

The 1 min chart confirms the 5 min above in greater detail. I would look for an intraday consolidation and more likely a pullback in USO.

GLD bounce

This looks like an intraday bounce, as I explained last week, I've tried to stay away from GLD/SLV until the signals clear up, but intraday, I think GLD will bounce, which could have repercussions for the market as GLD is a safe haven trade-this is an intraday signal though...
 GLD 1 min in line

 The 5 min chart and afternoon trade seems to show some positive divergences

 GLD 5 min also shows afternoon positive divergence, even though it is in leading negative position.

 DZZ-GLD short... Is showing an afternoon negative divergence on the 5 min hart,


And the 10 min chart...

Full Intraday Market Update

 DIA 1 min was in line this morning with the gap down, there's been a negative 1 min divergence in most averages that appears to be a consolidation area/slight pullback also possible.

 DIA 5 min is in a leading positive divergence

 DIA 10 min shows the negative divergence/turn down and a positive divergence the last several days as we expected to see in to lower prices.

 Now even the 15 min chart is starting to lead positive, this is what was expected, although it is happening faster then expected.

 IWM 1 min was positive on the open, lifting prices. There's the same negative divergence leading to lateral trade.

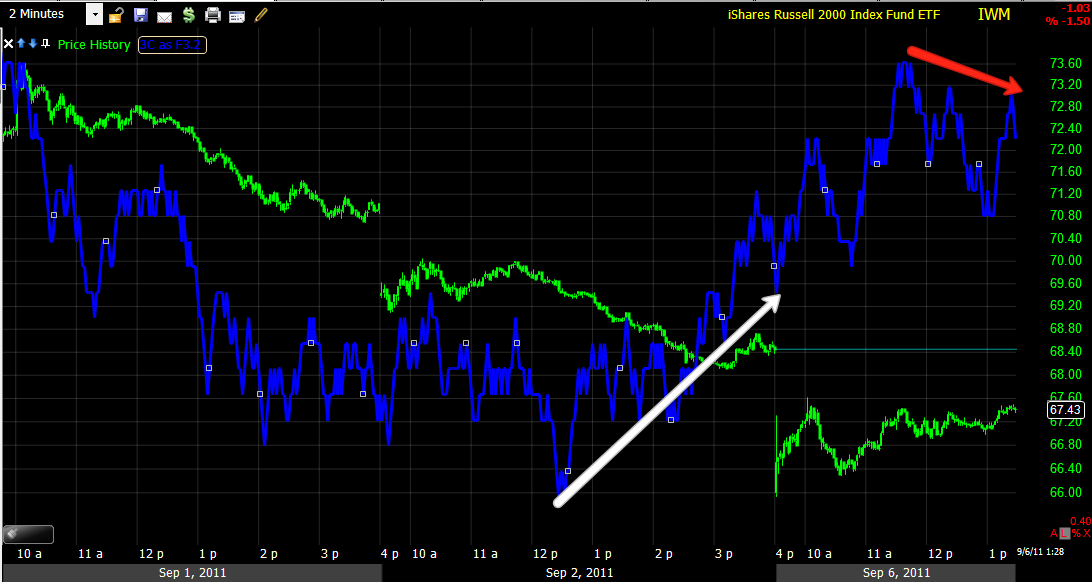
 The 2 min is in a leading positive divergence, with a slight relative negative divergence, leading to a little range/consolidation.

 The 5 min chart is in leading position, but also showing a negative divergence on a small move out of the lateral range recently.

 The 10 min chart is starting to lead positive.

 QQQ 1 min showing the positive divergence on the gap down leading to intraday higher prices, we have the same negative divergence/range as all the other 1 mn charts.

 The 5 min chart is leading positive and pretty heavily.

 As is the 10 min

 The 15 min is starting to lead already after only 2 days down.

 Here is the range of pullback we expected, from inside the triangle, to below it and possibly even a new low. Remember, reversals are rarely an event, they are a process.

 SPY 1 min looking like the others.

 The 5 min is inline, but leading positive

 The 10 min is slightly positive-remember the heavy financial presence in the S&P.

 The 15 min chart is leading.

 This is several days (5 min chart) of sector rotation.

XLF-Fnancials

By now you may have heard about the massive lawsuit against 17 banks. At  2 p.m. Representative Brad Miller is hosting a conference call with regard to the lawsuit filed by the FHFA, this should be interesting for financials. Some suggest this is a wolf in sheep's clothing and not at all what it appears to be. Here's the article from ZH.

In the meantime, here's what XLF (Financials) looks like on multiple 3C charts.
 XLF 1 min shows some intraday nervousness ahead of the PC

 All of the other charts are looking like they are accumulating strongly-5 min

 XLF 10-min


XLF 15 min