Friday, March 7, 2014

Friday's Market Close

Since I haven't seen EVERYTHING that I need to I'm not calling this a Daily Wrap, but I do think I can give you a pretty easy to understand perspective of what I'm seeing.

First of all, nothing you will see in this post will contradict the earlier Futures / Multiple Timeframe Analysis post from today.

To recap that post, essentially nothing has changed since early February when I said we'd see a head fake move to the downside, but don't be misled by price, this is a bear trap that will set up such a strong rally that my inbox will be full questioning whether or not the next trend I anticipated is still possible.

Just like the head fake to the downside that caused unprecedented bearishness in the market, so much so I wondered how much they'd have to do to reverse this bearishness and thus the reason I wrote the warning that this will be a very strong move in an effort to give you expectations so you would not be surprised.

However, once again, don't let that mislead you, the entire reason I believed we saw a bearish head fake move that led to an exceptionally strong move to the upside is the same now as it was in early February before the rally started, except now I have objective evidence confirming my theory.

What was my theory? That to set up a large move to the downside, even larger than the recent upside move because volatility keeps expanding on every major pivot, there would need to be enough demand and high enough prices for smart money to be able to sell in to without sending price down before they are ready because of the size they trade in, THIS WAS THE ENTIRE REASON FOR THE DOWNSIDE HEAD FAKE THAT GAVE THE UPSIDE MOVE MOMENTUM AND FOR THE UPSIDE MOVE. A MOVE TO THE DOWNSIDE THAT IS EVEN BIGGER.

Ok I hope I explained that well enough, but if you still have doubts or questions, I'll be happy to find the posts from early February BEFORE the upside move started that laid out the short term downside head fake, the sub-intermediate upside strong rally and what comes next, likely a primary bear trend or bear market. The posts are all there in early February and even late January explaining all of this, the only difference now is that we have confirmation that the upside rally saw the distribution expected to be the move we expected and FOR THE REASONS WE EXPECTED.

That being said, this afternoon's Futures post showed short term upside on 1 min charts in Index futures and then multiple larger/longer charts that have significant negative divergences.

When comparing the short term positives to the long term negatives, it's like a game of "Rock Paper, Scissors", this is the example that I always use in my head when looking at these charts as I have learned over many years of using 3C.

Short term charts are PAPER, longer term charts are Scissors and Scissors ALWAYS beat paper. 3C is not meant to be a signal generating indicator like a moving average crossover, which I think is one of the most useless systems in the world unless you are using it on a 5 day chart, but even then you'll have about 1 or 2 trades a year and your ability to sit through draw down and moves against your positions is worth about zero making the system worth about zero, but it is the best long term trading system I've ever tested, human emotions just mess it up.

3C, while it has been VERY useful in the past while the F_E_D was not in the market in calling timing turnarounds, is really there to show us what is happening below price, what's happening that we can't see which is very useful information. Before the F_E_D's intervention starting late 2008, a 15 min divergence was a timing cue. In fact during the range that came right after the July 2011 meltdown in which the market lost nearly -20%, this range was chewing up and spitting out traders, but we traded EVERY SINGLE SWING up and down using 15 min. charts and 2x leveraged ETFs long and short and over the 2 months the range persisted, made +85% on a model portfolio while everyone else was being chewed up. Because of the F_E_D's Put in place with QE, we had to find new timing markers like the head fake move that we see 80+% of the time before a reversal on any timeframe you want to look at. We started looking at Credit, Yields, Currencies, correlations, etc to gain that edge.

OK I digress, the post today about futures said, "Short term positive, likely in to the clos and not much more and everything else was very negative and when timeframes all align like that, it has worked out to be an excellent timing marker. So that's what the futures charts said whether Index futures, Currencies and Carry trades or VIX futures.

Now let me show you what I saw in to the close, why I think that Monday is likely the day to buy VXX and UVXY and to short financials and any number of momentum stocks.

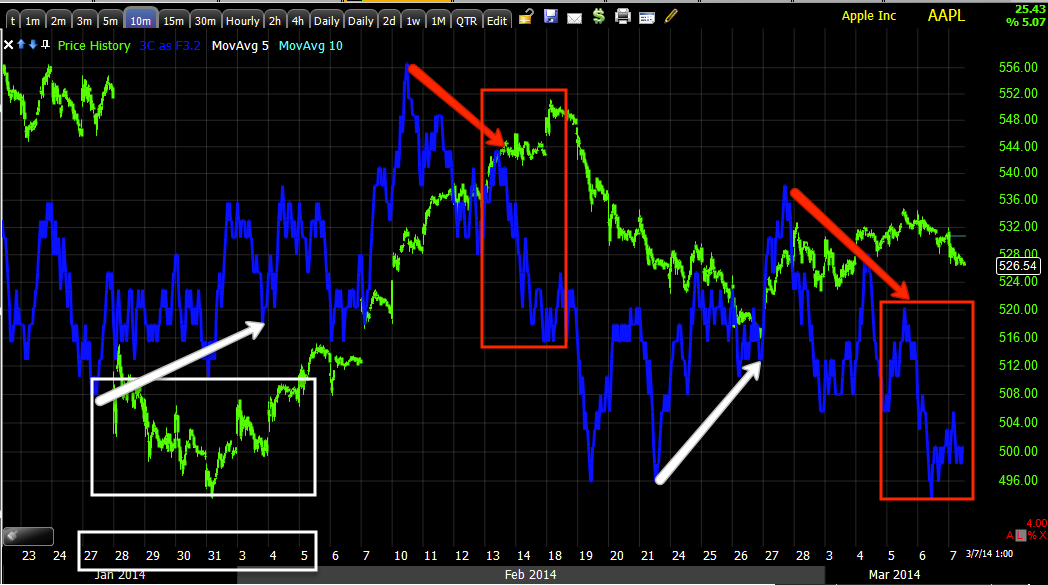
First the averages...
 Looking at the SPY in to the close, I couldn't find anything, the green arrow means in line so there's no divergence here suggesting strength on Monday which tells me it's not likely to be very strong, but there are some signals and they are there for a reason.

The SPY 3 mins (I'm looking at short term charts because they are the miost sensitive and would pick up even the smallest divergence first), again, other than distribution in to the open, we have nothing in the afternoon except "In line" which is not positive.

Looking at the 60 min SPY, Rock , Paper Scissors, this cuts paper and wins every time.

When I said above that in early February I thought this rally was not an ends, but a means to an end and that was to set up a larger move to the downside, I didn't have proof of something that had not happened yet, I was going from long term charts, trends and most of all, Market/Mass psychology, why and how the market sets these traps, like I always say, "WALL STREET DOESN'T SET UP ANY MOVE WITHOUT A REASON".

 NOW, looking at the QQQ I do have a positive divegrence, this is a 2 min chart and notice the divergence doesn't show up on the op-ex Friday until after the pin is removed around 2 p.m. ( a little before).

This 2 min chart tells me we likely see early strength Monday morning, UNLESS the divegrence gets run over by fundamental events over the weekend like we saw in HYG yesterday.

 In the Q's I can find a positive divegrence to 5 minutes, so while the SPY has none, it looks like the Q's will see better relative performance Monday. Would I buy the Q's for this move? NEVER, there's too much on the negative side and fundamental news can surprise at any moment and run over the divegrence just as it did yesterday in to the close with HYG.

 This is important... this is the positive divgerence in to a head fake move lower that started Jan. 27th and ran until Feb. 6th, this is why I wrote the note on Feb. 4th and if you looked at price alone, you'd swear the market was going lower, everyone at the time expected the SPX's 200 day moving average to be hit, but in to the head fake lower we knew that a strong upside move was coming to change sentiment to make it possible for smart money to sell longs, cover their carry trades and enter shorts.

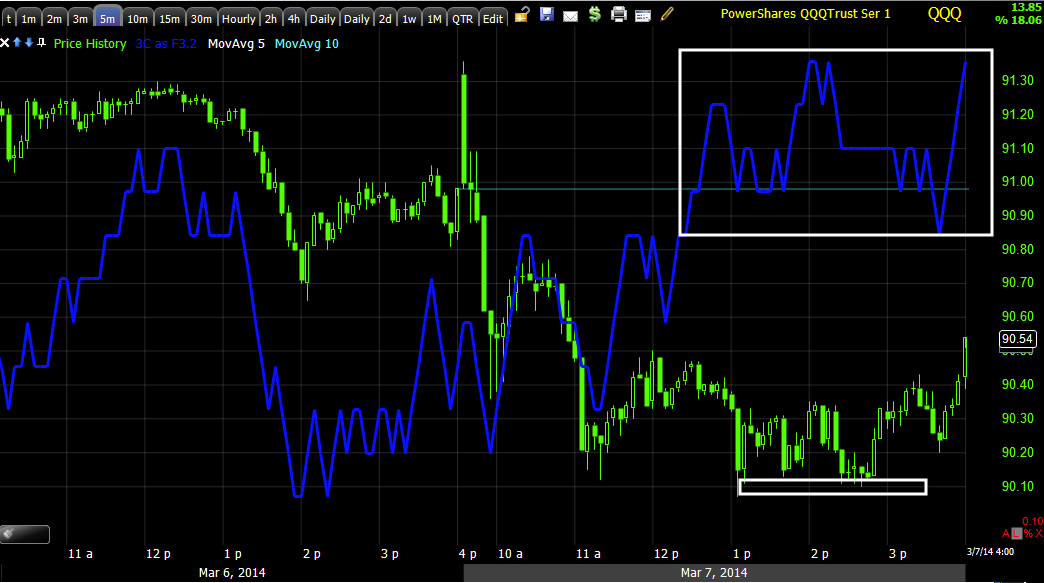
If you look at the distribution on this 60min chart, notice where it really kicks in, if you take the highs at point "A" and measure to the close today, over the last 2 trading weeks, THE QQQ HAS ACTUALLY LOST -.32% For those who feel like the market is moving up against them everyday, that's the truth, over 2 trading weeks, the Q's have lost .32% which means there has barely been any price movement, BUT THERE has been a lot of 3C distribution during that time.

 Remember the AAPL Trade Set up today? This is AAPL above, we were looking for a little move to the upside, it looks like the Q's will support that or AAPL is supporting the Q's, either way, we should get a crack at the AAPL short set up on a trade that comes to us.

 As for the IWM,  this 1 min chart is barely a positive divegrence, but that's the best I have there.

The point now is we barely have anything in the SPY or IWM and a small positive in the Q's, that's not the recipe for a huge move, that's the recipe for a small move and maybe only in the Q's assuming the divegrence isn't run over.

Long term or high probability IWM...
Again, the 60 min chart just like the other averages, just like the Index futures shows the accumulation on a head fake bear trap lower from exactly Jan 27th to Feb 6th and then the proof I didn't have when I first put forth the trend theory, but I have now, massive distribution through the move on the upside which is EXACTLY what we expected to see and not after the fact, this was BEFORE the market moved up 1 single point.

What else Do I have, well HYG assuming it doesn't get run over. I pointed out earlier how HYG's price shape today alone told me there was accumulation in this post, it looks a lot like the MCP price action.

 I have a 2 min HYG positive, but it didn't migrate over to 3 mins.

3 min HYG.

Remember HYG has been used to support the market which it wouldn't need if it had real demand rather than selling and shorting in to rallies, but since that's what's happening, they need something to move the market up, selling stocks doesn't move a market up, HYG fills that role.

As far as other evidence I have and what is most important to the actual trades and timing, I didn't enter VXX or UVXY (new positions) this week because I know what the charts should look like there and even though VIX futures are screaming, until I have evidence I feel comfortable presenting, I can't put it out as a trade idea just because I'm worried I might miss the trade.


When VXX is ready it doesn't have a leading divergence, it has a flying divegrence, even stronger, the strongest I've seen and I think it's because of emotion, fear is the strongest emotion in the market and emotion is what moves the market so when VXX is really being bought, people are scared and thus the divegrence is very unique in its strength, that had been missing this week, it was positive and in any other asset maybe enough to be a long idea, but as I said,  I know what a VXX divegrence should look like.

Now, first consider the short term SPY, QQQ and IWM charts above as well as HYG, if there were confirmation in VXX and UVXY, their short term charts would have a negative divegrence because they trade the opposite of the market, lets look...

 UVXY 1 min small negative divegrence from 2 pm to the close, that's not large, only 1 min and only 2 hours so I don't expect any huge move down, but I don't want to buy until I feel we have hit the low and with a 1 min negative, I don't feel like we've hit the low that is the pivot for a reversal.

 VXX 1 min has a small negative divegrence too, so I have some confirmation of both assets as well as the QQQ divergences.

 looking at UVXY 2 min, I have no negative and in fact a strong leading positive, this backs up the fact there are no positives in SPY and barely in the IWM.

 Look at VXX 5 min, you see the distribution on Monday that matches the market accumulation on Monday and then the drop Tuesday that matches the market pop on Tuesday, over the early part of the week I didn't have a divergence worth bringing out as a trade idea, but now the 5 min is starting to fly.

 UVXY 15 min if flying and this happened fast, it's also the kind of leading positive that I look for in VIX assets and this should only get stronger with a little pullback Monday. At this point, if the 1 min was positive, I'd be putting this out as a trade idea so you know what needs to happen on Monday for this to be put out as a trade idea.


 VXX 30 min all of the sudden starts to fly and this is a long term timeframe, they don't move like this easily unless something is really there moving them.

While the scaling isn't quite right, the 60 min UVXY is also flying, like I said, a pullback Monday will only make these stronger as it will be accumulated.

So it seems we have our most probable scenario for Monday, it didn't require that we do anything late today other than wait for Monday and then the signals, I think though once that starts to happen, the trades are going to come fast and furious so I'd say get some sleep and rest this weekend, the start of next week is likely to be the next leg in market volatility at the next pivot...DOWN

Have a great weekend, I'm sure I'll have more for you as I go through the charts, but this is what really matters.

VXX AND NEXT WEEK

I am really happy I have a UVXY position and don't have to make this decision this quickly, but I think the purchase or the best purchase will be Monday and I'll tell you why, it's based on the VXX charts, the averages to a lesser degree and HYG.

First the reasons WHY I want UVXY and shorts in place by the latest, Monday I'm guessing.

Actually I'm not going to have time to get charts out before the close. I'm going to be looking at all the same positions, PCLN, BIDU, NFLX, AMZN Financials short, and VXX/UVXY long, I think from the way HYG looks, the 1-2 min averages and the 1-2 min VXX charts, we'll see an early pullback in VXX which would mean early upside in the market, however the weight of the evidence is so overwhelming, I probably would not wait any longer than Monday for this position I've waited all week on.

I'm not saying the market will have some spectacular blow off top, I just think we'll get a little move that makes these positions worth waiting on, you'll see in the next post of VXX charts.

MCP Long Trade Set Up

I'm probably pretty repetitive here, but MCP is one of my favorite long positions for a primary trend that can buck the market, it is still in a large stage 1 base that I believe Goldman Sachs has been accumulating.

Tuesday I put out this post warning that MCP is getting close, not quite there, but starting to move toward a new long trading position, you can look at the charts in this post from Tuesday.

As to the update today, we are still not quite there, but have made significant progress and what I was thinking we'd see moving forward from Tuesday's update has been what has developed.

When looking at these charts, realize this is a large stage 1 base. If you know that an asset is going to move higher, some inside information or as a result of massive buying from numerous funds, do you want to pay whatever price or do you want to try to get the best price you can? Especially when the average entry difference can mean an extra 30% on the trade. It is this dynamic that creates "W" bases or rectangle bases, any base that is eventually pushed lower toward it's lows as I believe is happening in Gold over the sub-intermediate trend.


 The two yellow trendlines define the base from about $4.50 at the low end to $8 at the high end, note every time price reaches the high end of this large rectangle there's a negative divegrence sending it lower and at the lower support end every time there's a positive divergence or accumulation, this is played over and over again until the position size is reached, there's less distributed than accumulated, but it still takes time, we see this on every timeframe including intraday bases.

In fact at the orange "GS", Goldman came out with some news/analysis that sent MCP lower, why do you think that is, especially when the divergence since then has been the strongest leading positive of the entire year long period. Home builders were accumulated for about a year and a half right around the time the Tech bubble popped, who would have thought several years later Housing would lead the next bull market after a tech revolution that introduced the internet? Boring Housing! Well some of those stocks gained 2500-5000% so having a substantial position makes sense at the best prices possible.


 Here's the 60 min chart since the Goldman comments, note there's a positive divegrence or accumulation at every touch of the lower trendline and we just recently turned down from a move higher as we see a stronger divegrence that looks like it's going to be ready to launch soon.

On Tuesday this is what we had at the far right, I drew in the reversal process we almost always see and note the difference between bottom reversals and top reversals, bottoms are much tighter so we don't need a huge base , but I thought on Tuesday we'd see some kind of lateral base form moving forward.

Fast forward to today on the same chart.

 All of the sudden we have what we were looking for, perhaps not completely finished and perhaps not yet ready for a new long position, but progress toward EXACTLY what we were looking for Tuesday.

 This is the 15 min 3C signals for the area, that's what we want to see, accumulation in to a pullback is what I call a constructive pullback, the kind I want to buy as the price is better and the risk is lower and I'm trading with the people who are going to move the asset.

 Look at the 5 min chart during the same period, Tuesday we had an idea from 3C that this would happen and there it is.

And the 2 min trend, the highs in price being knocked down so MCP can be accumulated at lower prices.

I'm not sure what the exact signal for an entry will be, a head fake move, leading divergences that are even larger, a rounder base, but I do think MCP should be on your watchlist if you are interested, I don't think it will be long considering developments since Tuesday.

Going to be Looking at VXX and UVXY(long) in to afternoon / closing pullback and Financials (short)

I mentioned XLF and Financials, but said I'd wait on them , this iis the time I've been waiting on.

VXX or UVXY have good signals in place, if they maintain them in to an afternoon/closing pullback, I may not be able to wait much longer. I've been VERY patient with them all week as I know what their signals should look like. 

The same goes for Financials, albeit in the opposite direction. 

Even though the VIX futures are telling me there's likely not much time left before VIX explodes, I still require the objective evidence and not gut feeling.

Lets see what we get, it may happen very quickly.

Futures Updates

I have some very interesting Futures charts because they make a pretty clear case for multiple timeframe analysis, some of them you have seen, some you have seen have grown even more. Some, like VIX futures make me really wonder if I shouldn't be pushing a VXX position right now, again today the same member confirmed his VXX calls are holding their ground and remain green even though they haven't made any significant move and they have time decay working against them, this suggests they are well bid, which means protection is well bid.

First lets start with Index futures from intraday and then on out, I use examples of the different major averages instead of posting 3 for every timeframe, I'd have 18 charts there alone and I doubt you'd get through them.

Index futures intraday and multiple timeframe analysis


 ES 1 min intraday, these charts never hold up overnight and certainly not next day, they are decent for intraday, ES is in a little better shape 3C wise than price so that may be a positive in to the close.

 NQ/NASDAQ 100 futures 1 min were quite negative pre-open and open, but they have a small positive divegrence as you can see, they also have a fairly nice looking intraday rounding process, many times you can tell what the underlying trade is just from the shape of price.

 TF or Russell 2000 Futures are directly in line, no positive or negative beyond the price action 3C has confirmed.

This is multiple timeframe analysis, TF/R2K 5 min chart with a steep leading negative divegrence, this is the first timeframe that will hold up overnight, it's not quite as good as 3C on the averages as far as holding up over a weekend, but this is a sttep enough divegrence that the 1 min chart isn't going to be able to change this at all even if it were leading positive for the next 2 hours.

NQ 15 min (NASDAQ 100), there's a VERY clear, very steep distribution signal in effect here, again, nothing short term is going to change that. I haven't seen the 3C divergences in to the close yet, but based on what I see so far, it looks like a market collapse in to next week, lord knows there's more than a large enough reversal process and "Igloo with Chimney" price pattern in place.

 ES 60 min has a wicked long relative negative divegrence, these are typically weaker than leading, but with this size it's very meaningful and as usual, they tend to get worse and that is obvious in the steep leading negative divegrence , I wouldn't buy a market correlated long here for any reason with multiple timeframes all this extreme.

USD/JPY and $USD and Yen charts
 Intraday the 1 min USD/JPY has a pretty impressive 1 min leading positive divegrence, it developed almost instantly around the 2 p.m. area, it does have a bit of a rounding process, but it does NOT have a large divergence for the day meaning duration, just a quick spike, like a sugar high that's intense, but wears off quickly.

This is the 5 min $USD, it is in line with the downtrend which is not surprising as it has been negative the last couple of days.

 The Yen 15 min was intensely positive, now the 30 min is seeing migration of that divegrence which is why I give the Yen the advantage over the $USD, a lot of this is safe haven buying or closing of the carry, it looks like we might even have a head fake move in lace, but the real killer for the USD/JPY is the next chart...

$USD 4 hour has no divergence to speak of, you have to torture the chart to get it to talk, there's no edge in doing that, however...

The Yen 4 hour chart has a scremaing leading positive divegrence that is huge in size, THESE ARE THE KIND OF CHARTS THAT YOU WANT TO LOOK FOR, YOU DON'T HAVE TO STUDY THEM, THEY JUMP OFF THE SCREEN AT YOU, THESE ARE THE HIGH PROBABILITY TRADES, THIS ALSO MEANS THE USD/JPY SHOULD BE MAKING A NEW LEG LOWER IN ITS 2014 DOWNTREND AND THE INDEX FUTURES FOLLOW.

VIX Futures, the real thing, not spot, not an ETF.
 This 15 min chart has been positive, but it is clear that there's been a strong bid for protection, thus out members VIX calls holding up so well.

 Look at the divergence that has formed on the 30 min chart essentially since yesterday, I've been waiting for strong signals that jump off the chart to put VXX and UVXY out as new positions, even though I hold UVXY I still want to give the best looking entry for new or add to positions (and I love my UVXY position), this is showing massive flight to protection that is not being seen in the averages themselves which is why I would not buy a market correlated long, these are the type of signals that are a red flag for a gap down that takes out a month or more of longs in the am alone.

Beyond that, we've known about the longer term positive trend in VXX / UVXY and VIX futures in general, however on this 60 min chart that leading positive divergence was not there earlier this week, that developed just the last couple of days.

THIS IS EXACTLY WHY I'M WONDERING IF I SHOULD NOT HAVE VXX AND UVXY OUT THERE RIGHT NOW AS LONG POSITIONS, I'VE BEEN WAITING FOR ALL THE CHARTS TO SCREAM (THEY ARE POSITIVE, BUT VXX DIVERGENCES ARE SOME OF THE MOST INTENSE), I'LL HAVE TO TAKE A CLOSER LOOK, THERE MIGHT BE A GREAT ENTRY IN TO TODAY'S CLOSE.

2 P.M. Options Expiration Pin Expiration

Even though an options expiration Max Pain Pin which is designed to make the most number (in terms of dollar amount) of options expire worthless (as smart money tends to write them and dumb money tends to buy them as a cheap way to gain leverage over a large position) is usually on monthly options or has been associated with monthly expirations in the past, the weekly options that are available have become so popular that we have noticed that Friday's often open and hang around the close of Thursday and often tend to be pinned like today with the SPX down a mere -0.12% with a daily small bearish engulfing candle; the Dow-30 with a small +.11% gain with a small bearish shooting star daily candle, The NASDA 100 is the only one that has moved further out with a -.69% loss and a bearish engulfing daily candle; while the R2K has a -.23% loss and a daily bearish engulfing candle.

Judging by price action, today looks very much like a Max Pain options expiration pin,  however another thing we have noticed is around 2 p.m. (you may know because your broker may call you like mine did on op-ex Friday and harass you with multiple phone calls to see what you wanted to do with your contracts so they could close them up and not have to stay late on Friday afternoon), as I was saying, around 2 p.m. it seems that most contracts are wrapped up which means the market no longer needs to hold the pin in place to make the largest dollar amount of contracts expire worthless and allow them to keep all the premium, after all options are a Wall St. derivative and are rigged as such, just like Vegas, the longer you stay, the more likely you are to lose and the House always wins.

The point being, we are approaching that 2 pm mark.

A third thing we have noticed that allowed us (all on op-ex Fridays) to make the call on 1/24 that the next week we'd see a range in the market with accumulation which we did the entire week of the 27th, on 1/31 the end of day 3C action on an op-ex Friday allowed us to make the call that we'd see a strong head fake move lower which we did on Feb 3rd and all of this allowed us to call the very strong rally that proceeded the downside head fake/bear trap on a short squeeze.

The point being, as of 2 p.m. price does just about whatever it wants, usually rises, but I believe last Friday it fell after 2 p.m., BUT the most important indication are the 3C signals after 22 p.m., as they tend to pick up where they left off the next trading day even over a weekend and it was these signals in the last 2 hours of trade that allowed us to make all of the calls above that were astonishingly accurate.

Price will do one thing often and 3C another, price rarely matters, but as the post was entitled "Come Monday", the 3C signals matter very much as they pick up where they left off late Friday afternoon.

That being said, I just looked at HYG and could see just by the price action they are trying to ramp it again, this is the reversal process/proportional concept.
 Does the price action look familiar? That's the 1 min intraday HYG action from today only, I knew exactly what I'd see when I looked at 3C based on the price action alone...

Another attempt like yesterday's failed divergence to get HYG to support the market, likely after 2 p.m., although the divergences are what really matter. Does this one hold where yesterday's failed? I can't say after seeing yesterday's fail, however, to illustrate how little it matters AND THIS IS WHY I HAVE WAITED ON ASSETS LIKE XLF AND FAZ, I included a few more charts beyond 1 min that matter.

 This is a head fake move under accumulation, NOTE THE DATES, JAN 27TH -FEB 6TH, HYG was being used as support for the overall market which was seeing positive divgerences on the EXACT same dates.

The10 min chart above is leading negative in a huge way so the 1 min isn't going to change anything.

Or perhaps the 30 min chart that failed before the market...

Just so you know, however this may give some edge to a few positions I've been considering, more than that the signals are going to be very important.

Just after completing the AAPL post...

I look at the chart to set price alerts and there's a decent probability that the bounce I mentioned may be starting...
This is a close up view of the 5 min positive divegrence mentioned in the last post, AAPL Trade Set Up . As mentioned as soon as completing it, we have the start of a little bounce, it may or may not lead to more, but with a $100-$125 point gain in the balance on such a small upside set up needed, this is the high probability, low risk trade that I love.

AAPL Trade Set Up

By far my favorite trades are those that come to us on our terms, they give better entries, they reduce risk and they allow us the chance to let the theory of the set up prove itself, AAPL happens to be in one of those situations "IF" one small 5 min divegrence isn't run over, you might remember, but AAPL has been my nemesis in this lesson as I had been calling for a major top in AAPL for months as it was making all time new highs and AAPL longs were more stubborn than gold bugs in 2010. AAPL did top, I did have a well positioned short and then followed a small 5 min positive divegrence closing the short in anticipation of re-opening it at better levels, the divegrence was run over as a panic set in on Dan Loeb's Third Point holdings and all out panic ensued with AAPL losing -45% of its value in a mere 8 months.

Still, the trade has to prove itself so nothing wagered, nothing lost.

Here's the set up...

 This is the daily MoneyStream chart, a Don Worden indicator so I trust it, it's just not as sensitive as 3C or detailed, but when it has a trend like this of distribution, I take it seriously.

Please remember I no longer (nor does the market) consider AAPL a growth or momo stock, it still has its NDX weight, but as I have shown so many times, the death knell of MSFT which was an even stronger growth/momo stock than AAPL pre-2000 was their declaration of a dividend which made it a large cap mainstay for investors and it tends to stay within a wide, but fairly predictable range, AAPL I believe has just started down that road as well after losing 45% at our top call in a mere 8 months.

 The daily 3C chart shows the same distribution in the area, just more detailed.

Here the 30 min chart shows equal prices to the left, but a strong leading negative divegrence on the second high leading to a strong sell-off/gap down, that's when AAPL saw accumulation with the rest of the market from Jan 27th through the first week of February, yet AAPL's relative performance has been lacking.

The 15 min chart shows a more recent positive divegrence in AAPL sending it sending it up about 55 points in to a negative divergence/distribution which AAPL has now just started to move down from.

It is these divergences that hold the probabilities to AAPL's sub-intermediate trend resolution, they obviously are leaning to the downside, but if we can get a short position in place on a bounce to get a better entry and lower risk which could have a stop just above the recent highs (as long as it's not in an obvious area or at a whole number) and see that there's distribution in to the bounce (and I mean bounce in the true sense of the word, not a rally, then we have a pretty decent set up as I feel AAPL's potential downside after all is said and done (that means there will be a few interruptions along the way, but nothing a trend trader can ride out) is likely around $450 first and then $400 making for a decent move of about 125 points.

 This is the 10 min chart, also quite clearly negative and in line with everything else we see happening above, it is the 5 min chart that may present our opportunity.

Here we see several divergences that worked perfectly from a leading negative to a leading positive to a negative and a very small 5 min positive, this is why I say "bounce" in the true sense of the word, not rally.

Since it's such a small divegrence and the market undertones are so negative, it is difficult to judge where it might bounce to if the divergence can hold, but I don't see it moving beyond the recent top, however the higher the better for a short entry and risk profile, we'd just need to watch AAPL and set alerts to see when it looks like such a move has ended, again, IF it can get off the ground with all of those negatives piled up.

 I am looking at my X-Over chart (15 min) with a new sell/short signal at the last negative divergence at this top, this chart would suggest a move to the blue 22 bar moving average, although we've already seen one to that area so the next is often a bit higher, maybe the high wick around the $531/$532 area would be a possibility as there's good overhead resistance there, either way I intend to set multiple price alerts.

One thing that bothers me is there's no RSI positive divegrence, at least not yet so this is still theoretical, but a decent set up for a potential 100+ point move.


The 3 day Trend Channel which has held AAPL's up trend broke or stopped out recently at the red trendline on a closing basis at the red arrow, this means any bounce is HIGHLY unlikely to reverse this downtrend now in effect on a much larger scale and $450-$400 is really not at all out of the question considering, although I suspect there's be some gamesman ship as nothing moves in a straight line, around $450.

If you are interested set some upside price alerts, I'd take AAPL short here if this opportunity weren't presenting itself as every other chart is confirming a turn down in AAPL.