Tuesday, September 13, 2011

Alternante Scenario

Who cares about dazzling the shorts, they are in the market and haven't seen anything yet that scares them much. "Lets scare them". A nice parabolic move up or a big gap up may get them to think twice about covering.

If it were me...

To catch a criminal, you need to think like a criminal-same is true of Wall Street.

Here's my, "If it were me in the driver's seat on Wall" scenario...
 Move the market down below the bear flag... Give shorts something to sink their teeth in to.

Then, just like this dat on the 26th, at the EOD, close the market off it's highs and gap it up the next morning.

The longs are NOT important to Wall Street, it's not like, "we're all long, lets get those shorts!", it's more like "YOU ARE ALL SHEEP TO BE SENT TO THE SLAUGHTER".

So right now, what longs think about the markets has ZERO importance to Wall Street, to sell their accumulated position, they need to dazzle the shorts, get the shorts confidence in the market falling back up, draw them in and then trp them with a gap up or a big move up. Then and only then, do they have the supply of buy side they need to distribute their long holdings from yesterday/Friday.

Anything look out of place?

Uh... Houston, we have an algo running. Something is definitely up, keep your eyes on the market action, we don't get to see these in something as big as the SPY very often.

Or Maybe that Bull Head Fake is Coming Now...

 Even for a running negative divergence, this i a pretty bad looking chart, suggesting a move down from here. Recall my last post about a bull head fake and remember the earlier posts about a head fake centered around today's bull flag, maybe the is still an operation they are trying to score with.

 SPY 1 min

SPY 5 min.

More indications

FX also suggests more upside in stocks...
 FXE-Euro ETF is in confirmation, this supports equities.

 The 5 min hart is leading, also positive for equities, but notice a slight negative divergence inside the box.

 The 10 min chart is leading positive

 As is the 15 min chart.

UUP/$USD has a 1 min positive divergence, suggesting we may see a bull head fake tomorrow.

 UUP-the $USD 10 min is leading negative-positive for stocks.

 So is the 15 min chart...

Treasuries.

 There's a 5 min positive divergence in TLT, suggesting there may be a long head fake tomorrow.

 The 10 min is in line

The hourly is ugly, since this is a safe haven trade, this is positive for equities.

Market Update...

OK, so I took about 25% of my longs from yesterday off the table. IT appears Wall Street is using a short squeeze to sell / distribute their longs as well. Remember, ever since Sunday when I suggested this bounce higher, it was always intended to be a short term move, in fact one in which I'd like to use to re-open some short positions in to strength, I don't think we are at that point yet.

 This negative divergence suggests what I said above about Wall Street using the strength to distribute.

This is the same chart zoomed in closer and 3C is close to in line, even though it is in a negative posture. I don't know whether or not we will revisit the bull flag or if that is just history now. A move below the bull flag could bring the shorts back in for another short squeeze, but I don't think this move has that much time left in it.

Here's the depth of 3C activity in the SPY
This move started differently, I would say it's a move up of about 2.50-3 days, the current move seems to have a little stronger accumulation as it is shallower at the white box. You can see when 3C starts to go negative at the white arrows, suggesting we still have upside to go.

Short Squeeze?

The lack of pullbacks looks like a short squeeze, see yesterday's and what looks like one today. This would in part explain the 3C negative divergence as Wall Street (as I showed in an earlier chart) is already at a profit, so supply in the way of shorts covering s exactly what they need to sell their long positions. I may take a little profit off the table here, maybe 25%.

The Charts

 DIA 1 min

 QQQ 1 min

SPY 1 min.

If these don't pullback as I would expect, the we have most likely started the distribution phase already, remember I said I thought this would be a short move. We'll se soon enough.

Market Update...

I'm not buying it-figuratively.

For whatever reason Blogger is really slow uploading harts, but the move up out of the flag is negative on the 1 min charts, this may be part of the head fake. I expect this move most likely won't last in the short run.

This is what I really went to the Drudge Report for

Read this story from the FT about abuses being committed by Egypt's "transitional ruling authority"

Then if you have the time or inclination, go to the search box at the Wolf on Wall Street main site, it is in the upper top left corner.

Type in "Mubarak" or "Egypt" and read the analysis from back during the uprising. It basically said that Egypt has been ruled by the military since Nasser, they chose the president from their own inner circle and they were going to throw Mubarak out of power because he was going to side step them and set his son up to replace him, the uprising just gave them cover and ultimately, it WAS the military that removed him.

The promises of free elections in 6 months I said were a total farce, that the military would never give up power, which will precipitate another crisis in Egypt when citizens understand they were lied to, even though they hold the military in high esteem. In the FT article, you can see the military is already making moves to break that promise.

If you think the Arab Spring was an event that has passed, think again. As I pointed out, in Iraq and Afghanistan, years later, there's no credible government, and when these MENA regimes fall and are replaced by anarchy and unsavory types, the middle east and Africa will be changed forever and not in a positive way.

This WILL have an effect on oil and likely world markets.

A Little Boredom relief...

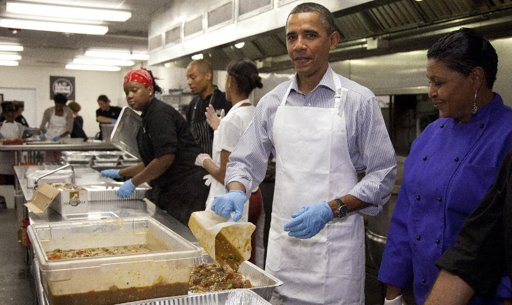
This picture was on the Drudge Report with the headline, "Poverty Soars"
Now this is not comic relief, I'm not even kidding when I say this. I DO NOT feed my dog regular store bought dog food, if you look in to the ingredients, especially anything that says, "meal" behind it like chicken meal or beef meal, etc, you would never feed it to your dogs either. Last night I made my dog's dinner for the week:  Zucchini, Carrots, Apples, Broccoli, Green Peas, Eggs, Sweat Potato, PlainYogurt, Cottage Cheese, and diced up beef along with Vitamin E, C, Omega 3 fish oil, Flax Seed Oil, Milk Thistle and Selenium (you have to be careful how much Selenium you give them). I kid you not, it looked EXACTLY like what the President is serving.

And from a background running a Cafe, with my food handlers and manger's license, where are your hats and hair nets?

The NYSE TICK Chart

3C even works on the TICK hart to some degree, it's showing a 12 p.m. positive divergence which would be positive for equities. Whether this is part of a head fake still or a real move up, remains to be seen. 3C is still in line with price.

Market Update...

I always am nervous during a dull market, too many experiences with them I guess.

Any way, let take a look at the continuing bull flag.
 It almost seems like Wall Street is attempting to entice longs to jump in on this bull flag, I would guess once they do, they'll take price below the flag, take the long's shares and send prices higher or some variation of that.

As you can see, 3C is still in line with the bull flag, no hints of accumulation or distribution, just confirming the price action.

Market Update...

So far there's only the  1 min negative divergence I mentioned earlier that I said would bring a pullback/consolidation.

Here's what to watch for...

There's a bull flag now that is getting more noticeable/obvious, if Wall Street starts seeing buy orders coming in from retail , as retail expects a bull flag to resolve to the upside, they may very well try to shake out those longs with a drop out of and below the flag, after that, the market should start moving up again, it all depends on whether this pattern has attracted enough interest from retail to make it worthwhile.

This would be another example of how Technical Analysis is used against technical traders.

Cycle levels

Just about every stock and other trading instrument runs n a 4 stage cycle, whether you are looking a a monthly chart or a 1 min chart, these cycles are everywhere. Stage 1) Accumulation / Stage 2) Mark up or rally Stage / 3) Distribution Stage /  4) Decline.


Lets take a loon at our most recent cycle starting yesterday.
The white box is where we observed accumulation on Friday and Monday and the line through it is what I would guess to be the average position price. The red box is where most of us bought yesterday.

This was Stage 1 accumulation. We are now in stage 2 mark up/rally. During stage 3, Wall Street will start distributing their shares in to higher or flat prices, that's when we want to be selling as well, after that, we can probably catch a few short trades for Stage 4-decline.

To give you some idea of the move I expect (roughly)...
This chart compares the 3C accumulation of the last move to this one, roughly the same. The last move spent a day in accumulation, then gapped higher and had one more day of gains, but price lost momentum as it was under distribution. So something along the line of 2 days or so I would think.

Market Update

It's still early, but it looks like a small intraday consolidation/correction is coming soon.

SPY 1 min-all of the other averages look the same on the 1 min chart as well.