Friday, November 19, 2010

Most Interesting Chart Today

 Today you can se while the market was flat, 3C made a big move down on the daily SPY

 Yesterday while SPY was up nearly 1.5%, 3C did not move up, but sideways.

Wednesday, 3C is at the same level as it was on Thursday.

USO


USO 1 min showing two relative price points and the second around 2:30 is showing a relative positive divergence

USO 5 min showing Yesterday's relative negative divergence at the second high in the afternoon. Today there was a slight positive divergence off the open, the rest of the day it has been trading in confirmation of price again with some strength coming in late in the day.

Today's 10 min chart is more or less in line on the larger scale, but when looking at price action, there is an ascending triangle, although 3C has traded in a down trend. This is slightly negative on the 10 min chart.


The 15 min chart shows the original positive divergence on Wednesday afternoon that sent USO higher yesterday. Since then the 15 min chart is showing a positive divergence today. by making a new high for this 3 day period.


The hourly chart remains locked in confirmation of the trend.

The strongest pull on USO will be the Eur/USD pair. The 15 min positive divergence that has developed today makes me think we will see some more strength in USO, but until the hourly chart shows some strength, I'm not long term bullish on USO.

1 min Divergences Worsen

 DIA 1 min LEADING NEGATIVE DIVERGENCE
 QQQQ 1 min LEADING NEGATIVE DIVERGENCE
SPY 1 min LEADING NEGATIVE DIVERGENCE

The DIA 5 min is in negative territory, the SPY 5 min is in positive territory, and the QQQQ 5 min is in positive territory.

If these keep up, we'll probably see some bleed through into the 5 min charts.

BAC still short

 This daily linear regression channel shows the trend in BAC that has been down for 7 months now, we sometimes miss the importance of a tend just watching the daily gyrations, but this is a profitable trend that could be added to as short selling of equities  (vs buying inverse bear ETFs) allows us to pyramid the position, where as a traditional long must be sold to utuilize the gains-not so with a short.
The white boxes are low risk, higher probability entries. I still prefer to phase into a position at one of these points and add the rest on a new low in the trend with all of the volatility in the market and considering the majority of this trade has been countertrend. You'll want to watch that MACD positive divergence in the future.

Here's my Trend Channel for objective stops which covered 3 trend trades, the first a short from the $35 area to sub $10, the second  a long from the sub $10 area to $15 and the current short side trade from $20-ish to $11.64 with a current stop at $12.76. As I showed the last week or so, we had a good opportunity to get in toward the top of the channel (lower risk). In all 3 of these trends, the channel did not produce one false stop out signal.

Afternoon Update

 DIA 1 min

 QQQQ 1 min

SPY 1 min-this is the weakest negative divergence of the 3

GM Upate

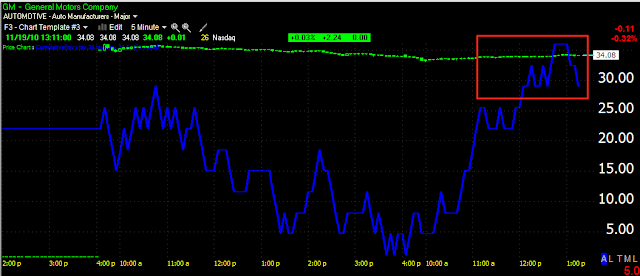
GM is not a stock I'm very interested in trading, but I think it's a great opportunity to watch how 3C/GM/and the market all come together with a stock under known accumulation.

 GM started trading at $35, being we are below that and 3C is making a new high on this 5 min chart, we are looking at an automatic leading positive divergence.

Interesting, we know the institutional sponsorship came right at GM's lows this morning as it threatened to break $33, the 1 min chart shows what I'm assuming is probably the market maker stocking up on an order or front running a larger institutional order they knew was coming, thus the white arrow showing a 1 min positive divergence. Right now we have a 1 min negative divergence suggesting a pullback. Remember though, the leading divergence (because it's leading and because it's a more important 5 min chart) takes precedence over the continuation of the move. So my assumption is this tells us there's a buyable pullback coming and a high likelihood of the trend up continuing.

An Isolated Patch of Specialized Semis

Here are a couple of mostly solar related specialized semiconductors worth a look at for long positions, at this point I'm going to say for relatively short holding periods unless we see some sector rotation into the group. I've looked at the charts and 3C on these and they look not only good, but better then anything else in the group right now. Most have carved out several days on intraday bottom price movement.

TSL This looks like a bounce just getting started, whether it goes beyond a bounce or not will depend on the underlying action of both the group, the stock and the market. Because of the market, that is why I'm saying I believe the holding times may be relatively short.

CRUS has a breakout around $14.10

FSLR also looks like a rebound bounce.

DSTI is speculative, but I think it looks like one of the best in the group.

LSCC 1-5 min charts have kept up well and 10-15 min charts are showing leading positive divergences, as many others are as well.

Take a look at these, if any interest you and you'd like any more details on them feel free to email me. I haven't checked any of these for earnings.

What a Difference Institutional Sponsorship Makes

I previously though that institutional buying showed up first on a 10 min time frame. A few months back I saw something that changed my mind, that it really could be spotted on a 5 min chart as well, which previously i had thought 5 min charts as with 1 min charts were pretty much just market maker/specialist types moving money in their accounts around for a shift in trend as they see the orders coming in.

In any case, this is proof positive that the 5 min chart shows institutional sponsorship.

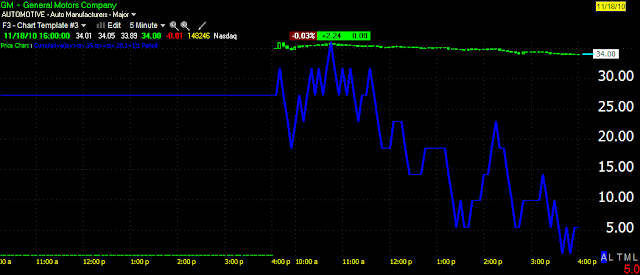
 Here's GM yesterday at the close. Last night I wrote that nearly the entire issue's float was churned yesterday, putting shares in the hands of retail and out of the hands of institutional as no positive divergences showed up whatsoever and GM lost a buck.

 Here's an updated chart this morning with institutional sponsorship as they try to keep GM above $33. It'll be interesting to see the point in which they stop sponsoring it and see if it falls again.

And here's a closer look at the actual price movement caused by that sponsorship-taking prices off the low of the day and moving them up.

Early Update

Make sure to take a look at the GM chart below, this is one of the rare instances where a positive divergence that is live is confirmed by institutional support at the same time.

Here's the early view of the charts...

 dia 1 min

 DIA 5 min leading neg. divergence

 QQQQ 1 min leading neg divergence

 QQQQ 5 min leading neg divergence

 SPY 1 min

 SPY 5 min leading neg divergence

 XLF 1 min leading neg divergence

XLF 5 min leading neg divergence.

Thus far it seems they are going to try to pin those $120 SPY calls. This is the situation  mentioned last night that was at a tipping point and could have gone either way.

3C/Institutional money in live action

GM continued seeking off today as I showed you this fast 3C chart yesterday showing the selling. Now we have a positive divergence as news is out that at the lows this morning (where the positive divergence is) DMM GETCO had to step in to buy to keep it from breaking $33, the IPO settled price.

Here's the Story


This is one of the best examples of 3C showing real accumulation in real time-CONFIRMED