Wednesday, April 11, 2012

Midnight Update

Once again, I'll keep tonight short. From the sentiment reports I've heard, now the bulls have turned bearish, which means the market in my view is looking to shakeout the bears on this, what I believe will be the last bounce before the market cracks and moves far enough away that it won't make sense to try to engage the bulls with more bounces.

Today the market held its ground pretty well considering the dollar strength acting as a headwind. As I showed in later in the day market updates, it looks like Wall Street had to ante up some more positive divergences to hold the market in place against the dollar headwinds. A most curious event took place in ES.

As I have explained before, ES is excellent with 3C for intraday divergences, the only time I have seen it stay negative is through the last two bounces and it started that way last night. However today, there was a positive divergence in ES as well as it slipped a bit worse then the market, now it is back on track and rising and the persistent negative divergence (this lasted 2 days in the last 2 bounces) is back in effect, in my view, this is good news, ES can rise in to this negative divergence, but what it has told us in the past is "all strength is being sold"

 ES overnight moving toward the day session's highs.

I think the most likely scenario is a strong gap and a strong move up in the market tomorrow, we should see negative divergences start to take over ad I do not believe today's gains were anywhere near the extent of what Wall Street had planned with the divergences of Monday.

Also, since the close, the dollar has weakened and that is helpful for a market bounce.

If recent history is out guide, I'm thinking an early and strong gap, some late morning consolidation and a move higher after the EU markets close after noon time.

As has been the plan since Monday, I'll be looking to sell / Short in to strength. I didn't put any model portfolio trades on today, I'm trying to be patient, because I do not feel we are near the Wall Street bounce target zone and because 3C was not showing the negative divergences I expect to see in to strength. Today looked more like a fight to keep the market from sliding against the strong dollar and the QE-negative Beige Book.

I am very excited at the prospect of getting excellent positioning on a stronger bounce and 3C distribution. I feel this is about the last bounce that can be squeezed out of the market. Remember, the margin interest and investor net worth are at very bearish extremes, when the market cracks like it did Monday (but I believe much worse the next time), margin calls will come rolling in and the snowball effect that can be seen in many high profile stocks completing recent head fake moves should add to the fun.

Volatility Update

Last time I used a custom volatility band, but unlike Bollinger bands that are based on closing prices, these bands are based on the day's range, giving you a true idea of the volatility.

The last time volatility has picked up by about 50% since the trend up from January-February. March is when volatility started picking up, this is also a sign of a top. I just ran the same calculations and volatility has now doubled from a 50% increase to a 100% increase.

This should have an effect on a market bounce.

IWM Close

I'd say, big nasty gap it is...

Check out the last 30 mins or so in the IWM

 The IWM 5 min is already looking strong

 The rate that the upside leading positive divergence took off at near the EOD is pretty amazing, that's one of the more vertical leading positive divergences I have seen.

The IWM was also the only average to really start to move at the end of day, just about challenging the early highs when it already posted a 1.37% gain on the day. If you look back during the rally around Jan. of Feb. it could take a week to get a 1.4% return. That's volatility picking up.

Tech, Energy, Financials

 Energy 1 min , as it leaks lower at the end of day, it appears it's being accumulated here.

 The 5 min chart now has a decent size divergence in place.

 Tech which looked the weakest yesterday saw an earlier negative on the 1 min and many tech names are looking bad today, again toward the EOD, it looks like there's accumulation too.

 The 5 min chart is now looking pretty decent, not as strong as financials though.

 Financials have seen the same sort of divergence today as most of the averages and the SPY in particular

 The 5 min chart looks pretty strong.

It has now leaked to the 10 min chart.

If I had to guess, I'd say there will be a strong gap up tomorrow that will take recent shorts out.

A strong finish today would be more toward betting longs interested, but it looks like that may not be the plan.

Market Update

This is getting interesting...

With the pressure on the market from the $USD (above the Euro is sinking), it's amazing the market has been able to even hold laterally, but remember what happens in flat markets...

Their answer to combat the $USD and the Beige book, kick in some more resources...


 Look at that DIA leading positive divergence today. This is looking like it's going to be grand-finally bounce.

 The IWM, today's positive 1 min divergence is stronger then yesterday's

 I think I would say the same of the QQQ 2 min

 And now the QQQ 5 min is even moving toward a leading positive position.

 SPY 1 min leading positive starting after 12 pm

Look at the 5 min.

It seems to me they are going to get this bounce off and it is looking like it will be more spectacular then it did yesterday.

PCLN Trade (short)

PCLN is on my short list, excuse the pun.


 One of the last events before a reversal, the head fake move and a nice one in PCLN, a break above resistance and shut the door quick. I'll be looking for a little strength here to enter.

 1 min divergence on the move lower...

 2 min positive...

 5 min positive. So this should be enough to get PCLN to bounce.

 Long term, 30 min leading negative divergence.

60 min leading negative divergence.

PCLN is set up for a fall, a little price strength would be welcome to short in to.

F_E_D's Biege Book an additional anchor

The highlights from the 2 p.m. release of the F_E_D's beige book is going to take the wind out of the 'QE Hopefuls" sails. In effect, while not saying it, the bottom line is the Beige book was not helpful to the liquidity/QE cause as the F_E_D sees the economy expanding at a modest pace (so why should they ease?) and gas prices are seen as a drag on manufacturing (QE drives up commodity prices, just what they don't want if manufacturing is feeling a margin squeeze).

So we'll see what Wall Street does to get this move off the ground, but the macro climate is getting worse and worse for the market.

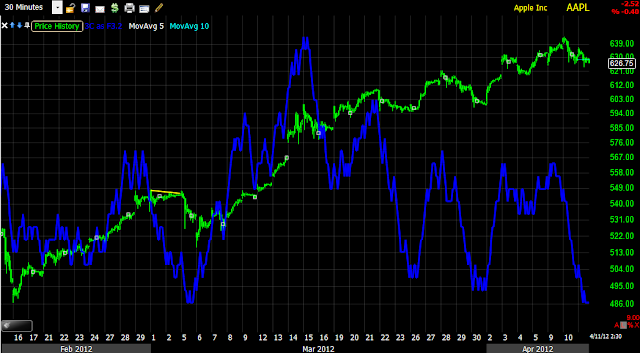
AAPL Update

AAPL is down -.38% vs the SPY at +.91%, which is wieghing on the NASDAQ 100 (yesterday this looked to be among the weakest of the bounce candidates-this also happened on the last bounce that started on a Friday, the SPX and Dow moved, the NASDAQ didn't at least until Monday when it outperformed).

Basically though, thi is the gut feeling I had, AAPL underperformance, there's a reason for it.

Yesterday in my 3 Pillars post, I said it looked like financials would lead the bounce, financials are up +1.87%, Tech +.68% and Energy +.41%

However, I believe to get the market moving, they'll need AAPL and smart money doesn't want to sell AAPL in to weakness nor short it in to weakness, so I fully expect that AAPL will make a move higher, it needs to, but thus far the early weakness is encouraging. I think they probably unloaded as much AAPL as they could today without driving prices too far against them. I'll be looking to re-establish a new position in AAPL in May or maybe June Puts after having closed April Puts yesterday at a small profit as the time decay factor for the move I'm after in AAPL was working against the trade.


 AAPL broke some nearby support today, I would think if they (smart money-it's always they or them against us!) let AAPL go any further, there would be no advantage in it without the market being in sync with a drop in AAPL, so I'm looking for AAPL to try to pull its act together, but at the same time I'm glad to see my gut feeling was right "AAPL will underperform the market". It has done that, now there may be some rotation.

 Here's the break on a 5 min chart, I show you because this is a common theme, a trend down and a break of support with a bullish candle ( a hammer and Harami in this instance with a bullish engulfing candle after for confirmation) and large volume, this is almost always an intraday and often a reversal on daily charts as well. In fact it even works for multi-day charts and works in a move down like this or the opposite, a move up. Think of this as mini-capitulation, in the opposite, a break above resistance with a bearish candle and high volume, think of that as mini-churning.

 And we see the start of an intraday positive divergence after the break on a 1 min chart.

 We have the same on a 2 min chart. So these are the tactical timeframes, note I haven't started any short trades yet, nor closed the bullish USO trade, I'm being patient and waiting for a better move up, although it is nerve racking.

 Strategically, the 30 min above and 60 min chart below are very negative for AAPL, this is the reason I want to be short AAPL, but I want to do that in to some price strength.


Actually I'm quite impressed, for the first time in AAPL's recent uptrend, even the daily chart has now gone negative and that takes a lot.


Market Update

Do you remember why yesterday before the positive divergences for a bounce even started, why I expected to see them?

Our experience has shown major breaks of important support almost always see a volatility shakeout and volatility has grown even stronger which would imply a stronger bounce. Divergences for a bounce formed shortly after I explained why I would expect to see such a move. For this to be worthwhile for the market, the shakeout MUST be strong enough to scare new shorts out of their positions and encourage longs to buy, this is why I said yesterday, "Don't let your emotions throw you off the scent".

The dollar remains fairly strong thus far, this is not helpful for a bounce...
 Here's the Euro (red/SPY green), still down, meaning the $USD is up.


 In red, here's the $USD still fairly strong, this means smart money is going to have to give the market a boost.

 On a 1 min 3C chart of DIA, there's the intraday accumulation they'll need to push the market up, being the dollar is acting as a drag.

 ES has recovered above VWAP and as I hoped to see, 3C is still in a persistent leading negative divergence, the same as the last two failed bounces. This should keep up throughout a move higher and is good for our plans.

 The IWM intraday chart showing a positive divergence, again, they need to push the market through the dollar strength to keep the bounce moving.

 Here's the same in the Q's

 And the SPY

So they need to make a midstream adjustment due to the dollar, but this should get the market moving up again. Remember, this bounce is here for 1 reason, to scare shorts out and to bring longs back in.


USO Update

My USO calls are now just above a 10% gain, I'll be holding them a bit longer although 10% isn't anything to sneeze at for several days of trade.

By now you are probably grasping my use of options; when I was trading full time for a living with no back up income, I got hooked on options through some very big gains, I traded them just like the majority of retail trades them and eventually lost an account. Options are set up to take your money, from the moment you enter an options trade you have the premium working against you, you have time decay working against you and you have the expiration which as we have seen numerous times, always seems to get pinned putting you at a loss on expiration. So I now use options for extra leverage in a trade set up that I like, but may otherwise not be worth the risk:reward ratio in a pure equity long position. For instance, USO is up 1.5% today, not bad, but not 10% either. I want to get out of my options trade as soon as I can to avoid losing on the time decay and I prefer to NEVER hold them through expiration. I often pay up and go out a month or so further then most and I often pay up and buy slightly in the money. I don't have statistics to validate that strategy, but considering about 90% of options will expire worthless, thus far it's worked out pretty well for me in what has been an otherwise very choppy and very volatile market over the last month or so. One other nice thing about options is you can define your risk. My positions (you may have noticed by the close out position I post) are generally about 5% of portfolio value before margin. If I'm looking at what I believe will be a longer term trade, I'll go out maybe 2 months (depending on where we are compared to the next expiration) and in those cases, I'll generally have my largest position at 10% of portfolio, which I consider to be pretty aggressive. Again, I want to close the position as quickly as I can once I get the gain under my belt and then reposition the next contract on a countertrend move.

In any case, here's USO as of now. To be honest, the EIA report this morning showed a slight build, not as big as last week's, but it wasn't a draw. It seems to me that USO is moving because an accumulation cycle was set in to motion and smart money rarely takes a position and then lets it fail, so my guess is USO is not moving so much on the EIA report, although I still do not know what market consensus was (perhaps the 2 mm build was below consensus).


 Since the last update, USO has broken out of the triangle I mentioned, it is now close to some resistance, I don't expect all of the potential gains to come in 1 day so a consolidation in the area wouldn't surprise me and probably wouldn't cause me to close the position that was set up days before the USO move based on the 3C charts.

 The 15 min chart is impressive and has the potential for some decent gains in USO.

 Thus far the 5 min chart is exactly in line (confirmation of the move up), not only on an intraday basis, but relative compared to 3C's position to the left relative to price's relative position at about the same level.

 Short term 1 min shows a little bit of a negative divergence, I would suspect this will be the basis for a consolidation, but again, 1 min charts can shift rather quickly, but for now, that's my working theory.

As to the target, I would expect USO to easily break above the first resistance level, although we may see some consolidation before that happens. The second yellow area would be what I would expect as a minimum target and knowing how the market is pendulum-like, swinging further then anticipated both ways, a move above the red trendline wouldn't surprise me either.

XOM Follow Up

XOM was a trade idea (short) that I covered in some detail on March 24th, it is down somewhere around 5% since then, however it is the longer term that makes XOM attractive as a large double top that looks pretty ripe for a break. Since I covered XOM in great detail on the 24th (linked above), I'll just touch on the macro situation and concentrate a bit more on the tactical situation.


 The gist of the idea was that these two H&S tops in XOM are part of a larger double top, the pattern implied target for a double top in XOM (of course this would be a longer term trend) would be around $45.

 This is the most recent H&S top, which I believe is the second top of a larger double top, it broke support yesterday, which means we would expect to see a volatility shakeout to the upside.

 The daily MS chart appears to agree this is a double top.

 The longer term charts can be found in the original post, it is the shorter term tactical entry that I'm more concerned with. I don't know that XOM will be able to post a severe shakeout to the upside being the market accumulation for a bounce wasn't huge. Or in other words, after the market bounce which we first expected yesterday and then saw it setting up as the day went on, I'd think XOM would have trouble moving up against the market's move down once the bounce is complete. In the near term, although XOM is just below the neckline, the short term charts suggest the volatility shakeout move as you can see the positive divergence here on  2 min chart and below on a 1 min chart.


At this point the best I can do is guess as to the probable target and the area in which I would like to look at XOM for a short entry, I'm thinking around $84.50, although we'll have to let the market tell us and 3C to confirm the best entry point, but for now, I'll be setting alerts for price in this area to take a look at XOM and see if the short term charts reverse to distribution on the move.

I suppose if you are a longer term trader and don't mind sitting through some volatility, you might consider phasing in to XOM. When phasing in, I prefer a 3 step phase in period. I might consider adding 1/3 or 1/4 of the intended position here, that gives some coverage in case XOM turns violently down. The next 1/3 or 25% I would be looking to add in the target area or perhaps above if we can get it, at this point I would want to see some 3C distribution taking place. The last portion I would add when XOM shows me that it is breaking below the neckline again just below $83. There are several variations of this phasing in theme, if there's a decent shakeout move higher then the target area and 3C is VERY negative, I might consider adding the rest of the position there, that method gives you  a little better risk profile as a stop can be placed closer to the bulk of the entry.

I would set some price alerts if you are interested in XOM and feel free to contact me for 3C updates.