In any case, Don had been around the block since the 1950's and I respected his nightly Worden Report so I went ahed and bought two of his books, they are paper cover, nothing special to look at, certainly never became iconic and I recall reading them and being infuriated.
Many of the basic principles of Technical Analysis that have been in use for 100 years in many cases were lambasted, it was if this creator of some of the best charting software I had used for Technical Analysis was TOTALLY Against technical analysis. I really felt ripped off and didn't understand how you could create Technical Software and write some of the things he wrote, for instance...
"Predicting future price movement from past price movement alone is a lot harder than most technicians like to admit-even to themselves"
"Good research is not enough to beat the market, you must be contrary"
"To make extraordinary gains, your opinions must be both valid and different"
I admit these don't seem that offensive, but when you are dedicated to technical analysis and you read both books, it seemed he was saying, "Everything else that everyone else is doing is useless", but everyone else was following the same principles of Technical Analysis, tried and true!
It was only years later after witnessing 3C and learning lessons and having to re-learn what I thought I knew about the market did these books not only start to make sense, but he was giving golden advice that I had missed for years. "Thinking different from the crowd", "Simple price movement has little predictive value", "Patience", being "Truly honest about your analysis, even if it doesn't make sense or fit conventional wisdom", "Conviction", "Probabilities eventually fall in to place on their own".
Many of these same principles have been spoken of by legendary traders, however through the prism of Technical analysis dogma, they tended to be the least interesting, passing notes.
Then there were very common sense things that are so common, we easily pass them by: "The longer a trend persists, the closer it is to its end", "As the facts fall together, the solution takes care of itself".
In any case, the late D.W. who was one of the first to think for himself in creating a whole new breed of indicators wasn't one to toe the line, he spoke his heart, he didn't care if his books were top 100 TA books, he offered wisdom and it was up to you to pick and chose what you wanted, but what a difference 5 or 6 years makes when reading the same material.
In any case, last week we talked about accumulation Tuesday and what it was for, the opinion was Dow $16k, SPX 1800 and NDX Comp 4000 with the NDX being the only one to miss.
I thought back to some past bubbles like real estate and friends who were home school housewives turned speculator in real estate and the frenzy it whipped up and the results they are still living with today like an anchor around their necks. I have been seeing a lot of articles lately about mass greed, traders and others reaching for the highest yield, traders using record margin....SPX vs NYSE Debt Margin
"Margin debt amounted to $379.5 billion in the month of March. The highest margin debt amount previously was $381.4 billion back in July 2007. That means the amount of money people are borrowing to buy stocks are now back at pre-2008 levels."
In September, the NYSE margin debt level reached a record-breaking $401.2 billion.
Individuals are actually writing SUBPRIME LOANS THEMSELVES! In market circles it has been called, "THE REACH FOR YIELD" and although there are a lot of good reasons for even a failed move above the psychologically important "Headline Grabbing" numbers of last week (except the COMP which is only 9 point or about 0.20% away) I was sent some data by a member...
Equity Mutual Funds (pure retail) saw an inflow of $7.2 billion last week, the 8th best week in all of 2013 and the 4th consecutive week above $7bn when the average for 2013 is $3.1bn which is a reversal of 2012's average of -$3 billion in outflows.
We aren't talking hedge funds or more sophisticated investors, we are talking "MUTUAL FUNDS".
For the same week (last) Fixed income saw a drop of $7.5 billion from bond funds, do you see what's going on?
The same week Equity Mutual funds post a huge $7.2 billion gain, fixed income (the safer play in most people's view) saw a -7.3 billion outflow, almost exactly the same and remember these are mutual fund flows, the retail of retail.
The point is, the reach for yield is now an "Everyday Joe" phenomena, or what you might call "mass greed" which is exactly what the VIX has been reflecting.

Thinking about all of these +.10% "New SPX High" headlines on horrible breadth, horrible volume, a 1/10th of a percent gain with the averages moving in different directions, I thanked the member for sending the information and something just popped in to my head given the $16k, 1800 and 4000 numbers this week which I shared with the member who sent me the flow of funds for last week.
First I thought about what I always say, "Wall Street doesn't do anything without a reason" and those levels are pretty good reasons, not for the 1/2 a percent gain, but for the psychological frenzy they create, then of course the data sent and all I could think about was one of my best friends who jumped in to silver and gold right at the end.
You may recall the story, I had told him to be careful, the markets were bubbly and he dismissed it, this is the same friend who had told me that I should invest in flipping real estate in 2007 and that "It's different this time" because there's no where left to build in Florida without going in to the Everglades.
However what I really thought of was my first several years in the market around the dot.com event and the two of us driving home from work together when over the radio the news said the Dow had a +600 point day!
I remember my friend suddenly becoming very interested in what I was doing with the market and wanted in, he even told me "The difference between us and the rich is that the rich invest their money". I don't recall the exact month, but I do recall he made something like 18% in HGSI which sold him even more and I was glad to have a buddy interested in the same thing as I was, but it didn't take long and March of 2000 was upon us, the bubbles burst and the market fell like few had seen in their lifetimes.
THIS IS WHAT THIS FLOW OF FUNDS REMINDED ME OF, ESPECIALLY WITH THE MEDIA MAGNETIC 160000, 18000 AND 4000 IN THE MAJOR AVERAGES. It makes me think of some of Don's wisdom which I'll probably post more of in the weeks ahead.
In any case, last week I had spoken about one of my favorite types of analysis because it's hard fact, "Market Breadth".
I looked at a few different indicators and compared them to when the markets broke in 2007, that was around June/July in which it had become really obvious in indicators if you looked in the right place, October was the real break most people would note.
So a few of my favorite breadth indicators and where they stand as to where they stood in 2007, because they did warn, just few people know about them.
This is what the SPX looked like back then before the banking trouble really began.


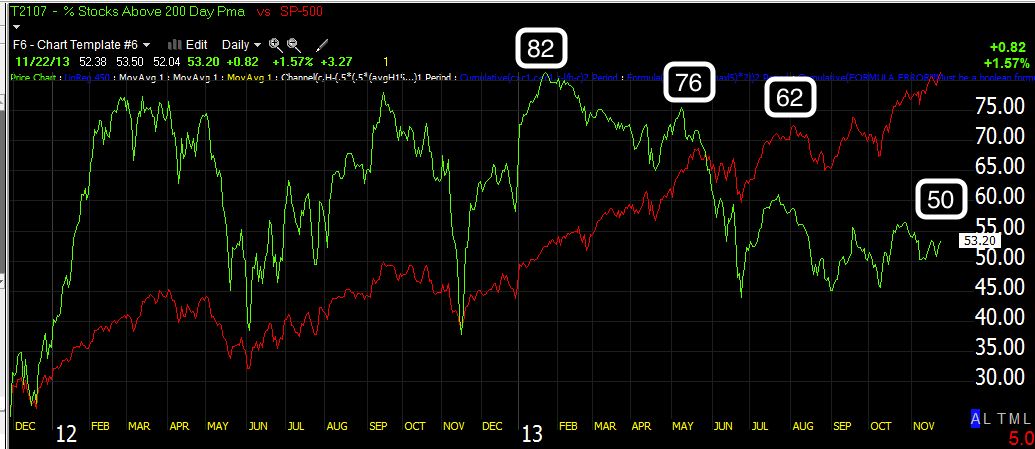
You can see breadth falling apart in 2010, 82% to 76% to what is now 50%, back in 2007 it was 86% in February, 62% in June and 29% in July, it bounced back to 60% at the October top.

We've gone from 85% to 56% at recent highs, in 2007 59% in April at the highs, 50% in June, 37% in July

In 2007 59$ in April at the highs (all measured at the reaction highs), 50% in June and 33% at the October high.

Here we see nearly a 2/3rd decline, in 2007, 40% in April, 38% in July and 33% in October at the final high, we are now at 15% of NYSE stocks are 2 SDs above their 40-day moving average.
.
I found the look back interesting as I have known about the 2013 decay for some time, late I'll look back at 2000.
Further reading this weekend brought me to the Bureau of Labor Statistics JOLTS survey with an addendum (the 4th chart down) called the Bevridge Curve which is the number of Job Openings, vs the Unemployment Rate.
You can see the chart on the linked page, the 4th chart down. At this level, this would indicate a 5.5% unemployment rate, which would not only be more than enough to end QE (not just taper), but to raise rates, the thing the market fears the most, but according to the data, the job openings are there to bring us to 5.5% right now!
We've seen over $5 billion dollar POMO days and the market close red recently, we've seen a number of market levitating manipulations fail, I even wrote an article last weekend called, "Is Qe Losing its Luster?"
For now, here's what we have this holiday shortened week...

I'm going to look in on futures later tonight, they look a little frothy and it's early.


Interestingly...
As futures on the 1 min chart above were starting to fail, guess what got smacked down?

While that got the carry pairs moving, it didn't do much for Index futures so far...


