Friday, March 11, 2011

EOD Market Update

We are seeing a little distribution into that last price spike, I think there are some traders closing out positions before the weekend. As of now, I expect to see some early strength Monday, that may be it, it'll be difficult to say until we get there, but the distribution cycle isn't that heavy yet that I would say we are topped out for upside potential. This would put us close to our target and set up some good risk:reward positions with higher probabilities.

All in all, I'm happy with today's action as it confirms what we saw yesterday and expected for today. I think we are on the right path here-right behind smart money's footsteps.

USO still has some downside from what I see, this was expected. I do not expect that USO is done, I think there will be an opportunity to pick up shares on the cheap and rise them to new highs as MENA heats up again next week.

The Euro zone will be in the spotlight again next week, so despite today's dollar weakness, I think there are going to be some opportunities there as well.

Our inverse ETFs that we like so much should also be providing some excellent entries. Nothing has changed very much.

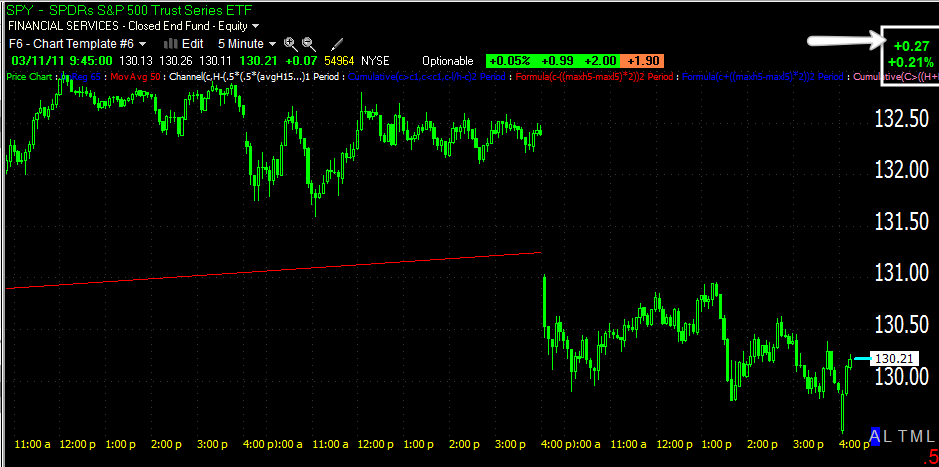
Yesterday al the talk was of the 55 day moving average being broken and how that was it for the market. I think yesterday and today's analysis just goes to show that you just can't be lazy and expect the things from the past to work under new market dynamics. It's about adjusting to the market, the market isn't coming to you.

In the near future, there will probably be some big adjustments that need to be made and judging by what I've seen on some very professional websites, it seems they still don't get it, they still haven't even caught up to what the HFTs were doing 3 months ago. I can't see how they'll survive the dynamics of an undermined market liquidity structure. As they say, "the early bird gets the worm." Just keep your mind open to new concepts and new ways of looking at the market. Study what you have seen and try to make sense of the accumulation / distribution cycle and how we can use that to forecast and get in early on good positions.

Most of all, make this your own. Think outside of the box or the book as it is, you can't do any worse then some of these high-end, popular websites that are spewing the same methodologies that were used in 1995.

Everyone have a great weekend. I'll try to get a more comprehensive post together for everyone. My brother is getting out of the hospital right now so I'm going to go over and see what I can do to help. Take Care!

More Market Insight

The strength we are seeing in the market today makes me feel better about my "Crazy Ivan" Theory or at least shorting near the apex of the triangle pattern. Take a look at this SPY chart.
The formation in price is similar or is an inverted H&S base, although small because this is a 5 min chart, the implied target suggests a move to the $132.50-like I said, despite seeing some distribution, that's only the start of the cycle, it will run until they have distributed all of the shares accumulated which I showed you in the market update and then maybe some as they may chose to also go short after distribution is complete. So today's price action is very much in line with what I was expecting yesterday before the close and the Price/Volume relationship yesterday was heavily biased at close down/volume up which for the fourth time in a little over a week has created a 1-day oversold/overbought condition. This would be the 4th one in this volatile lateral environment that has been called correctly, 4 for 4. So despite Japan and my feeling based on other world markets that it was going to ruin our analysis of what is going on tactically (from smart money's perspective), it seems we are very much still on track which is a welcome development.

Precious Metals Update

As you'll note, GLD is a much bigger top then the potential top in SLV, therefore, the breakout served as the false move and it is subject to less manipulation/volatility in my opinion.

The 10 min 3C chart is the first that really shows accumulation in GLD right after a minor capitulation event (where volume is large and red in the square). 

The 30 min chart shows the bigger picture despite today's recovery of the gap. It's approaching the triangle apex and that's an area where I'd watch for a reversal.

The 5 min chart is showing that a distribution cycle seems to be underway, that doesn't mean GLD can't climb higher to the target area I mentioned. A target just above the apex of that triangle would be most likely in my opinion.

SLV 
SLV's 30 min chart (the bigger picture) doesn't look as bad as GLD's, however, that doesn't mean this isn't a potential top. You have to remember how big GLD's pattern was, this is really the first price peak, whereas GLD had about 4. I think SLV will probably be settled one way or the other a bit quicker then GLD and it still isn't clear whether the downside in SLV is part of a correction or the failure of the breakout. There are some hints that the breakout has failed. For instance, I'd expect a little longer pullback in a normal, healthy correction, this seems to be more of a "top" volatility move meant to shake out traders.


SLV's 5 min shows both accumulation and a VERY recent negative divergence starting to form, so once again, this divergence does not mean that SLV won't move higher. It takes time to distribute accumulated shares without riving price down and even more time to do it into higher prices which is the ultimate goal of distribution.

The 1 min chart here is confirming what we are seeing on the 5 min, it looks a lot worse on the 1 min, but remember, this is where a new distributive move will start and if it is heavy enough, it will creep into the longer, more important time frames. At the 15 min chart we are usually close to a reversal.

As mentioned before, the "possible top" in SLV is not nearly as mature as GLD's, therefore it's subject to more volatility. Today's move would make institutional traders a lot of money as shorts would have piled in early on the downside gap, the higher SLV moves, the more the shorts are squeezed, the more the shorts are squeezed, the higher SLV moves. This is the snowball effect and it is the exact reason that institutional money sets up these false breakouts, especially in a chart like SLV where there are two thing 1) traders that are very committed to the idea of higher or lower silver, despite what the charts may say. This is almost a cultural phenomena and 2) confusion about whether this is a top or not. For instance, if this truly is a top, longs (not having anyway of knowing it's a top) would aggressively buy SLV on a recovery from a downside gap as we saw today. That kind of commitment is what allows the locals to set these volatility traps.

Market Update

Interestingly, this is the action I expected to see yesterday. Seeing how world markets reacted to the tragedy in Japan, who would have thought it. Perhaps there's some life to my original theory. There's some QE3 rumors floating, but nothing concrete, nothing out of the Fed or Pimco so I'm not sure that i what is causing this. Whatever it is, so far so good. I'd use the strength to short into (we're talking about the difference between strategic and tactical here). There are some negative divergences taking shape on the 1 min chart, but what I'm more concerned with is how this market closes.

Chart Request-RDWR


5-day chart showing a rounding bottom, the recent "consolidation" is completely wrong, even though volume is right. A consolidation that is formed in a parallelogram should always consolidate against the prevailing trend, which means the trendlines of the consolidation should be slanted down. Anytime they are not (as we see here) , it's a warning sign.

weekly 3C chart shows accumulation into the rounding bottom as you'd expect to see, the recent action looks like distribution. 

30 min chart shows a negative divergence followed by some accumulation and a run up on conspicuous volume, it looks like an advertisement to retail traders to buy the stock-guess whose selling to them?

The 15 min chart confirms the above chart

On the 10 min chart, a bearish wedge takes shape, there's several days of extreme volatility marked by the small red arrows, typically seen near tops. 3C is in a negative divergence as well.

And the 5 min chart confirms the same.

I'm not sure if we are looking at a deep correction or a reversal, but I wouldn't be a buyer here, there just isn't an edge and there are too many questionable looking charts.

Had a Feeling About That Triangle

Here are the 3C charts

DIA 1 min positive divergence

IWM 1 min positive divergence

QQQQ 1 min positive and leading divergence

SPY 1 min positive divergence.

Here's the SPY daily chart, the Crazy Ivan idea from yesterday was a downside breakdown and then and upside false breakout around the red box. In light of circumstances and because there's not a huge gap between the two areas, I personally would be interested more in adding shorts in the white area (on strength)-if we get up to the red area, you can always add more. A confirmed reversal or price breakdown is where you want to fill out the position, until then I'd personally keep the positions at about 50% of my total intended size, even if that means I add 10% right now, 20% in the white zone and another 20% in the red zone-that's my 50% of intended position size. I'd add the rest on strong confirmation of a downside move, now I've covered my bases and I don't have to much risk on the table and I also have a good amount of free cash to work with.

We have to adapt to the changing conditions in the market and even though I personally would rather formulate a big picture plan, things like Japan and what's going on in MENA, you just can't account for, therefore you must adapt, those that don't evolve, die in the market.

Now on a personal note, last time I asked, I only had 1 response. This is a painting I'm working on and I want to know if anyone can understand what it is, or if I should just put the paint brush down ;)

Remember, it's not finished.... :(

Goog Swing Trade Follow up

This was posted on the 4th at $600.91 as a swing trade, it's traded perfectly.

Take a look at the Trend Channel and if you are still in the trade, pay attention to the current Trend channel stop

18 points are already locked in!

On the 30 min TC, if you want a tighter stop, then over 21 points will be locked in.

Watch this triangle

Any observations will be important, head fakes, lack of them, a break and then strength, a break with no strength, all of these will tell us more about the character of the market.

Here Comes Volatility

NYSE's OpenBook Ultra (the reason I tell you not to put orders in with your brokers as you are showing your cards to the locals) is having intermittent data feed problems. This isn't good for market stability and rarely results in a melt-up, more likely a melt down as traders who are not intermittently blind, will deleverage risk.

Here's openbook

Market Update

Right now there's 1 min accumulation in the IWM and DIA, SPY and Q's aren't confirming accumulation, but mostly in line with price.

The question remains whether HFTs have any control over the market anymore or not and even if they do, can they keep up with the news coming out. for this reason, I would conservatively continue to add to shorts you like or that are in good risk:reward:high probability positions. The first move down will be a big one, but there will be a few days of consolidation where you'll want to start loading up. It's always the first 10% or so that is the most dangerous and in most markets I largely sit this area out, and let others try to pick the exact tops, but I'm here to provide a service-I just want you to know that if you are not fully stocked and there's a big move down, you'll have plenty of chances.

Today was going to be a good day to see what the market has in the way of firepower, unfortunately the Japan situation has skewed the market from Asia to Europe. Any strength today would be a very solid signal, although after Japan, I wouldn't expect to see much.

The Japanese situation really hurts Europe and that can be seen this morning in the Credit Default Swaps for the European PIIGS hitting highs we haven't seen. It seems like Europe's hopes were washed away with the Japanese Tsunami. China has their own problems, but they also have their own agenda "Global Domination" (with a Dr. Evil accent). No really, they are looking to establish their currency as the reserve currency and may see an opportunity in Europe. This year could be interesting as old friends may find some new friends that aren't really our best friends.

For now, I'd keep an eye out for the trades you like (email me for confirmation) and make sure your risk management is wide for now. The great thing about shorting is that you can make more then 100% and you can use profits to pyramid up winning positions.

WOW

Despite stock markets across the world getting hammered on Japan, the SPY is acting exactly as I'd expect it to have as of last night thus far!

USO Target

3C got this one right on the head, from the long trade to the reversal and this being a commodity in flux with world events. Now, where is it going? I'm still bullish on oil in the long run, but I do think we do have more downside, it may not, actually it certainly will not be a straight line march down, we'll have bounces, but this is where I think it is going and 3C will let us know as we approach the area.

The white trendline is my target, of course world events could reshape that, but USO seems pretty well locked into its cycle. I'd say there's a 75% chance it his within a few percentage points of the target probably later next week.

JASO (short trade)

This one triggered yesterday, but today it's certainly broken support, this may be an area to add or initiate a position. I'd leave a little room on the upside to add in case of a bounce next week being this just broke a major support zone 6 months old.

Yesterday's Post

Premonition? The World is Officially Falling Apart

First, my prayers go out to the people of Japan.

Now, this is why I say, "have your toes wet in shorts", you just can't predict world events and the ones that will trigger more downside. As of the close yesterday, it looked like we'd see at least early strength this a.m. and the after hours market seemed to confirm it as it traded up. Overnight everything changed.

The interesting news is that the market is finally reacting to world events which is a major change in character, it didn't rect to Tunisia or Egypt. It barely reacted to Libya, it's reacting now.

The spreads on CDS in Europe are hitting all time highs, and why? Because Japan has been one of the two Asian countries buying their bonds, I'm pretty sure that they won't be anytime soon as all of their budget is going to go into rebuilding Japan, so the butterfly effect is going to hit Europe hard and at a time when Spain, the straw that will break the camel's back, is teetering on the brink.

My macro view has been consistently bearish, the Fed has been the only thing holding this market up, but something has changed there, either it's coming to an end, which Pimco seems to hint at, or it's just not being discounted by traders anymore as they start to unwind leverage with no QE3 on the horizon. One thing seems for sure, we are seeing a reversal in the market. Whether we see a Crazy Ivan in the days ahead or we don't, we are seeing a reversal. Don't get caught missing this move.

Don't panic either, you have time!