Wednesday, February 29, 2012

All in the P/V

I could tell you that volume today was higher than average (NYSE 1110 mln, vs. 794 mln avg; Nasdaq 2060 mln, vs. 1703 mln avg) or decliners outpaced advancers (NYSE 1018/1993 Nasdaq 644/1923).

However, just looking at the charts tells you something has changed.


 This large Dow volume in white was reversal volume, not in an uptrend.

 IWM

 NASDAQ 100

 SP-500

The Price / Volume relationships really tell the story, all dominant and all the second most bearish reading, Price Down/Volume Up.

Dow-30

NASDAQ 100

Only 21% of the total advanced today!


R2K
 About the same for the Russell

Sp-500
And the S&P

By the way, over the last 3 days, the Dow crossed above and below $13k 52 times! I would be remiss to not tell you that the Dow lost $13k today.

Inside Information -Treasuries...

Last night in the "Daily Wrap" I showed a few charts of TLT and said, 


"Here on the 15 min chart you can see accumulation sending TLT higher and a negative divergence that fits with the candlestick reversal above, so I'm looking for a pullback in treasuries, unless some event causes a flight to safety."


And that's exactly what happened today. I'm convinced that smart money was at work behind this negative divergence, but the reason remains unclear. This Wall Street Journal article covers some of the possible angles, plus the NY F_E_D conducted a reverse repo today, withdrawing liquidity from the market.


Whatever the cause, 3C caught it.


AAPL / XLK (Technology) Update

 Remember what I said about the close I was looking for in AAPL today? Well the closing candle is even better then it was earlier, a true Doji-Star which is a common reversal candle, especially when it gaps up. This pattern is very close to an "Evening Star Doji". I'm a little disappointed in the volume, it is high and that's good, but I was hoping for volume like we saw on the 15th (red), however it may be enough.

 Intraday you can see where a lot of the volume came from on a break in the afternoon, but break of what?

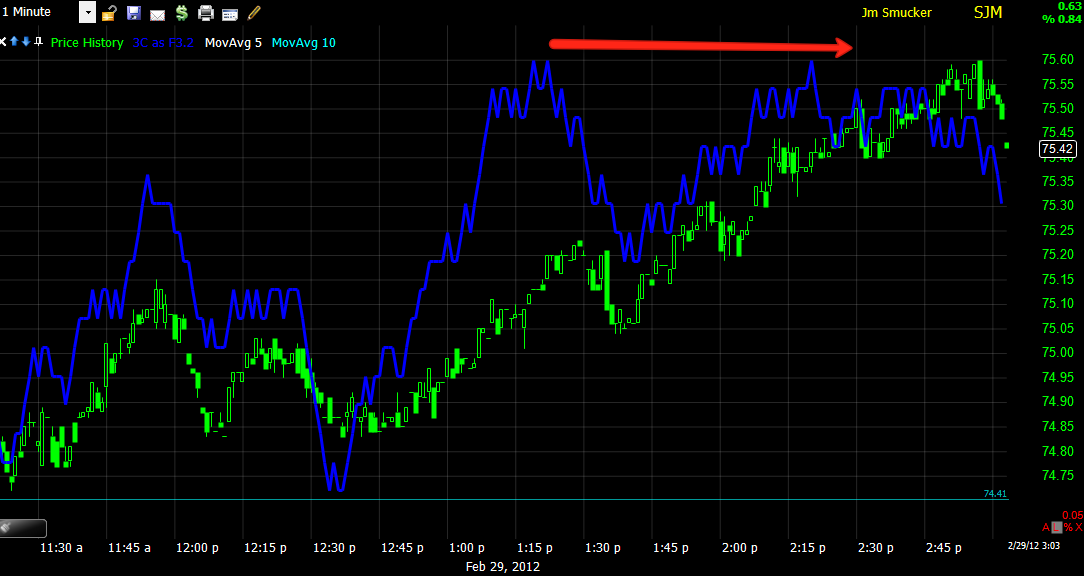
 As usual, the 50-bar 5 min moving average was the trigger, we saw a closing bounce in to that average that is now intraday resistance. The very last candle of the day shows that resistance as the upper wick crossed above the average, but couldn't hold.

 I won't update all the chart because you have seen them so many times, but the downside momentum in the 2 min chart is worth seeing. Note the end of day bounce was off support which was yesterday's close, this is not uncommon and isn't all that bullish, it's just part of the process.

The 5 min chart's momentum in leading negative is impressive.


XLK-Technology...
 In the red bow we have a "tweezers top" which is also likely churning as the volume was high and there was no price appreciation. The closing volume I would think was partly due to AAPL.

 This is my custom "buy/sell" indicator, the longer the timeframe, the more serious the signal, this is a monthly chart. We haven't had a sell signal since 2007 and you know what happened after that, well we have a sell signal now.

 MoneyStream not only called the 2011 top, but has remained leading negative through this entire rally, the same signals we are seeing in 3C just about everywhere we look. If it was in 1 average I might discount it, but in all of them and in major market stocks, it's hard to believe, but hard to discount. The implications of such a protracted and deep divergence are beyond anything I can imagine as I have never seen such a drastic negative divergence.

 XLK 2 min shows some problems around the 15th like AAPL, but of note is the downside leading negative momentum of the last 2 days.


 Even more impressive is the momentum in the 15 min chart, the divergence picked up steam as XLK hit intraday highs.

This 30 min leading move is today alone, this rarely happens and for it to happen, there's usually immense distribution.

We'll have to see if AAPL now puts in a confirmation candle for the reversal set up (sometimes there are 2 or 3 dojis stars in a row before a confirmation candle).


Drink, Drink, Drink and Drink

The Dow $13k Drinking Game...

Yesterday the Dow held $13k, today it lost it, but 1 thing did differentiate today from the 30 or so times the Dow has crossed above and below $13k.... VOLUME

 We saw big volume on the open and big volume on the close, that has been what has been missing from all of the crosses above and below $13k.

I encourage everyone to always keep the big picture in mind, it is easy to drive yourself nuts on day to day trade or even intraday trade, however, there was a flashing warning sign in momentum. Look at this gain of a measly +.69% over 18 trading days, or 1 day short of 4 weeks of trade.


AMAT Update

I featured AMAT as a funny business earnings post, after earnings, but thought it may make for a decent trade. A couple of members have picked it up, maybe more, so I will update it and mention that AIG had a very similar earnings scenario and may become a short trade candidate.

 AMAT was trending down before it made what I would call a definitive head fake.

 Here's a closer look, and I believe the earnings reaction was leaked and prepped by Wall Street as part of the head fake-DO NOT UNDERESTIMATE THE POWER OF A HEAD FAKE MOVE-I just closed GLD on a head fake for a 215% profit. The volume spike and the gap up that lost about 7% and closed in the red was after AMAT beat the night before, but had bad guidance the next day. Guidance is really just about all Wall Street cares about while the amateurs look for the EPS/Revenue beat or miss, Wall Street doesn't care what they did, or  only to the extent of comparing vs "what they will do moving forward" A head fake move can drop or rise (depending on the direction) very fast. In this scenario, a bunch of longs were trapped in AH buying on the earnings beat, the next day they were trapped with a lower close to the tune of a 7-10% 1 day loss. They hold out hope, but once the trendline is broken and their losses are bigger, they sell and add supply driving prices down even faster.


 This confirms the trendline as you can see volume on the break and an unsuccessful test of the trendline.

 The 5 min 3C chart shows distribution in to the gap up the morning after earnings.

 As does the 15 min chart, this is why I say that I believe Wall Street knew what guidance would be and set the trade up ahead of time, shorting at the high.

 The 30 min chart confirms the same, we see confirmation of the trend and then something changes.

 The longer term 60 min chart shows the same and then some.

AIG had a similar event ad although it has bounced from the earnings gap and loss of the gap, I think that day may have broken the back of the stock, similar to what I feel about AAPL on the 15h.

We'll keep n eye out for a trade in AIG as well as AAPL

Market Update

 DIA 1 min, maybe a slight positive divergence, hard to tell.

 The 2 min chart has deteriorated as I would expect.


 Even more so, the 5 min char is leading negative, weakness is building in with more momentum.

 The hourly is really looking bad here.

 QQQ 1 min, again, possible positive divergence.

 However, even if we get a bounce, the 15 min chart has gained downside momentum to an extreme.

 SPY 1 min is in line with price.

 So is the 2 min.

 The 15 min is leading negative

And although the trend since the orange arrow has all been in a leading negative environment, the recent leading negative in the red box is extreme for a 30 min chart so quickly.

 The only thing that is sticking out is a 1 min positive divergence in ES


 Again, even with a bounce, it looks like a lot of damage has been done today.

Updates on model portfolio positions:

I got in 2 trades,  SJM April $75 Puts and a smaller position in FXP with March $22 Calls


Trade Idea-FXP (Long)

This is a VERY speculative idea, so I would treat it as such if you like it. If I'm not mistaken, China reports PMI tomorrow (I need to double check, but pretty sure).

FXP is an inverse ETF which is an UltraShort the China 25.

 This is the FXP 60 min chart, I recently covered FXP and some changes in character that I like, this is certainly one of them.

 The 5 min chart is interesting as FXP was sent to a shakeout low and showed a positive divergence there-more on that in a minute.

 Here's the daily 3C, although some other versions show a strong positive divergence.

 The daily Bollinger Bands show FXP is likely to make a highly directional move, the Chinese PMI could be the catalyst.

 Daily Money Stream looks constructive and stochastics (long version) have been pinned, but are crossing up.

 Here's the consolidation that we see the 60 min positive divergence, note today broke below which looks to be a small shakeout.

This is that shakeout intraday so it did hit some orders and it has regained support.

I would look at this as a short term trade and speculative, if it develops in to something larger, then we cross that bridge at that time. My idea is to take a small options position, maybe March $22 Calls.

Remember, this is speculative.

AN SJM REMINDER

 SJM is very close to our target resistance of the 200 day, volume is declining.

 Intraday, it is early, but it looks like there's some negative price pressure building.

3C 1 min is starting to show a negative divergence.

"IF" I have time, I may put in a small Put position in the options MP on SJM here, if I have time.