Monday, May 7, 2012

ES Gap Fill or something more?

The market is murkier than ever. With last night's defeat of austerity meaures and rebuke of German policies, the Euro zone is like a super tanker with no one at the helm. Samaras had 3 days to form a pro-bailout government and gave up after not even a day, now it is the anti-bailout party's turn to see if they can cobble together a government. Nothing good will come out of Greece for the EU, maybe for Greece at some point, but not for the EU.

My take on the Greek elections was it caught the market off-guard, polling data seemed to give the ND/PASOK a win which would keep the status quo in place, the results shook all assumptions of the status quo and just about everything else EU related. By all rights the market should have crashed today, but as well know smart money doesn't want to sell in to weakness and today's move in ES perfectly closed the Sunday night gap. From one perspective the market looked a lot stronger than it should today, from another perspective, ES moved up just enough to allow smart money to exit their positions without taking a massive loss.

That's the heart of the matter, is the market showing more strength because it still ha some upside plans or was it simply allowing smart money to get out without a loss?

We didn't have the benefit of major European credit markets to look to today as the UK was closed on a 3-day weekend, tomorrow that will change and with it, probably many other things, although it is difficult to say where. There are very few times when smart money doesn't have an inside line in to events long before everyone else, these elections were one of those few times and it makes the market that much more unpredictable. In either case, we should be positioned correctly for the bigger picture, although it would be nice to get some additional strength to fill out positions.

3C/ES didn't look good at all today so that's one negative as ES is where a lot of the gap fill-selling would occur. I would maybe feel a bit different if ES had moved past the gap and closed strong, it didn't close especially weak, but it didn't close strong, suggesting to me that there were plenty of sellers as the gap was filled.

As for other indications and they are quite mixed...

 The EUR/USD HAD to move above $1.30 if there was any chance of the ES gap being filled. The question here is whether whoever has been defending the $1.30 level is still defending it or whether the algos where turned lose today to walk the EURO up to a level in which the ES gap would allow smart money to get out of dodge without taking a large loss? Unfortunately the Euro doesn't tell us much about this because the loss of momentum at the end of the day is typical of bullish market action as risk assets typically will consolidate before they try to break a major resistance level which is the gap. On the other hand, this could be a case of, "That's all that was needed to close the ES gap".

 Here's the Euro's Linear Regression channel today, you can see the loss of momentum clearly at the end of the day, however the reason could go either way.

 The market itself was just doing what the Euro was doing, so the question there too is the same, "A consolidation before an attempt to move higher or that was all that was needed?"

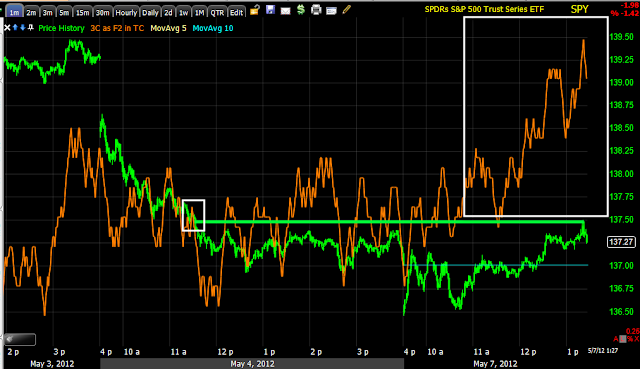
 The 1 min 3C charr on the SPY doesn't tell us anything either as it is near perfectly in line with price.


 The 5 min chart does look more bullish today, however that same 5 min bullish look is only found in the SPY, none of the other averages were able to keep pace with the SPY.

 The SPY 15 min chart looks rather bullish today as well. The QQQ, IWM and to a lesser degree, the DIA all look pretty good on the 15 min charts.

 QQQ 1 min is also nearly perfectly in line with price action, not giving any near term hints.

Here's the QQQ 15 min I mentioned above.

As for the near term charts in the other averages (1-3 min), the DIA was pretty close to in line with a slight bearish slant, the QQQ 2-3 min charts looked similar, only the IWM  was in line with a slight bullish slant.

I'm inclined to lean toward the 15 min charts, but the fact is the shorter term charts feed the longer term, so the shorter term charts should look better than they do.

As for AAPL

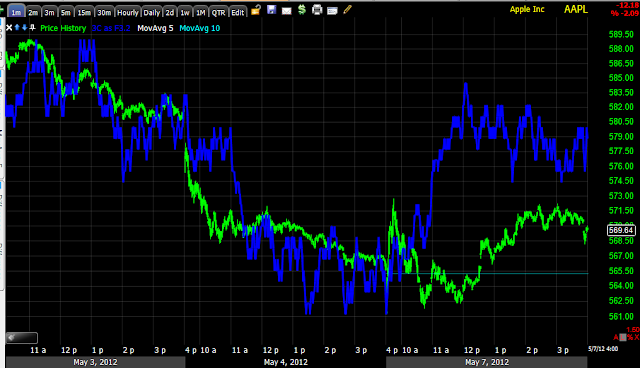
 The 1 min chart looks stronger today than Friday, although it did see some late day negativity creep in.

 The 2 min chart also looks better with some late day deterioration.

 The 3 min trend still looks good.

 At 5 mins there's a clear transition from an in line downtrend to a relative positive divergence that is actually probably leading a little here.


Again the 15 min chart, like many of the others, looks good, good enough for me to stay in the AAPL calls.

 The ES CONTEXT chart shows the model lower than ES, this would make sense if ES was being pushed to fill the gap, however in the last several risk on bounces, ES has led the model as well, so again there's not much to go on here. I would prefer to see the model higher than ES, that would tell us something.

 Interestingly commodities held up better at the end of day trade than the SPX, although I will say the SPX dipped a bit harder at the end of day than the Euro did, commodities stayed a bit higher than the Euro correlation.

 High Yield Credit does look supportive of higher prices, it is higher than it's recent range while the SPX has dipped.

 Here you can see the Euro top just before the SPX, this is likely what caused the SPX to dip at the end of the day. However the important question is why did the Euro dip? Because the ES gap was filled or because it is consolidating for a run above resistance at the gap from Sunday night?


 High Yield Corporate Credit looks much better today and the credit markets generally lead the equity market, there was some selling in the afternoon in HY Corp. Credit, but all in all, its position looks supportive of higher prices in the market.

 The one relative out-performer today was Financials which showed good momentum vs the SPX all day.


 Financials are in Green on this chart and the SPX red. Financials did dip as well, but all in all performed much better.

 Financials on the 2 min 3C chart looked good all day until the close when they went slightly negatively divergent, however it not uncommon for risk assets to move together directionally, even if the percentage gains are different (rotation). The longer term 3 and 5 min chart showed the selling a bit more pronounced which is again not normal. The 15 min chart is not as strong as some of the other 15 min charts, but it is positive.

I'm not one to punt on the question of the highest probabilities as for market direction both near and long term, you know my long term perspective or"Big picture perspective" as the long term trend may not be far away. However in the short term there are too many unanswered questions, too many very ambiguous actions like ES filling the gap and then pulling back. This action in itself normally would seem quite normal, after resistance is taken out, the asset takes a breather, consolidates and makes a new leg up. However being that the Greek elections left a big surprise gap down, the filling of the gap is all smart money would really be looking for with the uncertainty in Europe, a dip after that gap is filled in this situation could mean a lot more than it would normally imply.

In fact there were a lot of very small actions and results that could have dramatic effects, take the Greek vote for example, the Pro-Bailout parties only missed having an automatic coalition government by 2 or 3 seats, yet those few seats could have a dramatic impact on all of Europe.

I'll check currencies and ES again later tonight and see if there are any new clues that can help us determine near term direction, but if you have ben accumulating short positions over the last month or two as I have been doing, it won't really matter too much which way the market goes. If it goes straight down from here our shorts will perform well, if we get a decent bounce from here we will be able to add more short positions as the bigger picture looks to be pretty set in stone.


Did Someone Follow the ORCL Short Trade Idea?

ORCL was a short trade idea from the end of March (this link is a search for ORCL and as you'll see there were numerous updates on the trade at the end of March). This trade idea started in the middle of March, I haven't been able to read all the updates, but the March 22nd looks like a good one as it shows the March 20th post, what we were looking for to happen to enter and then 1 day later we got exactly what we wanted-LET THE TRADE COME TO YOU!

 This is the area where we wanted to see the trade move to so we could enter a short position on strength, but also a head fake move and where the trade is now. However, the trade has a lot more potential than this.

 On a weekly chart there's a preceding uptrend and then a large right angle triangle. Triangle's this big (see BIDU) are almost never consolidations and almost always either tops or bottoms depending on the preceding trend, with a preceding uptrend this would be considered a top. The price pattern implied target is around $14 or about half of where price is now.

 During March we were looking for signs of this counter trend flag-like rally to give us an entry signal. On March 20th in an update I wrote about the level of resistance at the yellow trendline specifically saying,

"ORCL is lingering at last support, so again, at important technical levels, the breaks are never as clean in the real world as they are in the T.A. books and seminars.

The 2 day Trend Channel does a good job in holding ORCL's moves, however, if they run a shakeout and this is just experience and gut, I have no evidence, then near the Trend Channel stop out (on a closing basis), there is a very juicy looking level of resistance, a break through that (at the yellow trendline) would almost certainly shakeout shorts. This is why I prefer wide stops on initial positions, it would be a shame to get booted from a good short on a shakeout move. Just be aware of the area and remember psychology, the market is about fear and greed, the more powerful a shakeout or head fake move, the more it moves emotions which for too many traders dictate decisions." 


This is an excellent head fake move, you can clearly see it was so obvious that it was predicted the day before. What made it obvious? First the flag-like uptrend had to end, second ORCL was starting to move toward breaking the channel, third the area of resistance was so well defined that traders in ORCL wold have set orders and stops there making it almost certain it would be hit. Remember when you place any kind of limit or stop order with your broker, everyone on Wall Street can see it, that is why I use market orders to execute the trade right away without giving Wall Street a head's up of my intensions, it may not matter in a big stock like ORCL, but in smaller stocks it does and when short term trading it does. The main point is so many traders using these orders would have made the area very obvious and an easy target for Wall St. to shakeout and trigger orders that would later be at a loss.


 We already knew that Money Stream had confirmed the distribution in the top pattern so entering the trade and managing it were all that were left to do.

 On the 30 min 3C chart every attempt to rally was distributed, the yellow box is that head fake move above.

 The 5 min chart shows the head fake move clearly, it's the price area sticking straight up, again, all price strength has been sold in to.

 Here's the most recent decline in ORCL on a clear negative divergence, there's also a relative positive divergence so if you missed the trade, it may come back to you allowing you to enter or add to it on some price strength.

Since ORCL is still technically in the top, it is very volatile, I would use at least this 5 day Trend Channel as a stop and maybe even give it some extra room. The bottom line is I wouldn't want to get stopped out of an excellent looking long term trade because I too too many shares with too tight of a stop. You can always add as the trade moves in your favor. For those of you who haven't already read my article from Trade-Guild.net (my free site), check this one out: How to Make More Than 100% in a Short


SPY Update

Seems to be a slow/steady build up in the SPY, which I will remind you was the only of the 4 major averages that did not have a positive 15 minute chart earlier today.

 SPY Daily chart, Friday's large volume "can" certainly be one of those high volume mini-capitulation days we see reversals from, although the market is becoming increasingly unpredictable-that has been the trend though. The daily close if it can maintain in this area could put in a bullish thrusting candlestick pattern which is a reversal pattern, much like its counterpart, the bearish dark cloud cover in the red box is a reversal candle.

 Looking at a 5 min chart with a 50 bar moving average (typical set up for day and swing traders) you can see the 50-bar has acted as resistance until recently as it flattened out, in yellow we see what could certainly (in the past I would assign a very high probability) be a shakeout move with the increased volume and new low. Now the 50 bar 5 min avg. is acting as support for the SPY, this is a recent and somewhat short term bullish change in character.

 The 1 min chart is largely in line with price-price /trend confirmation

 The 3 min chart shows an overall positive divergence (not marked), there is no negative divergence at the loss of momentum in the white box, I believe this is an FX arbitrage correlation, in any case, the SPY does look like it could consolidate here and when you see the FX charts you'll understand why.


 The 5 min chart has been improving all day, note how much bigger the leading positive divergence is today vs. Friday.

 Finally the SPY 15 min goes positive, this is a leading positive divergence  and a pretty good one for a day.

 I mentioned the SPY wan't showing much of a negative divergence as it has recently lost some momentum, I'm nearly certain it is because of the EUR/USD losing some momentum recently and it makes sense.

Looking at a longer chart of the same FX pair, the Euro is coming up on HEAVY resistance at the Friday/Sunday  gap. If the Euro is to move through this gap, a consolidation just below it makes perfect sense and the market doing the same makes perfect sense given its strong correlation with the Euro.

Overall today is a much stronger day than it should be considering the fundamentals. I would call today a tentative bullish success for near term trade and the possibility of that one last move higher I have theorized about.


USO, Great Example-Possible Trade

USO if nothing else is an excellent learning tool, it may also be a quick short term trade.

Members who have been around long enough to see this USO situation develop will probably remember the circumstances.

 During the period in white I was bearish on crude oil, the reason was this was the height of the Iranian/Middle East tension and news story after news story about Iranian War Games, Iran shutting down the Canal, etc did nothing to significantly move the price of oil, it seemed something bigger was concerning oil traders, perhaps global demand dropping off and conditions in China. In red we started to see lower highs/lower lows in USO, a downtrend and it was not unexpected. However in the yellow area USO took off on the same Iranian news stories that failed to move oil months earlier. I didn't buy this, again I believe it was just the financial media giving the masses a reason why the market did something. Instead I suspected the downtrend in oil was seeing a severe shakeout. Soon after we received confirmation of the likely shakeout move as oil started trending down again amidst deteriorating global economic conditions.

 Here's the downtrend that developed after the suspected upside shakeout. So we have what is likely a major strategic head fake move above and within this channel I suspected oil would make a head fake move above the very well defined channel. That head fake move came (yellow) which would be the opportune time to short oil. As I have often stated and we have recently seen in BIDU, "Failed moves lead to fast moves in the other direction". The head fake breakout of the channel was a failed move once it re-entered the channel with longs who bought the breakout at a loss, these losses cause more pain as oil moves lower and forces longs to sell creating a supply/demand imbalance that gives the downside even more momentum.  I would normally expect the pendulum effect to come in to play and USO to blow through the bottom of the channel, it may have been saved by today's move up in the Euro. In any case, the large volume on Friday likely shook out any remaining longs as it broke intraday below the bottom of the channel, this volume spike, clearing of longs and shorts entering leaves Friday as a high probability reversal area to the upside. Today's bullish hammer candle tends to support that view thus far,

 Here is 3C 60 min during the transition from oil not moving on bad news from the middle east to a downtrend, you can clearly see 3C was negative.

 Here is the head fake move to the left, note the white zone on this 30 min chart shows no significant accumulation, further suggesting a head fake move. Once USO reached the top of the move, distribution set in, there was an intraday head fake move higher or to a new high for this move and then USO started trending down. The trend down is captured at the red box around the dates. The very last head fake move above the downtrend channel is to the right in yellow, note the negative divergence identifying this as a false move.

 A closer look at the channel busting head fake upside move on a 15 min chart again shows strong distribution, the move to the bottom of the channel shows a small 15 min positive divergence forming.

A closer look at the recent move to the bottom of the channel with a 1 min chart shows a positive divergence forming.

While a VERY speculative long position could be taken (I think you would need some leverage to make it worthwhile, either options or a 2-3X leveraged Bull ETF), the trade that would be in better alignment with the major market trend unfolding would be to let the upside move take place and wait patiently for USO to come to you and short USO as it starts to turn negative or decline; this would be my favored trade unless USO gave some really strong positive signals.

So this is an example of a trade you can set some price alerts on the upside, let it come to you and enter a short trade at a better price with much less risk and in line with the market's overall bearish position.

If you are interested in this trade and need more information, just email me, but setting price alerts is the first step so you don't miss the opportunity.

Market Update and progression thus far...

I'd like to be able to take the time to load up the Risk Asset Layout and take a more detailed look at the market, maybe I'll try to do that although it's a bit time consuming.

There are some mixed signals, on the whole they are better than I would have expected for today. I have two guesses as to what is keeping the market from all out disaster today and they are probably related to some degree. We have had signals the last several days (although not VERY strong or clear) that the market may indeed not be finished with this shakeout move starting on April 10th. My expectations for this shakeout move are based partly on gut feeling (which is based on market behavior and recent trends) and several decent 3C signals, notably in AAPL, was for there to be one last volatility upside move and AAPL would have one last upside move. Admittedly the shakeout move has fulfilled all of the targets that were set so these extra two expectations are above and beyond what we expected as the minimum move that would be required to make such a shakeout worthwhile.

My two guesses as to why we may be seeing this relative strength in the market on a day that should otherwise be a bloodbath are probably related, 1) When Wall Street sets up a cycle (that would be starting April 10th) they rarely let it fail. If indeed this cycle is not finished, this concept of Wall Street protecting cycles they have set up in advance takes on a whole new meaning after the wicked fundamental events out of Europe last night and I will have a whole new appreciation for just how far Wall Street will go to protect their short term cycles. The second which I have mentioned many times recently is the defense of ER/USD $1.30. I have speculated on who is defending the Euro, perhaps the Bank of International Settlements, perhaps China in an effort to keep their exports to their number one trading partner affordable at a time when Chinese exports and manufacturing are sliding badly. The two concepts are either closely related or one is taking full advantage of the other (that would be Wall Street taking full advantage of any defense of the Euro as the Euro is a risk currency and it needs to be somewhat healthy for the market to move higher).

When this is all said and done, we may have uncovered a much deeper involvement by Wall Street in short term market manipulation and the lengths they will go to to protect investments as there is a certain amount of buying or accumulation needed to get the market primed to move higher before retail momentum chasers take over that responsibility and head faked shorts are squeezed also helping.

This should also make the concept of the head fake move and why they occur much clearer to you. Hopefully you will learn from it, be able to identify likely head fakes and instead of being a victim of them, use them to your advantage. There are more ways to assess a head fake move than just 3C alone, although I believe it is one of the best indicators for the job.


I'm encouraged by the market today after seeing yesterday's fundamental data. Logically the market ha no business being even in the vicinity of break-even on the day. As mentioned earlier, I don't believe for a second that positive German manufacturing data and a plan to bailout Spanish banks is behind the market's resiliency at all, although the financial media need to point to something as to not reveal the true reasons.

The SPY is near several zones of resistance, while they are weakened and older, they still apply, the yellow zone is gap resistance, even though it has largely been filled, the residual resistance is still there. The second zone at the red line appears to be a key level that has shifted from resistance to support back to resistance.


 AAPL this far today on the 1 min chart has shown the tendency I suspected in putting in positive divergences near the lower ends of the triangle's range, it went leading positive, there's been a slight negative as it has moved higher, but it is back on the move and first resistance will be at the $572 area (this morning's intraday highs).

 AAPL 3 min looks complicated, I only put the signals in for those who wish to study 3C more, all that really matters right now is the leading positive divergence in the white box over the last 2 days, it is gaining momentum.

 As you may recall in the first update, the DIA looked to be the weakest as far as underlying 3C action goes, it remains that way, a small negative divergence caused a consolidation, DIA has moved higher since, but still isn't looking very strong.

 IWM 1 min has a nice trend overall on the 1 min.

 The IWM 1 min looks to have been doing what I suspected, keeping the IWM in a range earlier today, lower price points saw positive divergences. The same negative divergence after  1 pm has caused a bit of a consolidation, I don't think it is quite done yet. Keep in mind there are plenty of local resistance levels and sometimes a consolidation is needed before those levels are targeted.

 IWM 3 min has less noise, more trend and today's trend is a new leading positive high for the last 2 days.

 QQQ 1 min has a decent start on a leading positive divergence as it moved out of the triangle.

 A closer view shows the same smaller 3C negative divergence, likely consolidative and probably not done yet.


 The 3 min with less noise has put in a nice positive leading divergence, the area marked is today only, note how it gains momentum after moving out of the triangle.

 The SPY may be the biggest winner thus farm the green line shows where 3C would be on standard price confirmation, it is leading significantly higher.

 When zooming in on the same chart, the SPY/3C are nearly identical, this is confirmation, yet there is still a leading positive component. There are initial signs of a consolidation, but nowhere near the other charts, SPY looks much better.


 The 5 min trend is really showing excellent momentum today.

The NYSE TICK chart is much more positive than I would have thought, I would have expected -1500 readings on the open, instead they stayed in a normal range of -1000 and there's a clear trend higher in the TICK chart with upside reading at +1250