Monday, February 6, 2012

Raining Cats and Dogs.

Here are the top 10 performing stocks today...
 This is one of the few, that while a C&D in price, at least has some decent volume, but... it rallied mostly with a ton of Cats and Dogs Biotechs, essentially Biotechs were moving today and even though this one has some volume, the price still makes it a speculative C&D stock as far as I'm concerned. The volume surge today was 828% of the normal 200 day average volume.

 This is a C&D because of its average 200 day volume of 105k shares, it saw a 8673% move in volume today.

 Another C&D on a 1804% volume surge, normally about 20k shares traded a day!

 A real C&D with a 1436% surge in volume, average daily volume of about 16k shares!

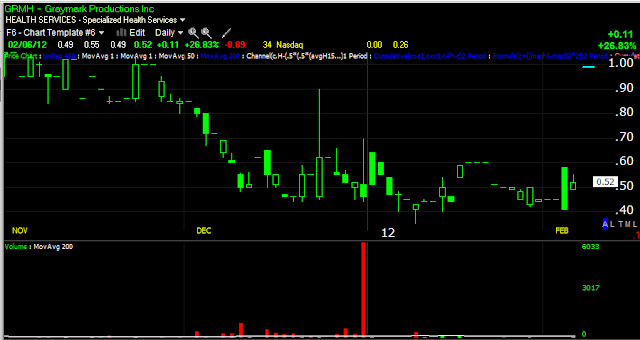
 This one rallied nearly 28% on 3400 shares total today

 How about this surge of 774%, average volume around 10k a day.

 A 28% gain on 200 shares!

 A C&D that trades about 330k shares on a 512% surge in volume 65k shares a day, makes it a C&D stock.

 The price may not look like a C&D, but the average volume of 65k, with a surge of 1417% today...

A 1684% surge in volume, normally around 80k a day.

Note that 5 of 10 were either biotechs or Ocean shippers.

I counted the top 150 performers today, there were 20 that were not Cats and dogs of the top 150, about 1/3 of those were shipping companies., followed by Biotechs and several other industries.

There were 222 stocks that gained more then 5% today, of that, 154 were Cats and Dogs. I stopped counting at 5% gain.

When looking at all stocks in the system and this doesn't include OTC/Pink Sheets, but stocks listed on the major exchanges, this is how today broke down:


1645 of 7224 gained between .01% and half of 1%
2568 of 7224 gained at least .01%
4656 of 7224 were either unchanged at 0% or at a loss

The theme today was clearly that the Cats and Dogs were rallying in a down market. As I mentioned earlier, in my past experience, when the Cats and Dogs rally, you're near the end of the move.

Trade Idea POT (short)

I like this one, it looks to be in a good spot for a more trending type trade.
 This one has been topping any way, so that's a good start, but then it broke below support, remember that we ALMOST ALWAYS see a volatility shakeout move after a major break of support now; it's not like days of past or some very popular technical analysis books which show a top breaking with a very small test of resistance that fails and that being the perfect place to short-times have changed. In white we see the volatility shake out. Then a move lower and a big bear flag. Now that the top has broken, the shakeout has occurred and we have a correction, giving us a lower risk entry, this looks like a pretty high probability/low risk trade. It's also liquid enough that you should be able to use options if you choose to.

 Here's a closer look at the bear flag, you can visually see it is starting to fail within the flag.

 With my custom "Close within the range" indicator which is set to 1 week, you can also see how the closes have switched from building bullish closes near the top of the day's range, to closes near the bottom or in the bottom 25% of the range, a bearish indication.

 Daily 3C calls out the top, from accumulation which was rather small, to confirmation to distribution, I would expect there is a strong institutional short presence in the stock just because the accumulation period was so small, so most of the distribution was probably selling short.

 The hourly chart shows the accumulation for that built the flag bounce and distribution since.

 The 15 min chart shows this more clearly.

My Trend Channel and the bottom support trendline are close to each other, I would prefer shorting this on a break of the Trend Channel, but a phased in entry also makes sense if you want to average your entry and risk.


My first target is around $37.

Deadlines come and go and are reset, but Sarkozy is getting close with Merkel again...

I guess you can't count on Greece to live up to anything. The emergency meeting (last week we talked about it, supposedly as "early as Thursday" as Greece hit a roadblock with the EU, yet the market rallied on news that a deal would be done in hours, only to be refuted) went on through Sunday night, no agreement in the Greek political coalition. The talks that were supposed to be taking place today, apparently are not, according to Jakarta Globe (at this point, there's no reason to believe Bloomberg has better information then the Jakarta Globe) which said,

"However a key meeting due to have been held Monday with heads of the Greek socialist, conservative and far-right parties which form Papademos' unwieldy coalition government was put back."


This as we also hear that Sarkozy, who defied Merkel and opposed Greek soveriegnty being stripped away, is now singing along with Merkel...


"In Paris, German Chancellor Angela Merkel and French President Nicolas Sarkozy ramped up pressure on Athens, as did the spokesman for a European commissioner in Brussels."


Apparently the new measure being tossed around is if Germany can't directly control Greece, then they will administer the bailout funds which is really the same effect as without the bailout fund, Greece is  broke. Perhaps this is more palatable to Sarkozy?


"Merkel warned that Greece would receive no more EU aid to cope with the debt crisis until Athens reached a deal with the EU, ECB and IMF 'troika' on more spending cuts and reforms.

The two leaders also floated the idea of placing part of Greece's future bailout loan funds in a special account to make sure it is channelled to service the country's enormous debt, currently exceeding 350 billion euros, and not for other uses.

"The Greeks gave us undertakings," Sarkozy added. "They should respect them scrupulously. There's no choice."

An EU spokesman also noted that "we are already past the deadline..."

So I guess Papademos won't be resigning today?

CONEXT Model is way out of line

Even with the market down today, CONTEXT is signaling that compared to risk assets, the market is rich to the model of where fair value for the SPX should be.

ES (S&P E-mini Futures) are trading at very high valuations today compared to the model (often the model and ES are in line), this would suggest there's a deep risk off/de-leveraging in risk assets.


Even the SPY arbitrage model shows the SPY rich to the model.

As for our indicators in Credit/Risk assets (the idea being when the market is optimistic and in a risk on mode, nearly all risk assets should be rallying and look similar to the SPX. A divergence between the two suggests that there's something not right with underlying trade as 3C and MoneyStream have been showing for a long time, longer and deeper then I have seen them ever before, which would suggest that there's a massive change going on in institutional trade while dumb money and momentum chasers follow the market higher, this is the behavior one would expect to see in a bear market rally as the break of a bear market rally is not spontaneous, but planned quite far in advance. As they say, what everyone can see and knows is not worth knowing. Remember that the market's job is to deceive the most amount of investors at any one time.

 Rates which tend to pull the market toward them as you can see in this longer term chart, rates topped before the SPX, rates were much more negatively divergent at the second July test before the market fell 18% and now they are more divergent then ever.

 I recently pointed out rates were making 10 year lows, they are now making lows that go back as far as my historical data can show, 1962.

 Even the Euro is trending down here, some would say the correlation is broken, I think that is a short sighted view. There certainly have been times during QE1/QE2 when the correlation did not hold, but that was due to the relentless investment of nearly risk free cash that primary dealers were making in QE2 POMO operations, they invested it in stocks or anything that had some yield, but mostly in heavily weighted index components as breadth indicators have shown, during that period, the averages were advancing without the participation of a strong majority of stocks, simply done by investing in the heavily weighted stocks, which I believe was a pre-condition for the F_E_D's POMO windfall profits the banks made as the Bernanke was very eager to point out what he called the "wealth effect" in congressional testimony, specifically talking about the gains in the Russell 2000 and how that made Americans wealthier! What a bunch of garbage.

 Longer term, you can see the Euro well correlated to the SPX in several periods, when it had a slight divergence (negative) during the 2011 top, it was leading and the market fell in late July. Right now there is a severe dislocation between the two, and this even after the selling of $USD denominated assets by European banks and buying Euros to repatriate captial to meet the EU ordered Bank Recapitalization.

 Here again, high yield credit, a huge market and a risk market refuses for the second day to be anywhere near the SPX. Friday's closing prices are at the white trendline for each.

As for sector rotation, just about everything is UNDERPERFORMING the SPX, which is itself down on the day. Financials are notably underperforming relative to the SPX, Energy is the only one really outperforming, what is interesting though is even the defensive sectors such as Utilities in red, Healthcare, Staples and to a lesser degree, Industrials are all underperforming relative to the SPX. I would think that Utilities would be outperforming with the SPX down. Could there just be across the board de-leveraging in most all equities?

USO Update

I believe the USO trade has been an example of "Sitting tight". Last week 3C indicated a bounce, which makes sense on the break of the major support trendline. Here are the updated charts/stops.

 USO's lateral toppy trade with an RSI negative divergence.

 Intraday, the break of the trendline and subsequent bounce.

 Since the accumulation for the run in October, USO has looked very bad on the longer term charts like this 60 min.

 The 15 min has largely been in line, but negative at just about every gap up, which have been great short entries.

 Here's the 5 min chart accumulation for the bounce from last week, it looks to be ending.

 The 2 min chart showing the same.

 And the 1 min chart since hitting resistance

 The X-over Screen also went short right at the perfect time with no false signals which usually plague flat ranges like this. The blue 22-day moving average is probably a decent stop although I would prefer a little more room at least initially.

 The daily Trend Channel as a stop should work pretty well, I would imagine it will also work well on a first leg down move, however after that it may need to be widened to allow for counter trend rallies, in that case the 2 day Trend Channel below would be a better choice for a longer term trade, although right now they are very similar. Unless USO acts like it did in 2008 after the July top, but even then the 2-day was still a slightly better choice for capturing the bulk of the move.

There's not much difference now between the 1 and 2 day, but in a trending environment...

Here's the difference between the 2 in the 2008 decline...
 1 -day with 2 stop outs...

The 2-day captured the entire trend. The extra standard deviation made a big difference and the stop isn't that much wider.

Greek PM orders a report on implications of a default...A Little Late

Just last week I said that Greece is close to becoming the first i\developed nation in 65 years to default and said in all seriousness, I doubt they have begun any planning for such an event.

I don't know why the EU is always so far behind the ball in every aspect? When I was managing our family cafe and the season was getting rough as Florida and especially Boca Raton are exceptionally seasonal (Feast and Famine), I always had a plan of what our inventory was worth at current market value, where I could sell it quickly if need be, what the tax implications would be for the owners, etc. I wasn't planning to fail, but simply making sure I knew where we stood if things got out of control quickly.

So when I said last week I doubt the Euro-zone had done the math of what a disorganized default would look like, imagine my surprise finding out that Greece itself hasn't done the math yet and just ordered it today as per Bloomberg!

Merkel's reaction?

According to the NASDAQ newswire,

We Refuse To Acknowledge Greek Bankruptcy


So is this some late game Hail Mary stunt Papademos is putting on to get the Troika to bend? Who knows, but judging by the past EU summits, it wouldn't surprise me if they really had not done the math yet.

Speaking of which,
Wall Street has said that Greece is a "Blind spot" and that the risks from Greece are not fully priced in.

Of course their not, no one has the imagination to understand the jolt that would travel through the global economy, how a Greek default would effect German exports or Chinese exports and how a slow down in either country would effect the IMF or other EU credit ratings, what the implications of a change in credit ratings would bring, I could go on forever, there's just not enough imagination to crunch the number and clearly understand the risks.

Look at Lehman! Within days of the crisis really taking off and with the Treasury Secretary focused on the financial system, he didn't even know that GE was on the verge of losing all access to capital and they make lightbulbs! I'm being a little dramatic, but they didn't understand how Lehman alone would freeze up all liquidity and effect industries that seemed far removed from the crisis. They were playing catchup at every step. In fact Paulson didn't even know that AIG was about to fail until one of the investment banks he was having a meeting with told him, I believe it was Jamie Dimon. AIG insures 1 of every 4 planes in the sky and a whole lot more, yet the Secretary of the Treasury had no idea.

Nuff said for now...


Baltic Dry Index

This chart only goes back 5 years, but at 647, the BDI is posting 5 year lows and likely quite a bit longer then 5 year lows.

As far as I know, we were the first to uncover the trend in the usually noisy and volatile index, I didn't see it mentioned anywhere else until at least 10 days after we started seeing the decline and the trending nature which is exceptionally rare for this index.

Again, this is the daily rate published for the average cost of shipping dry goods on container ships, something that is not good for Greece as a major shipper. It is also a sign of economic activity in tangible goods (excludes natural gas, oil, etc) such as commodities like iron ore, cars, computers, textiles and just about anything that is shipped that is not wet.

Remember the Cat and Dogs trades I talked about earlier and the move in shippers of the last few days, both EXM and DHT mentioned as C&D trades earlier today are both at a profit and one of the bigger shippers, DRYS is up nearly 24% in the last 2 days.

Now we have news that shipping rates have gone negative.

Bloomberg reports:

Glencore Gets Free Ship With Fuel Discount as Rates Go Negative


Feb. 6 (Bloomberg) -- Glencore International Plc hired a commodity ship with the operator of the vessel earning nothing and contributing to some of the fuel costs after freight rates for hauling raw materials had their worst-ever start to a year.

Glencore chartered the vessel, operated by Global Maritime Investments Ltd., a Cyprus-based company with offices in London, at minus $2,000 a day for the first 60 days of the charter, Steve Rodley, GMI’s U.K. managing director, said by phone today. The shipment is Australian grains to Europe and it will put the ship in a better position for its next cargo, he said.

“Our other option was to stay in the Pacific and earn poor revenues or ballast to the Atlantic and pay the fuel ourselves,” Rodley said. Ballasting refers to sailing without a cargo.

The C&D trades in shippers are no coincidence.

Quick Market Update

 This is Friday's unusual close, I say that based on Dow Theory, although it is much more complex now then just Industrials and Transports, although on Friday I did point out the divergence between transports and Industrials and I will have more to say about transports in a post coming. However on this chart, you have to match up the color coding with the averages, the NASDAQ100, DOW-30 and SPX (yellow, light blue and green) all made a late day push, while the Russell 2000 and the Euro (red and white) failed to participate, this is a warning in Dow Theory.

Here is the Russell 2k's relative strength vs the SPX for the day, it fell off sharply at the close.

 Today is just killing time as I would expect as Greece will dominate this week's early trade, the SPY did hit the last late Friday support level which has acted as resistance thus far.

 This morning's 1 min 3C chart showed a small positive divergence and the SPY bounced off its lows, since hitting resistance for the second time, a negative divergence is in place.

The 5 min chart deteriorated pretty badly from Friday's afternoon highs and remains leading negative.

Swing Trade Template

This is my Swing Trade Template I've been working on for StockFinder. I have the basics of the signals completed, but still need to add some indicators and a possible market index/breadth indicator so you know when the timing is best for a potential swing trade. This basically shows you some entry points, what is important in the swing trend and what is just noise as well as exits.

I prefer using this on an intraday basis as far as entries/exits are concerned, there's no need to wait for the daily close when a swing pivot has been taken out as the entire concept is based on Swing pivots. Remember that Swing trades aren't meant to be long trending position trades, although you could certainly use this chart on a multi-day timeframe to define longer trends.

If you are running StockFinder as your charting platform and are interested, I can give you what I have so far or you can wait until I finish the template.

Here's an example chart to explain the concept of pivots and noise.

This is the daily Swing chart, you could even use this intraday for intraday trading, but as far as Swing trading, use the daily chart.

 From left to right, in Green we have our first Swing long entry, although you may have used other indicators to enter the trade earlier, this template is still helpful in identifying noise in the trend. Now we have a swing uptrend, the yellow arrow denotes the pivot candle, it is the last candle in the trend that makes the highest high. The white candles are noise, however once again, other indicators can be used to supplement and quantify the noise, whether it is just noise or whether it should be taken more seriously and stops tightened or partial profits taken. The next red arrow is the exit from the Swing Trend and if conditions are right, it is a swing short entry. This candle made a high lower then the pivot candle's low, thus we don't have to wait for a closing basis to execute the stop. Next we have a swing short trade, the yellow candle is the pivot, it made the lowest low in the series, therefore its high is what we want to watch. The first green candle made a low higher then the pivot candle's high and thus closes the swing trade and if conditions are right, opens a long swing trade. Next is the long swing candle pivot at the yellow arrow, it made the highest high of the series and its low is the stop. The white candles are noise within the trend, next we get a stop on the long swing trade at the next red arrow and a short swing trade which makes a long legged doji star, a hint that a reversal is coming. Two days later that short trade is stopped and a new long swing trade is in effect, again the yellow candle is the pivot and the red candle is the stop out.

Using this same layout on a 5-day chart can be helpful in trading WITH the trend. Some of the indicators I still have to add will identify the trend, but even the direction of a simple moving average can be used, the length depends on the timeframe you are trading.

Here the general trend is down, all of the same concepts apply, except this is on a 5-day chart, the idea is to only take the short trades as they are with the trend and to be out of this particular market when the trade ends and wait for the next set up. As you can see, there were 4 winning trades, 1 break even and 1 slight loss. Additional indicators and analysis can certainly improve your entries and exits, but if for no other reason, the template is valuable for understanding noise candles in white.

Email if you are interested in the layout.

IRE Update

Yes, the Irish Bank long trade, it's not a sub $3 stock, but may be a C&D trade although it does have a bigger base and looks to have enough support to trend higher. However being aware of the basic fundamentals in the Euro-zone right now is probably helpful in understanding this trade.

 IRE on Friday, which had the volume of a breakout day, but not the close, remember, pay attention to the close, that's when the pros are trading. IRE didn't close near the top of its range, which is not what we want to see on a breakout day.

 Thus far the Trend Channel on a daily setting is about the only trailing stop that is wide enough to hold the recent trend, allow for a correction and possibly higher prices, if you want to take profits or use a tighter stop, that's a matter of preference. I would think that the Greek meeting this weekend is what caused IRE from closing strongly as some profits were probably booked going in to an uncertain weekend. I have no idea what exposure IRE may have to Greek debt, but any Greek default will likely freeze the entire financial sector, so IRE may be responding to that uncertainty, if it were not for Friday being a breakout day and the situation in Greece, I would say this looks like a benign pullback. In any case, if you took the trade when it was mentioned, using the Trend Channel as a stop will keep you in at least a profitable trade as it is higher then the entry at roughly $6.50 and will continue to move up, the bottom of the channel is the stop for long positions. Usually I use it on a closing basis, but if you want to preserve profits, you can certainly use it on an intraday basis.


As far as a Swing Trade methodology, today's candle is considered noise within the trend, only a candle with a daily high that is lower then the pivot candle's (at the red arrow) low, would be considered a break of the Swing trend.

As for 3C...
 The hourly chart still looks very good, but remember, Greece is a big event, much bigger then Lehman.

 The 30 min chart is in perfect confirmation of the trend thus far.

 The 10 min chart shows a move from confirmation to some distribution on Friday.

Thus far the 1 min chart isn't telling us much about whether there's going to be accumulation on the pullback yet, it may just be a normal pullback, in which case the 10-22 day moving average would likely be targeted, this can be a correction in price or through time as the 10/22 day continue to rise.

I would keep an eye out for any headlines out of Greece, Germany or the Troika in general and if things get dicey, I would consider taking profits or at the minimum, tightening stops or a mix of both.