Tuesday, October 15, 2013

Midnight Futures

I said in the Daily Wrap tonight that I had hoped to look at the futures later tonight and discover something about the market.

Near the end of the post when talking about Index futures, I also said ...

"There's a symmetrical triangle forming in ES and NQ and an ugly version of one in TF, this would normally be taken as a bearish consolidation/continuation pattern, I'm betting though it will do as they usually do and run a head fake move to the upside, the divergences are already there for it, what happens after is where it gets interesting."

I posted the entire article at 6:34, at 6:35 which was probably about 10 minutes after I had written the above, this is what happened in ES and the other Index futures (as they already had a 1 min intraday or overnight positive divegrence)...
 First there's an upside break from the triangle, the volume isn't huge, but there's a noticeable uptick and then there's a downside break, this is shaking out stops on both sides of a pattern or what we call a "Crazy Ivan" shakeout, then around 7:30 we get a pretty solid move up of about 14 ES points. I was listening to talk radio and recall there was a lot going on at the time in the House, votes scheduled and cancelled, etc and apparently "Enthusiasm" from Harry Reid. In any case prices are fading, having lost about 6 of those points thus far, but this is overnight trade and why I don't take 1 min charts too seriously overnight, there's just too much time, too many markets and too much that can happen.

Instead of getting any real information here, 3C is nearly perfectly in line with price which suggests the move was news driven in the thin liquidity of overnight futures.

The only interesting thing is the 15 min chart below of ES...
This chart is looking worse and worse, that would be coming from the 5 min chart, but I suspect what will be important come pre-market tomorrow will be the shape of the 5 min chart unless some massive 1 min divergence forms overnight. right now this doesn't mean much to me, it doesn't tell me anything, 3C isn't leading suggesting a lot of real money behind enthusiasm and it isn't leading negative suggesting a lot of heavy distribution , however with the thin overnight market, the 15 min chart may be the better judge of that.

The $AUD is close to in line at one min, it has a negative bias beyond that, the Euro is a bit moved, I'd say short term overnight it starting to see some weakness, the $USD still has a negative bias despite some upside movement. The Yen finally is inline on the 1 min and has definitive positive bias beyond 1 min charts, which could be trouble ahead if there's nothing else moving the market like bi-hourly Congressional leader cheerleading, especially because...

Strength in the Yen which I'm 80% convinced is coming will damage the carry cross like the Euro/JPY above in candlesticks, when you look at how ES (purple) has been hugging the pair both up and down the last 4-days (yesterday up, today down, tonight up), you understand why a falling EUR/JPY (like today during regular hours) is damaging to the broader market.

This is why I'm putting a lot of time in to looking at the currencies to see what the likelihood or probabilities are. For example, overnight the 1 min EUR/JPY...
 is close to in line, there was a positive divegrence at the same lows the market or rather ES and TF hit and developed positive divergence at this afternoon, there's a slight negative in the pair now.

To break that down further, for the pair to rise and help the market, the Euro must outperform the Yen, Euro up and Yen down, when you buy the EUR/JPY you are going long the Euro, short the Yen so I look especially close at single currency futures...

 This building positive in the Yen (30 min) is why I say I'm 80% positive it's heading up which is bad for the EUR/JPY and bad for the market as long as it follows it as it has been doing for the last week and really much longer. That's a strong Yen positive.

The Euro's negative already happened, there's not a LOT to get off this chart, but I can say I'd give the Yen much better chances at outperforming the Euro, that tells us something about the market when we have signals like tonight in Index futures, neutral.


Daily Wrap

Other than a little trepidation which may or may not be justified (this is a very unique circumstance in which the US "could" default and there are surely going to be insiders trading ahead of any announced deal), today was a great day.

If you took the VXX November $15 Call trade yesterday you should have been filled around $1.09, maybe better and as of today's close, you should have nearly a +60% gain. I know a lot of traders who'd take the rest of the week off with a single trade like that and not violate risk management.

Even if you just took the UVXY long equity (ETF) position, you'd have a 1-day gain of 13%, that's not bad at all.  I know it was a difficult trade to take, a lot of our trades will be because we aren't  chasing price, we are watching the underlying action, what Wall Street is doing and they are doing it long before it shows up in price, but if you think about it, you not only got in at a better price which allows you a larger position without violating your risk management, you're also a lot closer to a reasonable stop than those who chased VXX, even those who saw the price trend changing early. While it can be scary, it's almost always a better position with less risk, it's just habits and old ways of looking at the market are hard to break.

Right now, unless some really interesting trades come up, we are largely in trade management and trade set up mode, managing current positions and setting up the next round.

We are closing in on "D" day, "D" is for "Default". I'm not getting political on anyone so plase don't take it that way, but it's a well known fact that Democrats have seen universal health care as the summit of Mount Everest, Obama wasn't the first to try. It's my opinion that this crowing achievement of his administration would be tarnished if he were to be remembered as the President who presided over the U.S. default which would come with some unimaginably nasty side-effects and unknown consequences, so I think (this is gut alone), a deal gets done.

The question is, "How much of this sis the market already bake in to price?" It would seem to me the market has largely discounted the probability a deal gets done and adjustments like today are discounting the time decay until "D" day (with ALL RESPECT to Veterans).

I've had a lot of conversations via email with members as to what happens if a deal does get done? Is it "Sell the news" or "Relief Rally", I can't say, I suppose it will likely be whatever Wall St. needs it to be.

One of the examples I've used in our exchanges is the announcement of QE3. If you recall on September 13th 2012 when QE3 was announced, we saw the typical F_O_M_C / F_E_D knee-jerk reaction I always warn of, it looked like this...
 QE3 is announced, you may remember we had serious 3C negative s and as much as conventional wisdom and even emotions said, "Cover all shorts and go full long", I said, "We have negative s, let's just be patient" and we were right as the market lost another -8% in to the November 16th lows.

Note the F_E_D / F_O_M_C knee jerk effect, if you can find an F_O_M_C meeting that occurred and I didn't want before hand, "Beware of the F_E_D knee jerk effect", I'll give you a prize! It just happens that often, the initial reaction is usually faded or the wrong reaction.

 This is the recent Sept.18th, "No Taper" with a big push to the upside, no follow through and the knee-jerk move higher was exactly that, a knee-jerk reaction that was faded.

However, back to my point...
I'm not so sure the market failed to respond to QE3 because as pundits claimed, "It was priced in". Unfortunately intraday 3C charts can't go back that far, but WE DID HAVE ACCUMULATION IN TO THE 11/16 MARKET LOW, that means whether there was no rally on QE3 because it was priced in or not, we'll never really know. It very well could have been the market needed a good, long accumulation period on the cheap which I believe they've been distributing through most of 2013, the accumulation was there on 3C charts in to the 11/16 low.

The point being, institutional money is like an oil tanker trying to make a turn whereas we are like jet-skis, things you see now they planned and put together long before, take the VXX accumulation yesterday and the run today, but I have even more intense proof, how about home builders being accumulated during the 2000 tech meltdown, when the housing boom didn't start for a couple more years, this was a 1.5 year accumulation period.

Likewise, what you see right after an event like the debt ceiling, can't be taken at face value any more than this huge multi-day 3C chart's accumulation of HOV (Homebuilder).
 Not only is the base near perfect with a move below obvious support and the rounding "process" on this 3-day chart, the leading positive divegrence there is huge and right at the time when the market was getting pounded as the Tech bubble popped. Who would have ever known that housing was going to be the next bull market after the Tech Revolution? In our case (our area), out home more than doubled in value in 2 years! Who would have known that? Someone with DEEP pockets did...

This is what the divergence would have looked like at the time...
And HOV gained 2500% from there.

Another case in point, the VXX yesterday... and just about a +60% gain today.

I think the point is made, what you see is not always what you're going to get.

So on to today...

If you don't recall, last night's Daily Wrap I posted charts of the EUR/JPY (I actually posted them earlier in the day, but I had to wait until the close to give you a better view) to show you how the carry pair was driving the market...

This is from last night's post...
 To me, this is a very interesting part of our analysis because the media tells you the market did this or that because of the most obvious thing they can think of like the Congressional farce right now, but it was clearly the EUR/JPY driving and supporting the market yesterday.

I made the case and showed the charts that the Yen wasn't going to cooperate any more, today take a look at the E?UR/JPY and the market...

Yesterday ES (SPX Futures) rise with the carry pair, today the market falls with the carry pair.

Another question I was pondering was whether gold was truly acting as a "Flight to Safety" asset, today (for now at least) that question is answered...
You can see a nearly perfect inverse correlation as ES falls, Gold futures rise and vice-versa. There's even some of the same effect with silver futures, but the correlation isn't as tight.

As for the traditional flight to safety, Treasuries, does anyone recall what my price target for TLT was as it was trading up around $107-$108? It was $102 or less, we're pretty close to that level and while we don't have the signals for a position there right now, the long term signal (daily) is still solid.

The SPX/SPY had an interesting candlestick close today, you may remember last night's Dominant Price/Volume relationship, it suggested a lower (red) close today.
The upside reversal was a strong candlestick pattern of both a bullish Harami and a Hammer, today formed a Tweezer top on increasing volume.

The NDX formed a bearish Harami with a candle that would have been a bearish Shooting Star" had it gaped up, but then we wouldn't have the Harami, all in all, a bearish looking candlestick close there as well.

The Dow was VERY close to a bearish "Hanging Man " reversal candle yesterday and just a fraction off from a bearish engulfing candle today that would serve as confirmation.

I mentioned this last week when talking about price patterns and candlesticks, "Just because they aren't textbook, doesn't mean the things they represent aren't valid. For instance, the NDX yesterday was missing the gap up that would have given the closing candle the textbook designation of bearish "Shooting Star", but the long upper wick that tested higher prices and failed was still there, the small body with the close near the open was still there, the same reasons were still there. You have to be careful about looking for textbook patterns because those are 1 in 100 cherry picked for the books.

Our Leading Indicators for sentiment both closed negatively dislocated from the SPX, the rest you pretty much saw earlier today (Credit, etc..), but there's one that changed a bit...
Yesterday I pointed out on the VXX vs SPX chart the strong bid in short term /VIX Futures that created more demand than supply and broke the correlation with VXX higher than it should be. Earlier today I showed you how VXX had taken off to the upside well in advance of the SPX, this inverted price chart of the SPX (green) shows the correlation and how the SPX moved down to catch up to the VIX Futures implied correlation, it didn't quite make it, but the VIX yesterday was telling us something was up and you could see that without 3C.

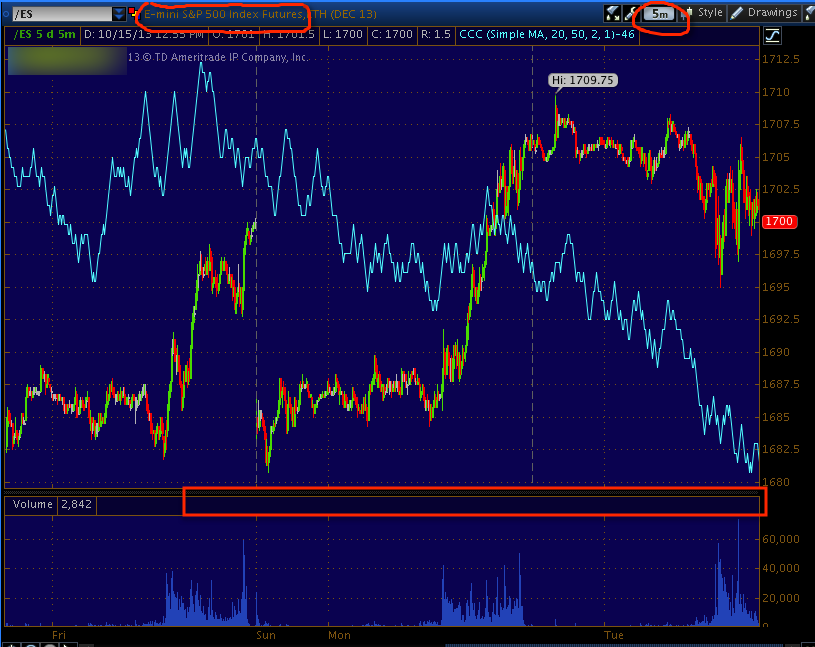
As far as Index futures go tonight (early on)...
  Earlier it was R2K futures only that were positive (TF), late in the day, in fact at the lows of the day, ES (SPX Futures above) joined TF and as of now they are leading positive. I usually don't take 1 min charts too seriously overnight unless they are the start of a new divergence which should become clear by later tonight, otherwise I'm not too concerned.

 NQ (NASDAQ 100 Futures) have stayed in line, their underlying trade has been more moderate than the others, but they did not go intraday positive, they did show some distribution at the highs for the new week as you can see above, otherwise they are unremarkable.

TF (R2K Futures) are what started this Index futures positive divegrence, as I showed later today, the IWM itself doesn't have the same signal so it's still very much up in the air. In fact, there were only a handful of charts that had a positive intraday signal, but they were some important ones like the confirming intraday negative in VXX which caused me to take some off as the position was way too large. Again, the lows of the day saw some accumulation.

What really matters to me in overnight trade is the 5 min charts...

 ES is leading negative and distribution really kicked in at the high of the week.

NQ is just barely leading negative (as I said, NQ is a bit more moderate).

TF is leading negative as well, this is the chart that kept me from moving more VXX, but these need to be checked later tonight to see if there are any changes as new divergences almost always start on the fastest timeframes first.

There's a symmetrical triangle forming in ES and NQ and an ugly version of one in TF, this would normally be taken as a bearish consolidation/continuation pattern, I'm betting though it will do as they usually do and run a head fake move to the upside, the divergences are already there for it, what happens after is where it gets interesting.

As far as Carry currencies, the $AUD could run a bit on the upside, but I don't think it's prepared to make much of a run, it just doesn't have the accumulation in place or base. I thought the same thing about the Euro earlier too after the German ZEW sent the Euro down 100 pips on the release of the survey. However I don't see this as much more than a quick dead cat bounce as well breaking up what was a bear flag. That leaves the $USD, in my opinion from the 3C charts, this is the currency that is most likely to see downside almost immediately, typically a cheaper $USD means rising prices in stocks, precious metals and commodities, especially oil, so that may be of some help even if it's not part of the carry, SO I DON'T KNOW THAT THE YEN IS OF MUCH IMPORTANCE IN THIS SCENARIO...

In any case, I believe the Yen has some overnight weakness and should see a stronger move to the upside, it has been working on a base since yesterday, it has the 15 min3C positive, so that could be interesting with the averages running in the overnight session and the Yen strength building in right as the 1 min positives in the Index averages run out of steam.

Unlike yesterday, there's no Dominant Price/Volume relationship among the component stocks that make up the major averages. Credit isn't telling us anything new since yesterday, I'm not seeing a strong indication from gold futures, although there's a weak pullback indication which would fit an overnight Index future run.

 For now, I think that's about it until we see what the futures do later tonight. I did think it was interesting that ES and the CONTEXT model met at reversion to the mean.

Hopefully you can see why I'm a little cautious on short duration positions right now.


ES intraday has joined TF

The TF (Futures) 1 min positive that started some of this suspicion earlier is now seeing ES 1 min going to a positive for what looks to be a bounce, which wouldn't be that unusual after a "V" decline like we saw this afternoon. NQ is still in line with price intraday and ALL 3 are CLEARLY negative (leading) on 5 min charts.

Unless this was the start of a new divergence, which so far looks unlikely because there are so many assets that don't reflect anything, I'd say it's probably at best some overnight volatility and I don't view 1 min futures charts as significant overnight, they can flip 4 times overnight, but the 5 min and longer charts are, those are as I said, clearly negative.

The averages themselves are in different positions, mostly in line or leading negative, none seem to have that same intraday signal as ES and TF, the SPY did have it, but that was reconciled.

That's about it for now, if you picked up VXX calls yesterday you certainly had the chance today to cash in at +30% 1-day gains.


EOD Ramp?

CONTEXT (ES) has come down or rather ES has come down to the CONTEXT model from about -18 points to a differential of about 2 right now.

Remember this is about 30 mins delayed

The TICK chart also shows something going on...
 TICK intraday trend is positive...

And they seem to be kicking the SPY arbitrage in to gear with somewhere near a +$.60 SPY positive differential.

The carry crosses are bouncing at the same moment as JPY sees a little intraday 1 min 3C weakness as well as price, but the 5 min JPY 3C chart is leading positive, this looks like a head fake end of day ramp they are trying to set up.

The carry is in the right place, but on a small pullback to help, SPY Arb is being activated and you saw the TICK, the more important part though seems to still be the longer 5 min + charts are negative. I'll be watching VXX for any opportunities in to the close

Market Update

For the rest of the day, it's going to be watching just about everything I can to make sure we're on track or to look for anything unusual. As you know the market broke down not long after I closed 1/3rd of the VXX position at a small gain, if you ask me if I regret it, the answer is no I don't. We only get to see a very thin sliver of the market and of what's really going on at any one time and if something is out of place (whether you have a position that is too large or not), it's easier to preserve capital than it is to make back losses.

That being said, so far the SPY divergence (the problematic and also one of the smaller) has cleared, TF has not yet, but the R2K or rather IWM has to be taken in to consideration. VXX hasn't totally cleared, but in that timeframe on a move like that, it's normal for a little lag or profit taking.

 This was the earlier SPY, small positive in white, that has cleared as the SPY and 3C made new lows.

 This is the same SPY chart as above, just zoomed out to scale, you can see the accumulation before the market broke to the upside last week and the degree of distribution presently, it's actually quite impressive, but news of a deal would throw incredible volatility in the market really fast, that's why I want to be extra careful, extra watchful for anything that looks like a group of Capital Hill Staffers are out placing trades on inside information (there is a reason they are one of the most successful groups of traders).

 The VXX is lagging on the 1 min a little, but this isn't too bad considering how parabolic that move is becoming.

 As I mentioned, when looking at the TF/R2K Futures, I have to consider the IWM chart and it's right as rain.

 TF 1 min still hasn't cleared, in fact it almost looks like we will see a bounce off this last move down.

The 5 min chart has made a new low, ultimately this is going to be more important so I want to se more progress here, I'll feel better about strange intraday signals.

VIX futures with the same signal as VXX 1 min

However the 5 min has a nice base, a nice leading divegrence so I'm still on my toes, but these longer charts definitely make me feel a lot better.

The catch is, all new divergences start on the fastest timeframe.

VXX / Market Follow Up

OK, so I took 1/3rd off the table with VXX, it came to a small gain of +8.5%, this isn't the reason for taking it.

A couple of posts back I mentioned a positive divegrence in the 1 min TF (Russell 2000 Futures), that has grown. There's also a small positive in the SPY and a small negative in VXX. The Q's and IWM are pretty much on track and now showing anything interesting along these lines.

Take a look...
 This is the TF 1 min chart, that's an intraday positive divegrence, this is the strongest I've found and one of only a handful.

 The 5 min TF chart still looks bad, no signs of the above on this chart.

While the SPY is leading negative, there's a small relative positive divegrence here. Normally I'd chalk this up to an intraday jiggle coming, but the leading negative would be the dominant signal.

Here's the slight negative in VXX 1 min.

Keep in mind the position size I had for VXX was well above what was originally intended so that's one aspect.

Here are the other two, I'm thinking if there's any kind of deal going on or rumors of a deal, this is likely what we'd expect to see, some cautious buying until the rumors were confirmed. I kind of doubt this is the scenario because I'd expect this to be a little more pronounced among the averages and as I said, the Q's and IWM don't show anything that would stand out on their own.

The other possibility is some end of day ramp attempt, knowing that the strong negatives are taking the market down overnight, into the close perhaps or in the a.m.

My line of thought is whichever scenario (or even if this is just meaningless noise), before the close I should either see this activity increase in which case I'd be suspicious an impending deal is going to be announced or I'd expect to see this reverse and perhaps some selling/short selling in to slightly higher levels or even at this same level if they feel the market is going to be knocked lower imminently.

SO either way, I'm either taking some risk off the table in one scenario or in the other, I'm able to add back those closed contracts at a better price or even around the same.


Taking 1/3 of VXX Nov $15 Calls off the table

I'll try to get charts together and show you why, mostly because I have large exposure there, but I'm thinking I may be able to add them back.

Market Updaten / Leading Indicators

Currencies are an important part of the market with almost no US macro data (we're looking to China for economic data) and of course the government debacle, I don't need to say how important that is, but this may be why the duration risk looks so pronounced to me, perhaps it's the market's reflection of it about top throw a fit, but then rally on the initial news of the default being avoided and make no mistake, I DO NOT think Obama is going to let his legacy be that of the president who  oversaw the U.S. as the full faith and credit of the US washed down the tubes with default and let that overshadow his healthcare triumph which has been a Democratic race to be the first to get it done (remember Hillary Care?).

This is hypothetical, but an initial tantrum by the market followed by a brief relief rally and a sell the news event is something that would make sense with a lot of charts, it would be a kind of delayed sell the news just like QE3 was a delayed "Buy QE3", I am not comparing duration in this case, just behavior.

So as far as currencies, the JPY looks strong enough with underlying trade and a price range that I don't think any of the carry crosses will be much help, the Euro got pounded on the German Zew business sentiment today, it may see a dead cat bounce, but I think it takes longer for it to put anything sustainable together.

The $AUD looks to be topping here and soon to roll over.

The $USD has a nice bull flag from early this morning, but it doesn't look like very strong probabilities it holds or adds much to it as far as carry crosses go and the main problem is the JPY itself.

The Index Futures look like this...
 I didn't want to draw on this chart because I think it loses some effect. You may recall it was Friday afternoon around 2 p.m. that the first negative divergences started peaking out which would be about the time the market starts to do what it wants as the op-ex pin from the weekilies is just about all wrapped up, the signal has just grown worse since and is quite ugly.

I posted the NASDAQ futures this morning and they haven't changed much.

 R2K Futures have seen significant deterioration overnight and in to regular hours today, so much so that there's been migration from the 5 min chart above...

to even the 15 min chart. Look at the divergences on the 16 min R2K Futures, it goes positive last week and we see that strong 2-day move on the upside, now we are seeing a leading negative from a relative negative.

The TICK charts have been deteriorating since the signals started late Friday...
 This is my Custom Indicator for TICK vs SPY with a sort of MACD Histogram of the differential instead of using the differential of two moving averages, today is clear.

I looked back a ways, although it's harder to see (that's why I lifted the first arrow so it doesn't block the data) and this is the sharpest drop off in TICK on the chart, although the previous one lasted longer.

This is the 1 min NYSE TICK data for the last 2 days, you can see trends in the data that align with price, it's divergences that are important.

TICK data is the number of all NYSE stocks that are advancing that single bar minus all that are declining, it's a breadth indicator. Obviously as price moves up like yesterday's IWM high, you expect to see more stocks moving higher, but here we see a trend of fewer stocks moving higher and more moving lower. The upped and lower limits are considered to be extreme levels.

 This is a simple intraday SPY Oscillator screen, momentum is negative, RSI is negative, MACD is negative and Stoch is as well.

This is about as close as I can get you to the EUR/JPY carry trade that was supporting the market before. Yesterday I showed you the charts of the Yen likely to stop cooperating and move higher or at least refuse to move lower and of negatives in all the crosses, but even 3C couldn't predict the depth to which the Euro turned negative after the German business confidence (ZEW) came out today.

Yesterday I showed how VIX futures were being bid for protection enough to cause a supply/demand disruption and keep the VXX from falling as it should have vs this inverted price chart of the SPX. Today it's far worse as VXX is leading significantly.

Sentiment has been peeling away, this is not Stocktwits, these are the pros.

 HYG which I also warned about is now peeling away from following the SPX to highs and making a new low.

I showed you HY Credit last night, not much improvement there.

However for all of this that is negative, there's a lack of REAL INTENSE negative, that's probably part of that duration risk that has me on the sidelines right now with what I already have. If something changes, then I'll take appropriate steps, but this was expected to be a short duration move so I don't want to try to trade it like it's something the charts do not support.


Quick Update

There is a small intraday positive divegrence, it can only be seen in a few places, the TF / Russell 2000 futures 1 min chart shows it the best. The SPY shows it a little, but the QQQ, IWM and DIA have no hint. VXX has no hint, but UVXY has a small hint of it. This may be R2K specific, it may be noise, but the TF chart alone (even as the only source) looks clear enough to mention it, that does not change the next post which is looking at the more important developments.

Possible Trades

There are quite a few "possible " trades, I still like VXX the best or UVXT if you maybe want 2x leverage (long), what I see that I don't like is the "Duration risk", how long these trades can last and how quickly they could turn.

Among some of my favorites are of course VXX/UVXY, I like IWM shorts  ETFs like SRTY, SQQQ is also in there (3x short the Q's), FAZ looks interesting long (3x short financials) and believe it or not with all that's going on with gold, SLV (long) looks interesting, but for now I'll stick with what I have.

URRE is still looking very interesting long, I'd kind of like to see what the market does first as I already have a pretty large position there.

I'm going to get some general market charts up, it's very ugly, but again I think you really need to be able to watch the market and move quickly in this situation as duration of a trade is the question. Oh, also EWG, an ETF covering Germany, that looks good as a possible short, not great enough that I'm willing to take the risk, but I thought I'd mention it.

TICK is busted pretty badly, I'll get the Index Futures up, not looking good at all.

Index Futures

I have to say, I REALY don't like the look of the Index futures here either, actually I think they look worse than the averages. Actually I love the way they look for both very short duration positions like VXX calls or UVXY long equity/ETF and as far as core short positions go, although I think they really benefit more after this move.

In any case, I'm going to take another look at some assets to see if there's anything that I like enough to jump in, there's a lot I like, in fact GDX/NUGT I like right now, I think they are closing in as they build a base, gold doesn't look as hot this moment.

I'll get back to you after I run through the list again, but as I mentioned yesterday, VXX or UVXY long, SRTY (IWM 3x short ETF) long, probably any of the inverse market ETFs would work.

In any case, we have to consider duration, targets, risk, etc,  as always it's not the probability of a move, it's a high probability trade which includes the probability of a move, the risk:reward ratio, the general market risk, the tactical entry available, etc.

Market Update & VIX

I think those VIX positions are going to be doing very well, very soon.

Right now I'm more interested in what's behind door number 1, meaning the immediate moment, things can change quickly, not very often with underlying trade, but when they do, they are quick.

So far I don't see anything I'd consider a change that concerns me, however on any market movement (in this case down on a pullback move), that's where we get really important information such as, "Is the move down a pullback that is being accumulated as a pullback should or... If the answer is something other than "yes", then something has changed.

here's what the market averages look like intraday, I'll have to put up the futures separately when I have a little more time, but those 5 and 15 min charts are bothersome.

 As I said yesterday, "I have no problem holding those VXX calls", the DIA this morning hasn't shaped up at all.

Nor has the IWM

The Q's have deteriorated more

As has the SPY.

The charts I usually use as 1 of my confirmation assets are VIX based charts, even if I'm not specifically looking at a trade there, this chart below would be strong confirmation of the charts above considering the VIX /VXX move opposite the market and should have opposite 3C signals for confirmation.
 VXX 1 min added a lot to the leading positive from yesterday

The 3 min chart has already been in position, this still reflects a shorter duration move, but that doesn't mean it can't be impressive.

The 1 min VIX futures are in a negative intraday divegrence, this happens on a 1 min chart 50% of the time as a consolidation only move, basically hold the asset in place and not a pullback through price, it's a stalling tactic.

I didn't want to draw on the 5 min chart which went positive yesterday between 2 and 4 p.m. because I wanted you to see it without distraction, that's the VIX Futures, the underlying asset behind the VXX (with some slight caveats).

I'll be looking for that 1 min chart to shift to positive.