Thursday, July 26, 2012

FB AH

I haven't used 3C in after hours on this platform, although that is what it was originally intended for, instead it is used for ES.

If indeed it is working right, FB may be getting ready for another manic move.

I suppose we'll know shortly...

3C and Market Expectations, Targets hit...

This is very interesting to study, just to see how the market plays games and makes sure that the most traders at any one time are wrong.

If you look at Monday's closing actions in the SPY, here's what you would have seen.

First you would have seen a bear flag and a rally from the support line that couldn't make it to the resistance line, this is taken as a sign of weakness and that the next leg down will break the flag. You would have seen a large bear flag with the negative implication of a break to the downside, a new leg down would start with measuring implications in this case to SPY $120. On Monday all that TA teaches about bear flags had come true, the only thing left was the move to $120.


Tuesday at 12:04 a.m. (really very late Monday night), in this post called "3C Indications"  we had positive divergences and I first posted this chart and target in that post.

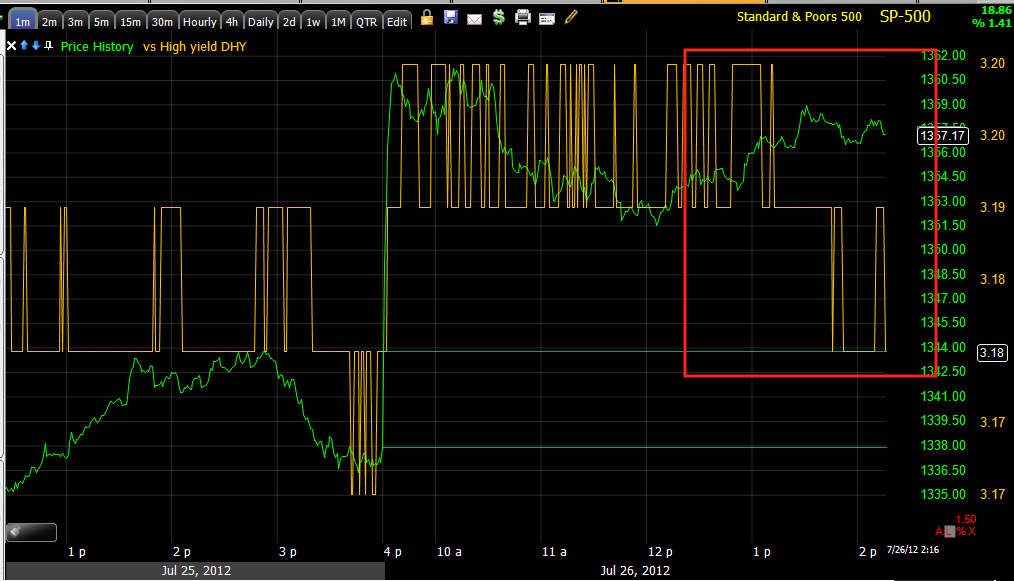
I had mentioned in updates that the market wants to confound the most traders at one time and to do so, a move back inside the flag was a likely outcome, 3C supported this view. The Yellow area was the target.

On Tuesday at 2:10 p.m. in this Market Update I updated likely targets based on the 3C charts, even though Technical Analysis themes say we should have been headed down, I posted this chart...
The first gap being the most likely target and the higher targets becoming less likely, but still within the realms of possibility based on the 3C charts.

Yesterday at 2:08 in this Market Update I pointed out what looked like an inverse Head and Shoulders in the DIA.

3C supported this view, the rough measuring implications would have been DIA $129, today the DIA made an intraday high of $129.03.

Here's where the SPY closed...
EXACTLY in our target range from late Monday night (technically 4 minutes in to Tuesday).

While other traders where looking at price action and price patterns and likely shorting the market for a big drop this week, before trade opened on Tuesday morning we already had a likely target for the market several days in advance, we've hit that first target today.

The short term positive divergences were pretty strong early in the week, but still only short term, as of today they are deteriorating so we are nearing the end of this "noise" cycle and I call it a cycle because it is specifically set up by Wall Street in advance, how else could we know about it days in advance and even the target area?


FB all over the place

I saw it up 7.6% and now down 5+%

FB Hits Consensus and then some

 Profit of 12 cents per share on revenue of $1.18 billion. The consensus was 12 cents and $1.15 billion.


Now for guidance

Looking at currencies, best guess

Although as we saw overnight with Draghi's words, a lot can change over literally nothing (but it seems some were aware of what was to come as we had positive divergences that suggested we'd see more upside-it just wasn't AAPL bringing it to us), I'd say best guess is a gap up tomorrow in the a.m. that is faded to the downside, I suspect that will bring us back in to the down trend or pullback short term trend, I think this will be an ugly move, I think it has to be.

I waited on UVXY for signals that were worth taking, I suspect those will come in to play tomorrow. The question I have is whether the gap will be faded quickly and aggressively or we will see the typical "half and half" type of day.

Of course, as I said and Draghi showed us with literally nothing new, a lot can change overnight.


Other Averages

Without wasting too much time capturing charts, the SPY is still on the negative trajectory seen in the last update.

The DIA is mixed, similar to the IWM, the 15 min chart is very solidly negative, I mention this because this takes out a lot of noise and reveals the stronger trend that is underlying all the monkey business.

The QQQ is mixed as well, not the real positive migration we'd like to see in a long position, again the 15 min chart is solidly negative. I believe we are close to that reversal and back to the trend. I feel fine with having opened the FAZ position today.

The IWM as the outsider...

You may recall earlier I had one chart that bothered me as it looked like it had seen intraday accumulation in a flat area with positive divergences, that was the IWM and it has made its move. The intraday divergences that were solidly positive earlier are breaking up a bit, some positive, some falling off.

 1 min is a little better than in line

 2 min is starting to falter

 3 min is still leading, we'll see if there's enough time for the 2 min to migrate to the 3 min chart and weaken it.

The 5 min thus far is about neutral, but it definitely could lean negative if we have enough time.


FB

FB is not the perfect chart, especially before earnings, but there are some interesting things unfolding today, especially after ZNGA's earnings last night.

 It seems if FB was going to have a bad earnings reaction, there wouldn't be a need to run stops this late in the day, that's not scientific, just "feel".

 Look at the fastest chart, the 1 min and how it responded to the break of intraday support in which volume jumped.

 The 3 min chart intraday also looks positive at that break below support.

 The 15 min chart overall looks pretty good, with ZNGA's earnings, I would think the 15 min chart would look bad or worse than it does here.

The same applies for the 30 min chart.

Now the SPY joins

Earlier when I posted the first averages to start to go negative in to higher prices (that's what we want to see), the SPY was not among them, now it is joining in.

 SPY 2 min

 SPY 3 min

SPY 5 min.

As for UVXY, it looks decent here, the longer timeframes look great, but it doesn't look as good as I'd like to see to enter a position yet, that could change quickly, but as of yet, not what I want to see for very high probabilities.

BIDU Charts

 At nearly 84% and a probable consolidation coming, it's hard to justify leaving this position open, it can always be re-opened when the climate looks a little better.

 Ultimately we got what we were looking for, a bear trap in BIDU, a counter-trend move higher than where we are now would be an added bonus and the 15 min chart suggests that is still very much a possibility, but charts below 15 min seem to indicate some consolidation and I rarely want to sit through consolidation in an options position.

 The 15 min chart and the bear trap in the red area.

 However the 1 min chart has turned negative on the day at a new leading low.

 So has the 2 min chart.

 The 3 min chart isn't even neutral, it's a relative negative divergence.

And the 5 min chart is also at a new leading low for the day, taken with near term market expectations, it seems now is the time to wrap this one up.

Closing BIDU Call Position

The other day I had a 55% profit and wanted to give BIDU some more time, I still think BIDU can make a stronger counter trend move, but I do have the options and the downfall of options to consider, being there's a good profit in the BIDU calls and some short term signals moving in the wrong direction, I'm closing the position for now. I'll follow up with some charts.


Risk Asset Layout

Basically I'm looking for deterioration overall today, but especially in to the afternoon; CONTEXT is showing deterioration in to the afternoon upside, so are many of the risk asset indicators.

 CONTEXT is not only ugly on he day, but on the second run in the afternoon.

 Commodities are totally falling off on the second run, this is what I was hoping to see.

 HY Credit isn't making higher highs anymore, now it's making lower highs/lows and in to the afternoon price move.


 High Yield Corp Credit has just gone flat and refused to make higher highs with the SPX.

 The $AUD is starting to diverge negatively in the afternoon as is the Euro below.

 Euro

 Energy is the only sector looking pretty decent right now of the 3 main sectors.

 Financial momentum is way off.

 As is tech.

 Intraday sector rotation is seeing Financials , Basic Material, Industrials and Tech all leak off, only Discretionary is up other than a few defensive sectors like Utilities and Staples.


Sectors since yesterday make sure to compare now to the open today. Energy is the only real standout, other than defensive sectors.

Chart Update

Here are several of the intraday charts just starting to turn, this could lead to some choppy trade as an alternative to a reversal.

 DIA

 ES

 QQQ

 Financials

Tech...

The one area I still have some upside concerns over is the IWM. The short term has seen flat price, perfect for accumulation and there have been positive divergences, the larger trend without intraday noise is quite negative, so it's still a matter of timing and tactics in my view, not strategy.

 IWM 1 min

 3 min

 5 min-note the flat price range, often an accumulation area.

The 15 min is the strategic view.


Quick Market Update

The move up I was looking for intraday was to be accompanied at some point by some negative divergences, several of the averages are now starting to go negative.

Charts coming up, we may be near an entry for UVXY.

Market Update

Here's what I see and what I'll be looking for to enter some UVXY calls later...

Using the SPY as an example...

 Most of the short term charts should be able to confirm a move up, they are fast enough, when they don't there's usually something not right with the move.

 Zoom in intraday on the same chart and it looks like it want to move higher, this is why I waited on the UVXY calls, we simply had too much time left in the day for the market to move in its final direction, it needs to shake things up and traders out.

 2 min non-confirmation, but...

 zoom in intraday and it looks like it wants to move higher intraday, this is where I want to watch for an opening for UVXY calls.

 3 min non-confirmation, but

 again zoomed in to intraday status and it looks like it wants to move higher.

 The 5 min hasn't confirmed either, I feel like the move up we were expecting is going to be short lived, that's what my gut said yesterday too.

The 60 min trend is just ugly, there's not much noise here, so I want to let the market do it's thing and near the last hour of trade, look for an opportunity to either short some names or go long UVXY calls, I want confirmation though on intraday charts.

I'm going to take a look at some other charts and the risk asset layout.