Thursday, October 13, 2011

Financials to take a hit?

UBS was just downgraded by Fitch, a bunch of other banks were put on negative watch, here's the story.

FAZ longs must feel pretty good

Want to see what's happening in AH?

3C continues to predict trade even in AH on the SPY and E-Minis

 Here's SPY After Hours trade and 3C on a 1 min basis. The darker area is the regular market hours-this shows mostly the afternoon trade and the light grey is after hours, the blue line is 3C. 3C went negative during regular trade, sending the SPY lower  toward the close (first red arrow) and in AH, the SPY moved up right after the close; 3C was still negative and SPY pulled back in AH, now there's a slight positive divergence that should send AH trade a little higher-it's actually still developing.

 In ES trade, this is the 1 min chart during market hours -the white box is where 3C made a positive divergence and ES took off from there, then 3C topped and moved lower. The market topped after that and dropped a bit, in AH it made another attempt to bounce (too the far right), 3C is still negative and that bounce pulled back and continues to.

Here's ES 5 min during the day, the white line is 4 pm, 3C is making lower highs and the rally today pulls back as well as the attempt in to AH.

GAP CLOSED

This is probably no coincidence, all 4 major averages saw their 5 min charts finally go negatively divergent right as the gaps were pretty much filled.

 DIA 5 min

 IWM 5 min

 QQQ 5 min

SPY 5 min

3rd Day in a Row

This is the 3rd day in a row that the market has diverged from the performance in the EUR/$USD.

As a general rule of thumb, a rising Euro means a falling dollar and a falling dollar means a stronger stock market. An easier way to remember it is, when the Euro rises, the stock market rises.


Her the SPY in green just fills the gap, while the Euro moves higher relatively speaking, so today is not as bad as the last 2 days, but the market is dragging behind the Euro, probably reflecting domestic concerns like earnings rather then the recent concerns over Europe.


FXE/Euro 2 min-as I asked -"Sell the News?" on the Slovakian vote. Of ourse there will be a knee jerk reaction to the vote being passed, but 3C 2 min has shown some weakness in the Euro as it moves higher.

3C 5 min shows the same and in fact started moving down in the red box, before the Euro.

GOOG Earnings

GOOG reports today at 4:30, this will be a big event for the market. The most stressful calls have to be earning's calls, I don't like making them, but I have in the past to illustrate that there are often leaks that Wall Street trades and you would never know it by the price action. The last time I made a GOOG earnings call it was correct, not on whether they beat or miss, but the market reaction, a miss or beat is irrelevant, it's perception moving forward.

So this is not a call, but do with it as you like, just remember that last time we did GOOG we were right, but the signal didn't come until the last 15 minutes of the day!
 GOOG 1 min-I know-it's like a maze, just follow the divergences. Green at the left is confirmation of the move up, the red square shows GOOG hitting new highs, 3C was in a leading negative divergence, this morning we saw some accumulation (white) and made new highs, which were negative divergences, both in leading terms (small red box) and in relative terms (long red arrow) because 3C was at a certain high at 2 pm Oct 11, prices were lower then they were at today's intraday highs, 3C should have been higher as well to confirm the new high, instead it was at the same spot, which would imply there was selling/distribution there. The last red arrow on the right, GOOG has made two relative highs, 3C has moved lower. This is a close up view of the 1 min.

 Here's the wide view or big picture of the 1 min, a leading negative divergence.

 The 5 min shows accumulation this a.m. and negative divergences from the resulting move up.

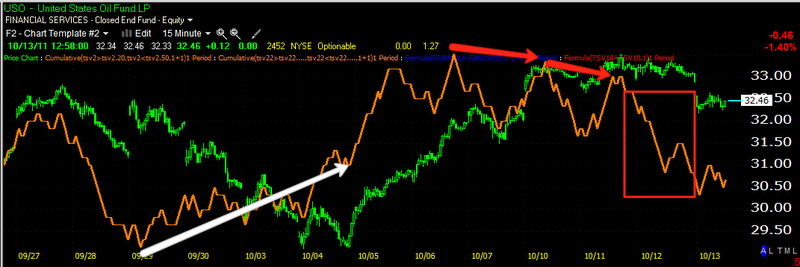
 The 15 min wide view shows GOOG at a new high just about, but 3C is lower then the previous high. The white area is heavy accumulation that moved GOOG up.

 Close up of the 15 min chart shows price moving up and 3C flat.

 The 30 min shows a very big accumulation area at Oct 4-5, but again, 3C is not making those new highs.

And one again on the 60 min, a leading negative divergence.

Now in a lot of ways this mirrors the market (A rising tide lifts all ships), I would prefer the market looked totally different, but it is what we have. Lets just say that based on this,  would not buy GOOG for an earnings play, nor would I want to hold it long.

Market Update

 DIA 1 min with this morning's positive divergence and the negative divergence that caused the last pullback, generally speaking, the divergences will start on the shortest timeframe and then as they get stronger move to the longer timeframes, so if this 1 min chart falls apart more, it will start to effect the 2 min chart, if that falls apart then we'll see weakness on the 5 min chart. This process already happened as far as the positive divergences this morning.

 DIA 2 min with an early positive divergence and in line trade.

 The 5 min is still strong intraday and I would still expect intraday upside until this goes negative.

 IWM with 2 different intraday accumulation points on the 1 min chart, but the 1 min chart is looking negative now and it is at best consolidating sideways, rather then making a new intraday leg higher.


 IWM 2 min chart with the early pos. divergence and a leading positive, however, there's a little more downside on the right side of that leading divergence in the box.

 IWM 5 min chart also in a positive leading divergence intraday

 QQQ 1 min is starting a negative leading divergence

 The 2 min has as well

 And there's a 5 min relative negative divergence. Again, if the 1 and 2 min continue to deteriorate, the 5 min will.

 Here's the updated SPY 1 min

 SPY 2 min

SPY 5 min


Short Term SPY Update

 SPY 1 min negative relative divergence halts the advance

 Same on the 2 min

However the 5 min is still leading positive intraday and until that changes, I would think there will be more intraday upside into the gap.

Getting ome market movement

There's some momentum intraday as the market moves toward new highs on the day and there's a bit of volume there. I still need to check the options chain for a possible expiration pin tomorrow.

A couple of hours ago, as predicted, Slovakia passed the vote on the EFSF and as I alluded to, it looks like they'll be getting a new government for doing so. When this first became an issue I said that they're a small country, susceptible to bribes and other things.  I'm wondering how much campaign cash the opposition groups received from some EU entity so they would cast their votes for the EFSF and thus, have a chance to finally move from the minority to the majority.

There has been some movement in the Euro since the vote was passed, which of course relieves the bearish tension in the market and should effect oil and some other commodities positively for however long this lasts. I think the last semi-rhetorical question I asked about the day that this vote would be passed, which wasn't in doubt, was "Sell the news?" We'll see. For now, it's time for the knee jerk dance.

 EUR/USD 1 min from about the time the vote was passed, the best I can tell.

SPY 5 min which has shown some positive divergences suggesting an intraday move into the gap.

USO Update

Yesterday morning  posted, "Long USO? Better Be Careful"

Today, she's lower and the warning signs were there, as a matter of fact, I included charts of the Crude Short, SCO.

Let's take another look...
 USO 1 min went in to a sharp relative negative divergence yesterday when I first posted in the morning there was trouble there and then in to a worse leading negative divergence. Right now it's trading about in line/confirmation of the trend, with 3C.

 The 2 min chart shows numerous little accumulation and distribution areas going up, but that leading negative divergence in the red box, especially yesterday, was an ugly sign for USO, again currently trade is roughly in line.

 5 min on the move up we have 3C higher highs with price/confirmation of the trend (green arrows) and the last 2 days a nasty negative leading divergence, nothing has changed since as far as 3C signals.

 USO 15 min shows very strong accumulation (white arrow) and distribution in to higher prices, then a leading negative divergence, trouble was clearly foreseen by Wall Street.

 USO 30 min, another leading negative divergence-the strongest kind of divergence and on a long chart like 30 mins is a big warning that something is not right.

Even the 60 min is lagging now.

I don't personally have a problem being short Crude here with something like SCO, although any intraday strength would be great as an entry point.

GLD Update

I know for sure in the last GLD update we talked about a pullback.
The daily GLD chart with the long term 150-day moving average, which over the last 2 years has been an excellent low risk buying area. However, I said that I thought GLD needed to consolidate along the moving average and hold it because it fell pretty hard getting there. Recently GLD (the last 3-4 days) has been a little high and away from the consolidation zone, so a pullback to the m.a. has been expected


GLD 1 min shows a negative divergence yesterday, a positive relative and leading divergence on the open this morning, sending it a bit higher into the gap, however, the 1 min is now going negative again, suggesting it likely won't fill this gap today.

The 5 min GLD chart shows a previous negative divergence and prices dropped a bit (that may have been around the time of the update in which I said it looks like it needs to pullback/consolidate), however it moved higher on a weaker $USD and formed an island top yesterday, which was leading negative. The 5 min chart also shows an intraday positive divergence (white) sending it off its lows.

 The 10 min shows the distribution these last several days as it remained out of the consolidation area below. There's what appears to be a positive divergence, however I suspect the 10 min chart just hasn't moved fast enough yet and I doubt that holds.

 The 15 min chart as well has shown distribution in to these elevated levels away from the consolidation, a leading negative divergence. In the white box you see the Island top, which in my view was also a type of head fake/bull trap as it made new local highs.

 The 30 min chart, showing a good accumulation period which I believe is part of the consolidation, however, I also believe that gold prices reacted to the weak dollar and were pushed higher. It appears this strength was used to distribute in to, and also to help move GLD back to the consolidation area below.

The 60 min chart looks quite negative the higher prices move from the 150 day moving average. If GLD does hold the 150 day and it is so obvious now (buy the 150-day)  that I wouldn't be surprised to see Wall Street try to pull off a head fake with a break below the average, however, should it remain strong, it seems like this 1-2x a year opportunity may be being used to load up on GLD shares on the cheap by Wall Street and others.

SLV/Silver Update

 SLV 2 min with several positive divergences (white) and negative divergences (red), the latest is a leading negative divergence in the red box.

 SLV 5 min a relative negative divergence.

 10 min again with accumulation/distribution -right now the 10 min is pretty much in line with a move toward a leading negative divergence.

 15 min accumulation areas (white) and currently in line with prie (green)

 I believe we talked about this in the last SLV update, the 30 min chart is showing negative divergences, in the yellow box is what appears to be a trading range/base that is underway, so it seems SLV is accumulated near the bottom of the range, sold off to bring it back down when it gets too high in the range. So this appears to be a larger base under construction.

The 60 min chart would tend to confirm this with solid positive leading divergences.