Wednesday, May 16, 2012

Overnight Thus Far

 The negative divergence in the $USD which grew worse today got me looking at the Euro after hours and I noticed a small bullish consolidation. The point I was making when I said it was small and hardly noticeable is not that it was hard for me to find, but that obvious technical patterns like an ascending triangle often get manipulated in the short term, this one was small enough that I didn't think it would be manipulated and it looked promising (it's in the green box). Since noticing the pattern that only showed up AFTER the market closed, it has moved higher, crossing above where the ER/USD opened this morning at the NY open at 9:30 and it's not too far off the intraday highs at the red arrow.

 Over the last 2 trading weeks, as pointed out earlier today, there have only been two breaks in the down trend that could produce a small base from which to rally from, the first was right after the break of $1.30, the second has been over the last 2 + days.

 ES isn't flying after hours, but the stronger Euro/weaker dollar is helping ES move up, the red arrow is the 4 p.m. close.

 On a longer chart there's the possible formation of a "W" bottom, as most of you know, "V" reversals aren't very common, it takes time to set up a bottom which requires shaking out positions. This is a decent start to a short term "W" base that the market could work higher from in the near term.

 The 15 min 3C ES chart shows the 5/1 negative divergence or last top and a 15 min leading positive divergence, there are similar patterns in the market averages such as the 15 min QQQ and 15 min SPY

 QQQ 15 min, similar divergence to ES 15 min with a negative through the 5/1 top.

The same in the 15 min SPY

 As for longer time frames in ES, the top area is clear on this daily chart with a leading negative divergence-this is the ugly longer term trend and bear market I expect to continue to develop although a bounce is still in the cards.

The longer term 3C ES weekly shows the 2011 top and the leading negative divergence that is worse at the current top, this also parallels many of the market averages, Industry groups and key bellwether stocks.

If the concept that we have seen so often that it influences when and how we enter shorts, is still alive, then we have the key breaks of support needed to get one final shakeout move underway.

Breaks of key support levels in the majors...

 SPY

 DIA

 QQQ

IWM

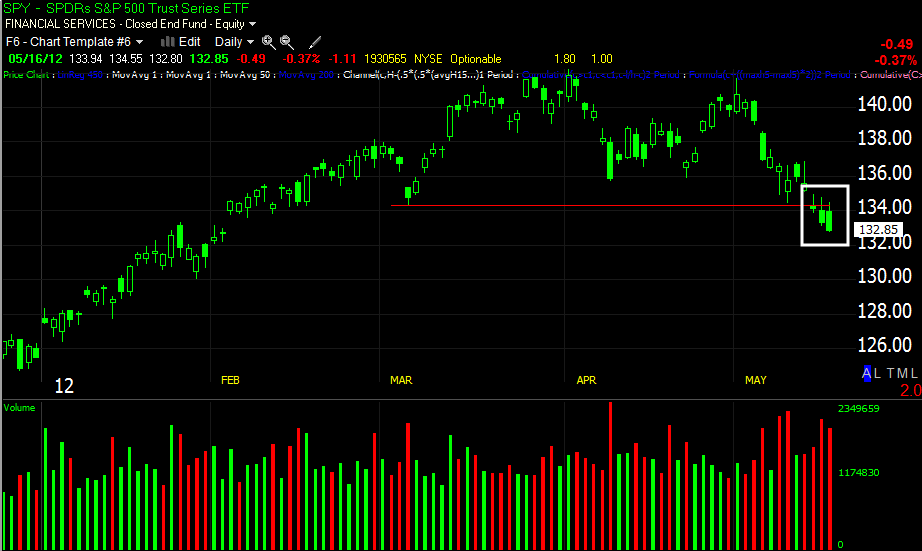
12 years ago it was a no brainer to short a break of support lie this, once in a while we'd see a failed test of resistance that offered a second chance shorting opportunity that was often considered to be lower risk as you could still short some strength, but use the resistance as a stop. Wall Street caught on to the game pretty quick as technical analysis went from a voodoo art to main stream as the internet offered automated charting, cheap online brokers and DIY investors looking for an easier, less time intensive way to analyze stocks, thus the flood in to technical analysis, but with that came the predictability of what traders would do which Wall Street adjusted to, technical traders just keep doing the same thing. This is one reason we see strong short squeeze rallies when key support is broken.

Other reasons for the head fake moves and I believe (we'll have to see if I'm correct) the Euro didn't shape up until after the market closed as to not ruin the head fake move. Back to the point, there's a lot less retail money in the market now, there's less institutional money as whole continent's like Europe have sold assets to try to recapitalize their banks. Th flow of funds data has shown retail investors moving out of domestic equity funds by the billions every month. Thus one of the reasons for head fake moves is that they are self priming without the need to invest too much in to a counter trend move to make it work. When the market breaks key support the longs are stopped out, the shorts enter en masse (we are already at 2012 highs in NYSE short interest as of last week and you saw how many puts there were in the SPY options chain vs. calls), a move back above resistance is usually where retail traders place stops, in this case "Buy to cover" so the first move above resistance will cause the start of a short squeeze which feeds on itself as demand via short covering causes more shorts to cover, thus we get a strong momentum move up with minimal need for Wall Street support. If the move is strong enough, what' left of the "Buy the dip crowd might even come in the market. Just the same as we see downside head fakes, in nearly every bounce we have played over the last several months, almost every one has ended with an upside head fake move, breaking above a resistance level or setting a new intraday or closing high. Longs that come in to the market are caught in a bull trap as it reverses back down and momentum once again snow balls.

If we do get this one last bounce, don't be surprised to see a move  lot stronger than you'd anticipate. There are reasons for these head fake move and reasons for these bounces, if thy can't accomplish a certain level of emotional capitulation, they aren't worth running as each one, as we move closer to the edge of the cliff, becomes more dangerous as a counter trend move.

I may be getting a little ahead of myself, we have some interesting charts, the start of a decent move in the Euro, a change in character in the trend from down to lateral as seen in ES and the Euro above and a small, but decent move in ES tonight in what is potentially a short term bottom. Like I said, I don't want to get too far ahead of myself or the market, but there are certain trends we have observed time and time again in which retail traders get knocked out of positions, we've recognized the game and have been able to use it to our advantage as evidenced by every short in the equities portfolio already at a respectable gain and we haven't even really broken free of the Stage 3 top, much less entered stage 4 decline where the real money is to be made.


EUR/USD

With the 5 min UUP ($USD) chart looking like this, I'll be watching the EUR/USD pair pretty closely tonight

 There has been 5 min 3C confirmation in UUP for weeks, this divergence, most of which was today, is peaked my interest.

Additionally, this little pattern that formed in the Euro after the market closed (a bullish ascending triangle-but small enough not to draw too much attention) is also interesting.

SPY/UUP options chain

As we have seen numerous times, the market tends to be pinned on options expiration Friday. Last month we saw (I don't remember how many contracts) a pin that was seven cents below a strike that took out a bunch of additional contract, just seven cents! 

For the most part, retail traders buy calls and puts whereas professionals write them, the juice is in writing contracts as the premium and time decay benefit the writer. The majority of options contracts will expire worthless and as mentioned, the market often looks for the point of maximum pain and targets that level to make the most amount of contracts expire worthless.
Below are the SPY Call and Put options chain for May expiration Friday.

SPY Calls


SPY PUTS


Just some quick math, although I know the open interest will change as it changed dramatically over 2 days just before April expiration. However between $130 and $136, there's about 245,000 open interest in the calls; compare that to over 1.9 mn Put contracts between $130-$136. Of course we can't expect these figures to remain static or even close on any kind of a significant market move, but from where we are today, a rally of about 3% over the next two days in the SPY would just about take out 1.9 million puts just within that range of $130-$136. From this level, that would be an additional 1 million in open interest taken out. Of course I'm way oversimplifying all of this, but I'm just trying to point out the huge disparity between Call open interest and Put open interest. Assuming the puts are owned by retail as is usually the case, it would seem a swift move up would cause a lot more pain than a move down.


Just for giggles, Here's the chain for UUP for May and below for September where a huge number of calls were sold at $22 and $23 (I believe it was about 100k contracts in UUP sold at Sept. $23)


UUP May Open Interest Calls/Puts

UUP September Open Interest Calls and Puts-a lot more activity in September Calls

Risk Asset Layout Update

I'll try to make this short.

The Euro and the $AUD both were in pretty strong correlations today with the market, they don't offer any insight's today other than the fact the Euro has broken an important support level, is probably filled to the gills with shorts and there's a reason we don't short the first break of major support which was the $1.30 level for the Euro (currently at $1.2716), the reason is there's a long standing trend of Wall Street shaking out shorts that enter on the break of important support, the ICA trade idea today is meant to capitalize on that trend.

The GLD trade which came after over a month of analysis is another example.

You may recall we wanted to buy GLD at the 150 day moving average which has held as an excellent buy since April of 2009 with at least 9 buys at the average that all worked beautifully. September of 2011 we had our chance to buy GLD at the moving average, we passed on it as the decline from the August highs was way out of character and we suspected something wasn't right with GLD. Sure enough  large triangle top formed, the "buy at the 150 day m.a." trend was over. Some of us shorted GLD as it broke below the triangle, but we have seen the shakeout bounce too many times and while that trade made money, the shakeout move can happen a day after the break of important support or weeks after. I prefer to let the shakeout move occur and let the trade come to us, it requires patience, but the entry, the risk and the probabilities of letting the trade come to you are much higher than chasing the trade. GLD was a great setup, we stalked that trade. We saw the 3C weakness in GLD above the horizontal trendline representing the triangle's apex, but also saw a clear resistance area and had a good feeling GLD would make a head fake move above that area (white trendline) which it did and we placed or Put trade at the white arrow for a +215% return in about 3 days. I closed the trade because I was using options and I want to exit options trades as soon as possible with a reasonable gain. GLD was choppy over the next month and while hindsight is 20/20, we live at the right edge of the chart.

This is the same concept as the Euro breaking the $1.30 area, probabilities are it stages a short squeeze shakeout. I do feel the day will come in which the character of that trend changes and is no longer reliable, but with short interest so high, I'm not quite sure we're there yet and if we are, we still should all have decent short coverage.

The $AUD has seen a fierce downtrend since late April and the $USD an equally fierce uptrend, nearly parabolic. We know the market is like a pendulum, swinging way too far one way and then way too far the other, over the years I've tried to pinpoint where I think a move will reverse and then double that as that is the nature of the market, it has to be as the market in its simplest form is Fear and Greed, the further the market can stimulate those emotions, the bigger the swings are.

Yields which are like a magnet for stocks (and often give excellent divergence signals before a turn in the market) are now flashing a bullish market signal, this has been a very reliable leading indicator.

For example, Yields failed to confirm the SPX's higher high at the red arrow, the market dropped. At the red box, yields were leading the market lower, the market dropped, but the last 3 days they have put in one of the largest positive divergences I have seen, I believe this to be supportive of the market, supportive of a short squeeze shakeout.

XLF and XLE's momentum relative to the SPX was in line today with Energy looking worse than financials, at the end of the day Tech diverged positively-you saw the EOD move in AAPL.

High Yield Credit has held in a range for 3 days now, not making lower lows with the SPX, Credit leads, equities follow. I still have some concern about the quality of Credits' signals with all forms of credit being effected with the JPM situation.

High Yield Corporate Credit (HYG) moved with the market today, long term it is flashing major trouble signals, however between 4/10 and today, the SPX has made a new low, HYC Credit has held at the 4/10 support level and hasn't made a new low. Because of its liquidity and relative cheapness, HYG is being used more in credit markets so my concerns over JPM are even more valid there as there are many situations that can effect HYG prices that have little to do with the normal correlation of HYG and thus effect its usefulness as a leading indicator, we just don't know to what degree HYG is caught up in the various schemes related to JPM. For now, all I can cay is based on what is observable, HYG is more supportive of a bounce than not.

Commodities held up very well today (DJP closed up +.76%) vs the SPX and vs the $USD correlation. Similar to Yields, commodities stabilized on Monday and have been trending up in  positive divergence the last 2 days (closing up .51% yesterday and more today). Again I have to ask the question, "Does someone know something we don't related to the Euro/Dollar that will positively effect the market?"

That's about it for Risk Assets, our version of Context. Speaking of CONTEXT, as mentioned, early in the week the model for ES was DEEPLY negative, that's not the case now.

CONTEXT is actually supportive of higher ES prices; at the start of the week it was about as negative as I've seen it.

Keep in mind as well, ES broke its 50-day moving average yesterday, while many traders see this as bearish confirmation, we have seen it used against them so many times that you almost have to expect a shakeout in ES. This all goes back to Technical traders doing the same things they have done for nearly a century, the problem for the is that Wall Street knows exactly how they think, what they'll do when presented with a price pattern or the break of important support/resistance and Wall Street uses trader's predictability against them, so much so that most of our successful trades have been in some part based on this concept alone.

More to come...

Explanation of GOOG Trade

The GOOG equity model portfolio short position I started today runs counter to the idea of a final market bounce as GOOG would most likely move higher with a market bounce like most stocks so I just wanted to address the seeming contradiction of shorting GOOG today while still leaning toward a final market bounce that would likely send GOOG higher.

Lets not lose sight of the goal. Early in this top there was a bunch of chop, we had good signals but a move up rarely would last more than 3 days; it made no sense to try to play an equity long that might make +3% on the choppy bounces, so we used options on otherwise good long signals, but trades that otherwise didn't have enough profit potential. I view any trade as risky, look at the MBS market, that would seem to be a low risk trade with real property backing up the investment. So if I'm going to commit to a trade, I want the best return possible for taking the risk of entering the market.

We did very well with those trades, from the ones I placed they ranged from +7% to +244% with most averaging +30%-50% in 2-3 days and when the bounce was ending I (and I know a lot of you) started building short positions in equities - NOT OPTIONS (except a few cases). My personal preference is to phase in to these positions generally in 3 parts, leaving room to add to them at potentially better prices as well as committing more to the trade the closer we are to the actual break to address opportunity cost and general market risk.

 The reason I used equity shorts rather than options is because I expect a longer term downtrend (what we have seen since May 1 doesn't even scratch the surface of the potential downside) and I don't want to deal with expiration pins, time decay, etc. All of the equity shorts I started are pretty much maintenance free, I may look at them once a week unlike options which we had to keep an eye on everyday.

While leverage and the gains in options is exciting, I personally don't care to be over-leveraged. The options trades made sense for the conditions in the market, but the equity shorts are meant for a different kind of market, one that is more of a trending market, so that's why there has been a transition from using a lot of options/leverage toward building positions for the next stage of the market (stage 4 "decline"). Leverage cuts both ways and our longer term market analysis suggests we'll be just fine with equity shorts which can make more than 100% contrary to popular belief as I have shown you in the article I wrote, (which is linked at www.Trade-Guild.net) "Making More Than 100% in a Short".

For my larger view analysis of the market, I have no use whatsoever for a market bounce (even though I initiated a few small spec long positions which represent very little risk) except for the opportunity to fill out a couple of short positions (BIDU is at 50% of the intended position size; CAT is at 50% of intended size; PCLN is at about 85%; AAPL is at 85%; XOM is at 65%; BEAV is to big at 125%; GOOG is at 100%) and I need to add a couple of Industry groups like Financials.

So while I would love to see a bounce to get the best positioning with the least risk and excellent probabilities, the goal is to fill out the short positions, the spec long plays are only a minor concern as they are so small being they run counter to my market view.

Adding GOOG today allowed me to short in to price strength in what is a higher probability short and I was able to do it with about 1.2% risk. If GOOG moves higher, it will still be in what I believe to be a head fake breakout just like the GLD trade that we used puts with for a nearly 215% gain in 3 days or so,  it stayed above resistance in a head fake breakout for 6 days, BIDU was in a head fake breakout for almost a month. If I have to cover GOOG I don't envision (even with a gap up) having a portfolio loss of more than 2%. I'd actually like to be able to short GOOG higher, but again the entire point of looking for this final bounce that shakes out shorts and would likely be a volatile move, is to fill out positions for the end game. GOOG's risk made sense in moving toward that goal.


Interesting AAPL EOD chart...

 As AAPL broke lower the 1 min chart moved higher all day until it was leading and AAPL responded the last few minutes-granted, not the big trend, but interesting.

The 3 min intraday similar to others recently pointed out is in line with price for the most part throughout the day, the chart went positive before AAPL moved, the first real divergence on the chart for the day.

After market we'll also look at the options chain

QQQ Charts...

 QQQ 3 min trend

Like the SPY chart before, the inline nature of this 3 min chart is valuable to me as it transitions to a leading positive at a break below support and in a flat trading range at the divergence.

GOOG Update

I'm holding on to the GOOG equity short as my risk there is 1.2% at $630, so even on a gap up I'm still around or below my 2% risk.

As for GOOG as it has developed through the day...

 As GOOG approaches the intraday highs, the 1 min chart lead lower

 2 min leads lower

 3 min (as the progression should take place) leads lower

And the 15 min chart has a pretty big move for the timeframe today.

Most of all the risk level allows me room.

Market Update

This volatility is making an absolute mess. However the Euro is still holding within its range, UUP is still doing what it was doing yesterday...

 2 min intraday

5 min today

The flight to safety trade, TLT looks like this...
 TLT intraday 1 min saw a parabolic move up, the only reason I can see for that is to possibly set up a head fake bull trap as 3C in divergent in to the move.

The longer term 15 min trend is negative and you can see the move above yesterday's close.

The SPY/DIA are still within the range area, almost flat on the day, the DIA is up a bit.

I'm sticking with the same positions, the same near term opinion and of course the big picture hasn't changed a bit.

Still looking at a ton of charts.

I'd love to look at the Risk Asset Layout, but there's not time before the close.

Quick look at the SPY...
 This intraday chart of the SPY (2 min) is valuable to me as it has been in line with price almost all day, at a lower low 3C is higher and for the first time on this timeframe, it's moving positive.


The next timeframe (3 min) has stayed in a leading positive area as the SPY broke intraday support.

I'll be posting more charts as they pop up, but I don't see enough to shift my opinion considering the volatility today of the minutes.


Smoke may be clearing a bit / UNG

It looks like the initial knee jerk volatility in the market may be clearing a bit, but in the mean time, most of you know there are only 2 long term longs I would consider in this market, 1) URRE I think is still in the basing process, the other UNG, we have recently looked at and felt something was turning there. I'll cover it in greater detail later, but a member reminded me of it and it's smoking today.

The last time we looked at UNG it was forming a triangle that looked like a breakout was coming. UNG is p over 5% today.

For those of you who are in UNG (and probably have been for some time), congratulations. For those who are interested, I find it hard to chase on a day like today, but it did break out through a trendline I've had in place for almost 2 months and the next area will be around the $20 level.  If you were interested in UNG as a long or hedge trade, I think I might give it a few days and see if it will pull back to the 10-day moving average.

We'll take a closer look at UNG and URRE later.

F_O_M_C Volatility-GLD as Easing Sentiment Indicator

As is usually the case, lots of volatility around any major F_E_D event, often there are knee jerk reactions that are reversed, sometimes that day, sometimes a day or so later, the policy statement usually sees more intense knee jerk reaction, but the minutes are a close second.

As for GLD/gold which is one of the biggest beneficiaries of easing as the $USD is diluted by printing (remember this also is a suspect event around the Euro action from earlier), the minutes thus far don't look too different from the policy statement, but this is what QE hopefuls are attaching on to:

SEVERAL ON FOMC SAID EASING MAY BE NEEDED IF RECOVERY FALTERS


and


MOST FOMC PARTICIPANTS SAW INFLATION SUBSEQUENTLY AT-BELOW 2%


The first is obvious, the second is almost a pre-requisite to more easing as easing has been inflationary.


GLD Initial reaction...
GLD like many market averages made a move below several support levels (although the GOOG trade is based on a larger head fake move, we see them on every timeframe before a significant reversal (significant is obviously relative to the timeframe).


The first reaction at 2 p.m. as the minutes were released was a big bar up on large volume. Gold tends to be a good indicator for sentiment toward easing. We'll have to let the market settle in a bit, but this may give us some answers.


Link to F_O_M_C Minutes

Link to the minutes

GOOG Charts

I don't have a lot of risk in GOOG with an intraday stop (depending on how it looks, I may look at a closing stop) above today's intraday highs of $630.10, it represents about 1.2% risk.

The charts...
 This is similar in concept to the GLD Put trade that made 215% in a couple of days, GOOG resistance is very defined, the breakout today above that resistance looks to be a head fake move. If GOOG moves higher, I'll close the position and look for a better entry at a higher price.

 I wish I had seen this earlier, but I still probably wouldn't have acted on it until the 1 min chart started leading negative in GOOG.

 The 2 min chart, there is no nearby positive divergence for today's breakout.

 On the 3 min chart there's a positive divergence, however this looks to me to be a divergence like we saw in GLD meant to push GOOG through resistance, ultimately trapping bulls.

 The 5 min chart negative on the breakout

 The 15 min chart with the resistance area, the positive divergence to push GOOG through it and a negative divergence on the breakout.

 The larger picture on the 60 min chart, the yellow arrow is today, a suspected head fake move, even if GOOG moves higher from here, I'll likely short it again as I'm keeping risk low until I get the position I want here.

If Goog moves through today's intraday highs, I'll likely cover unless there's something really standing out, and look for a higher level to short it at. By keeping the risk very low at 1.2% of portfolio w/o margin, I can afford to take a couple of stabs at the position until I get the entry I want.

Putting in an Equity Short Order For GOOG

There will be an intraday stop above $630.

3C/ES is gaining momentum fast


Market Update-Finally

I've been waiting for some sign/signal to put out a market update, something that looks like something is finally going on, we have some hints finally.

 ES has put in a decent positive divergence and now a leading positive

 IWM 5 min has a decent 5 min positive in place today

 QQQ 1 min is very obvious

 That has bled in to the 3 min chart

 And now moving to the 5 min chart

 SPY 2 min is relative positive, I get the feeling though this is about to break higher (3C).

 3 min positive divergence after an earlier negative divergence around the time of the ECB news.

 SPY 5 min is moving toward a leading positive

 FXE 5 min has improved quite a bit

While UUP 5 min has fallen apart even more...

Perhaps this holding pattern is in anticipation of the F_O_M_C minutes due out in less than 45 mins.

As usual, be on the look out for typical f-e-d related initial knee-jerk reactions.