I've been putting together breadth chats for a post, but I think I'll save that for this weekend and instead focus on today.
However I do want to touch on some issues related to options expiration week, this data is from the SEC and CME and should be thought of as generalities, but I think it may have some relevance on trading this week.
As a rule of thumb stocks are more bullish during op-ex week and generally don't do as well the following week. A study found the correlation to average a 1% return the week of options expiration and a .04% return the next week, so there is a trend of over performance op-ex week and under performance the following week. To exacerbate this, stocks will generally under perform during bull markets during op-ex week and out perform during bear markets.
Another rule of thumb is 2 days before op-ex Friday, the market under performs and we saw a down day Wednesday this week.
Generally op-ex week is directionally neutral, that's pretty much what we saw this week- from Monday's open until Thursday's close (excluding op-ex day-Friday) the return for the S&P-500 was at a slight loss of about -.75% so as you can see, until Op-Ex Friday, the market was basically flat.
Op-Ex Friday experiences increased volume and generally volatility especially the last hour as traders unwind hedges and if traders exercise options, they often are going to buy those stocks. This last hour of increased volume, also causes institutional money to become more active as volume and/or demand/supply is what they need to get the prices they want. Keep all of this in mind as we look at the following charts.

Here's the ES futures on a 1 min scale. They were lifted overnight creating this mornings gap because the European bond market was seeing increased yields because of the fear of contagion and worries over this weekends Finance ministers meeting. The European Central Bank stepped in to the bond market for a 4th day in a row starting around 4 a.m. EDT and started buying Italian bonds to halt the slide and increased yields. This is what set ES futures on fire before the open and caused our gap up. Remember what I said about volume in the last hour and note as well the volume early today, also note the 3C negative divergences in the morning which pared the gains of the day in half by the afternoon and more distribution in 3C on rising volume and stock prices during the last hour. This is exactly the kind of environment Smart Money uses to distribute, whether it be selling or short selling. The first divergence played out, the second (all things being equal-we do have a major announcement this weekend out of the EU) should cause downside early next week.
In fact I've been researching and paying attention to how much each pip in the Euro effects the market and what I've come up with is 1 pip= about 2 Dow Jones 30 points. I mentioned, as you will see later in this post, "it seems like someone is trying to hold the market up". The rally that started around 2 p.m. to the lose, broke down like this. From 2-3 p.m. there was a 37 pip move in the Euro, that should equal 74 Dow points, the actual number was 64, but lose enough. The last hour (which I made the comment during) saw a 33 pip move which should have lifted the Dow by 66 points, this time it lifted it by only 44 points. As mentioned, I felt the market was under pressure to be lifted although you wouldn't think that by price, but later the Tick hart will show you what I mean.

Here's after hours activity for the SPY, considering today was a Technical breakout and there was a lot of momentum in to the close, I find it strange the SPY in the thin AH market could only manage a .10% gain (as of this capture around 6:30), however as you an see, there was a negative divergence in effect during the after hours session. Again, whether it was because of a pin or something else, the last 2 hours of market action seemed forced. Again with that type of momentum going into the close, the very thin after hours market should have been on fire-the final close was +.20% with an even deeper negative divergence.
This is continuous SPY trade (including premarket and after hours) on the SPY-4 hour timeframe. The divergence right now is similar to the divergence that sent the market much lower.
This is the weekly continuous trade in the SPY. Note the previous times we had the2009/ 2010 consolidations leading to the next leg up, when that leg started, 3C was moving up compared to now it's not only moving down, but leading negative.
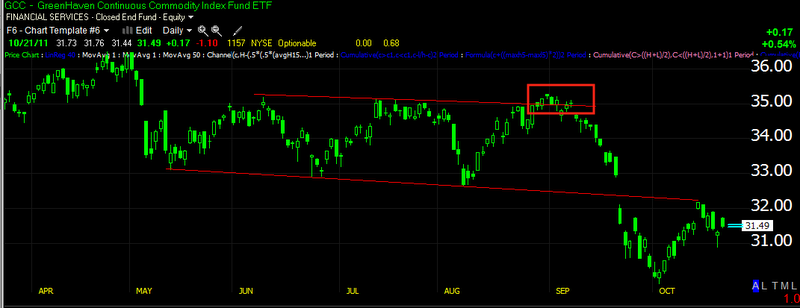
I posted a chart last weekend that looked almost exactly like this and asked whether the market was going to follow the same pattern as the CCI (Continuous Commodities Index)? We'll come back to this, but considering that volume is normally heavy on a day like today, volume should be nearly double on a breakout, instead volume came in lower and although the gap added most of the gain from the ES futures, the actual candle today is quite small, contrast today's price candle to each of the candles that started a new move up within the consolidation, those candles are 2-3 times the size of today's and this on a technical breakout?
This shows the volume pattern in the market today (1 min scale)
As seen in ES, 3C on the SPY also showed signs of distribution into both higher volume environments. As I always remind you, for institutional money to sell/sell short, they need demand and volume to enter their large positions. I find it interesting that there was distribution at both areas.
It is clearly evident in the IWM as well
And the DIA, which ended the day leading negative.
The clean trend from 2-3 p.m. can be seen in a clear channel in the TICK index, the mess at 3 p.m. s what caused me to think there was something going on in the last hour as the TICK oscillated between -1000 and +1250.
Back to the pattern mentioned earlier in commodities or the CCI which I posted last weekend, it looks very similar to what we see in the market today, after the head fake false breakout, CC fell 14% and it trades at a beta of about half of the SPY. Also note the daily signal on my Demark inspired custom indicator gave a daily sell signal.
Here in the SPY we have the exact same pattern on a shorter time frame and today, for the first time since early August, we had a daily sell signal on my custom indicator, only the second signal seen in this indicator since the start of August.
I'll bring you the breadth posts this weekend. Have a great weekend.