Thursday, March 28, 2013

Futures Charts

First of all, the theory was right, perfectly right. It's no coincidence that after 2 trading weeks of being about 0.20% away from the SPX new high, that it was pulled off today with the Dow, before a 3 day weekend and will be splashed all over the news so when people return to work on Monday and have to make decisions about allocations to IRA's, 401ks, mutual funds and the like, they have had 3 days of brainwashing to get the greed effect burning strong, this is exactly what the theory was, this is exactly what happened.

I'm not going to go in to the flight to safety by smart money across the globe, but everywhere in our market, they obviously are prepared for something and those somethings are what they love to hand off to dumb money just like they did in 2007 when on the new high and last high, CNBC was pushing the book, "Dow 20,000". The playbook is simple, the house wins, the little guys are left holding the bag, over and over and over.

As for the futures, interesting, VERY little 3C movement ANYWHERE other than what had been set up earlier in the week so since none of those divergences were crushed as very little happened, I see no reason to change course as the winds haven't changed anything.

CONTEXT and SPY Arbitrage both show risk assets running the other way as both went higher this afternoon. I'll know more about this after an update.

CONTEXT was positive when it needed it, during the overnight low volume ramp (the easiest time to do it) and during the morning when some bad US economic news hit the wires, after that, risk assets moved off in a different direction than equities.

 SPY Arb is similar, positive during some negative reports and then again around $1.30 when the SPX previous highs needed to be pushed through.

Remember the strange divergences running straight up, I couldn't find what was causing them so I was left to the only other answer, smart money knew something the rest of us didn't and that was, "We are taking the SPX to the new high" .

 ES 1 min was in line most of the day, the only exception was that leading positive divergence that kept getting stronger. See the last chart at the bottom of the linked post, the updated ES chart that was moving so fast that I had to recapture it while I was writing the post.

 ES 5 min is starting to move toward the reliable short term 5 min option trade negative divergences, it needs some more price upside which dumb money can give it and a worsening divergence, I think it will happen based on other charts.

 NQ generally in line all day except for the time when it was also leading.

 NQ 5 min is a lot closer to that 5 min negative divergence (Buy QQQ Puts) signal, this is why I think Es will follow. Smart money wants dumb money to enter so they can hand off shares or sell them short, it should all show up in 3C.

 TF/R2K 1 min also in line

 However 5 min is much more negative

 I couldn't get a feel at all for the EUR/USD so I had to look at the single currency futures, the Euro above is negative.

The dollar is positive, not the best divergences, but I'd guess the EUR/USD sees more downside, less support for the market.

Still, even though we saw through Wall Street's trick even when futures were at overnight lows, the best is yet to come, it's the movement from risk assets to safe haven assets that is truly staggering.

I still like the short term and longer term positioning in options and the longer term positioning in equities, I think they are right on track now that what we suspected would happen actually did happen.


AAPL/GOOG Volume

AAPL has shown a number of unique signals today, the kind in which you often see in low volume environments and they are sharp on short term charts, but accrue on longer term charts, like a number of small transactions all accruing to one larger.

Volume at the end of the day was pushing pretty high and price was moving with it, this I believe was right out in the open buying (thus it pushed price), but it was so late in the day that it wouldn't matter if HFT's tried to front-run the order, the order was for a specific amount, they knew it would push price, but not so much that it would be a problem.

To a lesser degree the same happened in GOOG, I feel better holding the short term calls over the weekend than I would have I closed them, I think I'd be regretting it right now.

Futures Update/ Plans

Since today has some interesting signals like the leading positives that pulled the market north, yet in short term charts only and there isn't much beyond that (signals are like the price action of an op-ex pin), I'm going to leave everything as is because when those positions were put on there were clear signals, I trust them more than I trust the lack of almost any signal today (although AAPL is showing some unusual short term behavior.

I'll post futures charts next

GOOG AAPL

Let's not forget today is also options expiration for weeklies being the market is closed tomorrow and on op-ex days the movement outside of a pin tends to come at the end of the day once most people have wrapped up their options.

I see signals that are specific to today in both GOOG and AAPL on the short term calls, I'm watching them carefully for movement in to this last 30 minutes.

The Deadline has come and gone

Good thing the SPX was able to take out those highs because trouble is dusting up all around Europe.

The new safe haven in Europe? It was Swiss 2 year notes, I guess everyone came around to their sense, knows who runs the show and bid 2 year bunds in to negative yields, they are paying to lend money! That's a flight to safety, it's happening everywhere around us as the SPX celebrates, but the real deadline is Bersani failed to cobble together a coalition government in Italy, today was the deadline and he failed.

For a while a Goldman Technocrat will probably rule, but new elections and the rising star that is Grillo  is set to disrupt not only the deals Italy has struck with the EU, but may indeed be the real "Template" that the EU needs to worry about rather than the Cyprus one.

Last Leading Indicator Post for the Day

So far my theory is half correct or on course, we don't have a close yet and as I suspected, even on the new high, few would be willing to chase risk as there has been such a strong flight to safety. Now I think we may know why the SPX was only 2 points, a fraction of a fraction of a percent away from the new high and was held back from breaking it for over two trading weeks, it's as I said yesterday, or that's what I believe.


Either way, the new high barrier of 1565.15 has been broken by the SPX at $1567.04 right now, and look at that, it was only a +0.27% move, a quarter of a percent, NOTHING!

So I'm going to post these leading indicators, you'll see some differences between the very short term / intraday and the longer term, then I'm focussing on if, where and when any changes to core positions need to be made for the remainder of the day.

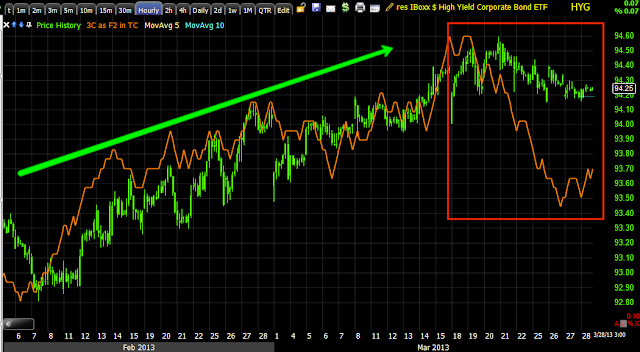
 HYG Credit has moved down enough that it seems to be far enough away from an egg thrown against the wall.

 However I believe HYG really saw the exodus of money a while back and we have seen a short squeeze and manipulation of credit to fool the algos in to bidding the market higher.

 It would seem on an intraday basis, HYG is helping the market accomplish its goal as algos read it as green and risk on.

 However 3C of HYG seems to tell a different story in underlying trade, I'd rather follow credit than stocks.

 HIO is not correlated to anything so it is a good proxy to use to see where sentiment is, it's risk off.

 Actually it has been risk off for some time.

 HY Credit is illiquid, it can't afford to be manipulated like HYG or you get trapped with no liquidity, interesting how they are moving out no ifs and s or buts about it.

 Again, I think the real exodus happened weeks ago when HY credit took out the entire years low in 2 days, that would be heavy open market selling or FEAR.

 Here's the 3C chart of HY credit, the white arrow are those 2 days I mentioned, clearly negative in to them on a 2 hour chart.

 The Euro has been disconnected from the normal SPX correlation...

 VERY disconnected for a time.

 Intraday though it was used and helpful.

 The $USD was also helpful today

 However this is the furthest thing from a natural $USD/SPX correlation-this can't be ignored.

 In white is the normal $USD/SPX correlation, in red is not normal and I think it to be unwise to ignore it, the red trendline is an area that a month or so ago looked like it might be resistance, the dollar blew through it.

 The Yen which is important because of the FX carry trade that finances stock purchases, to close it the equity position must be closes, we see that in market breadth, Japan has done everything to keep the Yen down, but to close the trade it has to be bought, so the demand sending the Yen higher despite the most dovish PM and BOJ in the last 20 years appears to be a function of the carry trade being closed.


 Yields today look helpful, they probably were, but...

 They have taken out the 2013 lows, this is a sign of a flight to safety in to treasuries/bonds as TLT has shown us on longer term 3C charts.

Here's the big picture of Yields vs the SPX, they are so disconnected now because of F_E_D policy to keep rates low through QE, but the F_E_D has to unwind the assets at some point and they are talking about it already, these two lines should once again revert to the mean and move together with each other, rates will rise, the market will fall.


GOOG & AAPL

I'm not covering these just because we have trades there, but because these are two large bellwether stocks and as such, what happens to them can move the market.

 As noted earlier, AAPL was one of the stocks included with the averages seeing an abnormal move in 3C to the upside, the way 3C works is with raw underlying trade data unlike other moneyflow indicators that average that data and thus lose potentially important data in the averaging process. For 3C to move up, the underlying flow of money needs to be greater right now than it was "X" number of bars ago, so for a move nearly straight up like this, there's a change and the answer to the question 3C asks to know whether to move up down or stay flat is answered as "Yes"

 Since the 3 min chart has done the same thing, this is interesting not because of the 3 min  chart's heft, but because of the process of migration of the divergence from a faster less important timeframe to a longer more important timeframe.

 Even the 5 min chart which has already been positioned well is seeing intraday migration today specifically.

 GOOG is doing something similar, this is the trend of the 2 min chart over weeks, it's roughly following price down and price doesn't do anything surprising, but then it breaks with price, this is what we look for.

 The same chart intraday today doing the same thing as AAPL, but AAPL started at least an hour earlier.

As far as the larger support for a move to the upside, it too, like AAPL is already there on the 15 min chart, it's not a huge divergence, but big enough .

Follow up

ES and TF (SPX and Russell 2000 futures) are now both at the 3C highs of the day, this started in the DIA and then the other averages, then the futures.

The DIA intraday chart I showed last post is also now at the high of the day, the IWM chart has added a lot, nearly double and the SPY is now moving.


I can't find much to explain it, not in TICK or a few other places, I did find something in Volatility futures, a negative and the SPY Arb has gone positive as I thought it might have been(I didn't know because of the 30 min delay).

I know rates have been cooperative, I'm not sure volatility alone would do it unless the signal was much bigger, it may be in currencies, but someone seems to clearly have known something in advance.

Something is Moving

I first saw this in the DIa and the DIA only so I wrote it off, now it's showing up in other places, it's very early and I'm not sure what is causing it.

 3C was drifting or actually moving at a pretty decent pace to the upside, since it was only the DIA, I figured it's just an anomaly, but since...

 The IWM has seen the same

 The Q's

 ES which is even stronger now, actually so strong it's not ambiguous at all like this is a bit.

 NQ has seen it

 TF as well

 And AAPL

As well as the larger 5 min already in place.

Here's an updated ES as it just moved quickly.
Now pushing to the 3C high of the day, it's even higher since I captured this a minute ago.

Something is going on

EIA Nat Gas Report

There was a draw down in Natural Gas in storage this week even larger than last week, hence the initial volatility on the release of the report, the problem is we don't know what consensus was.

Released On 3/28/2013 10:30:00 AM For wk3/22, 2013
PriorActual
Weekly Change-62 bcf-95 bcf
This week the draw was -95 BCF, more than last week's -62BCF, but if consensus expected something much different, that this could be a disappointment even though it appears the fundamentals of supply are positive for Nat. Gas.

I hope you didn't miss the article I posted last night on Nat Gas and Great Britain as the US has some of the largest Nat. Gas reserves. The Russian/EU possible spat and Gazprom doing to Europe next winter what they did to the Ukraine during the "Orange "? Revolution, would be even a greater reason for Nat Gas to soar.

Here's a loo at UNG on the report.

 PErhaps "all gaps must be filled" as some contend now that HFT is here to stay, that means yesterday's gap up and +2.35% gain leaves room for a pullback to fill the gap, otherwise the trend in UNG has been pretty darn impressive since mid-February on a double bottom.

 Here's today's intraday action, you can see where the EIA Nat Gas report was released at 10:30 by the volatility, the first move was to the upside so perhaps it was better than consensus, but this move was sold in to immediately as I'll show you (you can already see above).

 Even the short term X-Over screen is long UNG, the second pullback is usually to the blue 22-day price m.a., although a pullback to the yellow 10-day would fill the gap.

Everything looks good on this screen as a "Hold"

 Even the shortest trend channel still has held the recent trend, as a longer term position (and you can see more and more ways every month why UNG looks to be a real winner) I prefer a wider stop such as the one below.

 A weekly Trend Channel, note the weekly candles also signal a loss of momentum and yesterday's gap looks a little like exhaustion.

 Here's the 1 min chart showing the initial move higher was sold in to right away.

 However where it counts, the trend is confirmed, the chart is signaling a pullback/consolidation, but not dramatic.

The more important 4 hour chart tells the story of underlying flow of money perfectly and it is very healthy.