The facts I have been able to gather so far show a continuing, accelerating decay in the market and compared to other bear moves of the last couple of years (we've had a few 20% or so), this one in many ways looks to be the most dangerous, one of the reasons is the mass psychology aspect that so few people really appreciate. Along those lines is the impression the economy was improving, that the stock market was solid, dumb money bought it-literally. Add to that some macro data like a possible German/US recession within weeks of each other, another possible US downgrade even though they seem to be trying to stave that off by going after the S&P ratings company, a lot of European problems popping up and just the extreme nature of the moves (the market is like a pendulum, the further it swings in one direction, the further it corrects in the other-but again, as was the push of last night's post, the question is starting to turn away from correction), I think after you have watched and studied every minute of the market and every year over the last century, you just sort of get a feel for when something is outside the norm.
I don't know when I first mentioned it, but I know in this post, "Daily Wrap" on Wednesday of last week, Jan 31., I said the following...
"We had some near term records set today, for instance:
Would you believe the SPX saw its worst day for all of 2013 today at a measly -0.39% loss! I told you last night the ATR for the market has been dropping insanely and with that, volatility, but as you'll see, the volatility side of things seems to be taking on a new life."
Imagine that, a -0.39% loss in the S&P-500 was the biggest loss for the entire year up to that point, volatility was insanely low, which as I have espoused in my view, this was a custom tailored market that was VERY investor friendly. Volatility was exceptionally low, the march higher was very straight with no pullbacks to scare anyone, it's the kind of market investors who were scared out of the market, feel comfortable coming back in and they did. I continued in the same post with the following...

Followed by...

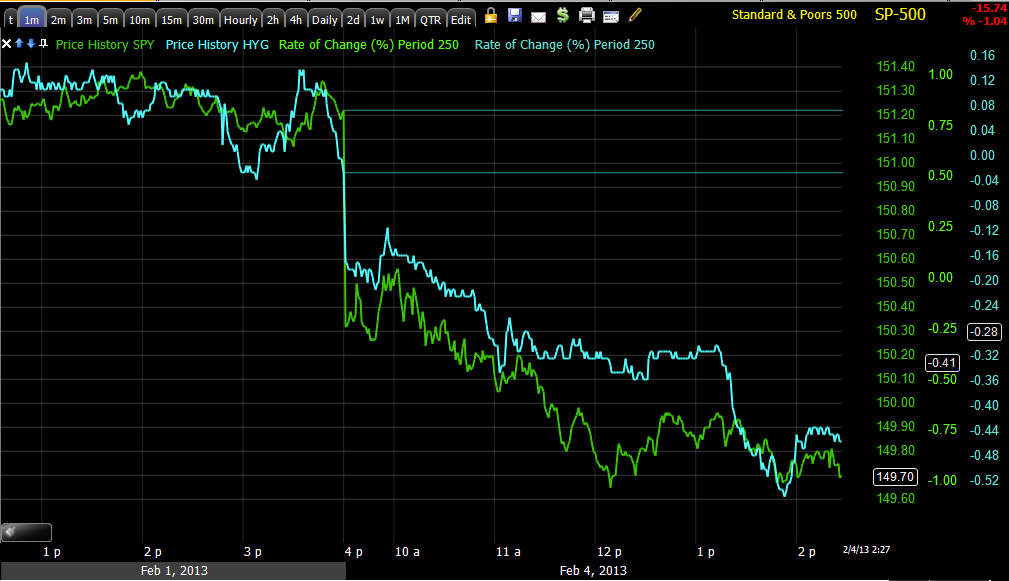
Since then, that beautiful rounding top that we know is too picture perfect to be meaningful or lasting was chopped up just like I said above on increased volatility, it looks like this now...

The rounding top from 1/25 to 1/30 is followed up by volatile chop which increased every day and made the price pattern irrelevant.
The chart with the rounding top above this one, was followed by this chart and commentary which deals again with motivations...

"First how many trends have you seen this clean on such incredibly low ATR and volatility? If that's not engineered to suck dumb money back in the market, I don't know what is: a clean trend, stable, low volatility, no pullbacks or corrections and of course CNBC trumpeting every half hour, "DOW 14,000" as if it were a movie trailer for a Tom Cruise Spy movie."
I posted more on volatility last week, but followed the post above with this one, "I told You Volatility Would Pick Up"
"I pretty much define volatility in this case as , "Huge moves both up and down that make no sense, there's no reason for them, there's no trend in them", but we see it all the time as the character of a trend changes and we have been in such a low volatility environment (investor friendly), it looks to be changing."
Last night in "The Week Ahead" I posted a variation of something known as "The Ulcer Index" which is a measure of volatility, here's the same chart with the same indicator from last night with today's updated reading.

For nearly a month the range from the low to high was .28, over the course of 1-day it increased to .54, almost double the high to low range for nearly a month, then to 59, today it went from .59 to .80 for an increase of 36% in one day. The point is volatility is picking up, why is that important and how can we use it?
As posted last week, "Because the thing that accompanies tops and bottoms of all sizes is extreme volatility, even if no new upside gains are made, it can move up hard one day, down hard the next, it keeps traders on their toes and guessing or chasing, but it almost always shows up at the end."
 The 2002/2003 - 2007 Bull market with increasing volatility toward the top.
 2008/2009 end of the bear market with volatility increasing.

"We'll see how the tone of the market looks early this week, if there's significant increases in volatility, then we have some great opportunities for 1 day (give or take) trades like the last QQQ trade except with more potential gains."
I guarantee you, trade long enough and you will come across a bull market trend in a stock or average, it will shoot up on a huge move through the average defined by linear regression os some sort of channel and shortly thereafter, once it has attracted all kinds of last minute traders chasing the gain, it will top or just dump, the opposite is true on the downside, this is why I remind members, "Price is deceptive". Here's some proof...


Low volatility in the Gold Bull market, the increase in volatility is EXACTLY why we didn't buy in late 2011 as GLD lost -20% after seeing increased volatility and an upside channel buster which appears to be very bullish, that's why few people get out early enough to avoid the downdraft, they just made a bunch of money quickly and they are emotionally bound to the asset.
Volatility is just one of many pieces of the puzzle, but any change in character should be noted, wherever yo find it.
As to how we can use volatility...
Take last Thursday's entry in to the QQQ's using weekly options that expired the very next day, the move made +56% in less than a day and this was a solid set up, not a shot in the dark as I'm very picky about the quality of signals for any options trade, but a weekly contract and one that has 1 day left on it! I had high confidence in the signal to call that trade out.
Or AMZN short Wednesday of last week, if you stuck with it beyond the initial quick trade idea...

This is a multi-day trade, but with a little leverage (options), this is a killer trade, although I'd probably be wrapping it up.
Or earlier that same day in AMZN , "This is why I said yesterday, wait for today, not the after hours trade. If you took a shot at AMZN this morning as a new short or add to you've already made 11 points and can pretty much call that a trade for the day and enjoy the rest of your day."
There were a number of other trades last week that I didn't list, a few I liked as longer term positions, but said they could also be traded short term, for instance Friday, SRTY for a 4.1% gain in 1 day, or SQQQ Friday at noon for a +5.4% gain today, FAZ long for a 1 day +3.2% gain.
We also have some Calls in BIDU which reported strong Q4 and FY 2012 results, I don't care about after hours, just like AMZN last week, it's the next day that matters. Speaking of AMZN we have some calls there too and it looks lie it's ready to rumble to the upside.

This is exactly why I'd close out the AMZN earning (actually next morning short) and why I have no problem keeping the AMZN call position open.
When AMZN's 2013 trend has such a dramatic change as volatility market wide increases...

There's a real change of character, AMZN is very dangerous to be long on a position trade, but the short term signal has a very good chance of good upside movement, taken with the options leverage, this could be a really nice 1 or 2 day gain, but longer term (or from the perspective of a position trade), I don't want to short AMZN or add to the AMZN short right here with a positive divergence on the short term charts like the one we see on the chart above this, but I do want to look at adding once AMZN moves to the upside and while we're waiting, why not take advantage of the volatility with a short term trade and make extra money?
Just doing some REALLY rough calculations, the speculative position size on equity and option trades over the last week, all of which have been short term (at least the ones I can recall), would have added 2.25% in the AAPL options trade from last Tuesday (linked above), about 3% to overall total portfolio equity with the QQQ 1-day option trade, if you stuck with the AMZN trade to the downside with no leverage, add another 1%, AMZN earnings short the morning after earnings would have added about 0.5% at speculative size and the 3 leveraged short ETFs entered on Friday which I said I like as an initial position or an add to, but if need be, the position can be simply traded, would have brought another 2.10 % to total portfolio at speculative (half size) positions. That's 9.1% added to total portfolio value (not inclusive of margin and at speculative position sizes). In most cases the trades lasted 1 day or so, the longest would have been 3.5 days.
I see a 4.21% gain in the tracking model portfolio which is loaded with position to track, but that's over the last week and puts that portfolio in 77th position of 1483 portfolios.

This is really 1 day's gains largely based on the leveraged positions from Friday (SRTY, SQQQ, FAZ).
My point her is not to encourage day trading or anything like that, in fact ever since HFTs entered the market place, they completely stripped away any advantage a day trader might have had. This is something very different.
You saw AMZN above, the volatility is increasing, the ATR (Average True Range= the range from high to low) is increasing, which can be used to your advantage with short term trades as the wider ATR provides more potential points/percentage for you to capture.
The volatility is not useful for trend trading or even regular swing trading, it is useful for these short term trades and it is very useful for tactical entries when you have a larger strategic plan. For example, AMZN making a volatile move up from here to say the $280 level not only gives us a nice chance at significant short term profits with leveraged positions like the open Call position, but also allows longer term position traders to enter a short position at a much better price point with much less risk, allowing for a larger position size.
You don't need to take the short term trade, or perhaps some of you prefer the short term trades only for the time. My job is to identify opportunities and use the correct vehicle to take advantage of those opportunities. I don't consider myself a day trader, an options trader, a swing trader, or a trend trader, I consider myself opportunistic and quick to take what the market offers, which also means understanding what the market is NOT offering at the time.
While I said above I don't identify myself as any of the above, I do favor longer term trades or trending trades, I'd say my least favorite trades are day trades or option trades, in fact I prefer not to use leverage unless it is required to make the trade worthwhile.
So I hope that clears up a little of the different trades (sometimes in the same asset the same week), volatility is increasing, it is usually very choppy which means most traders will be tossed from long and short trades left and right, but we can use that volatility to make good money on short term trades and use that volatility to better position out longer term core positions.
"Adapt or die" as they say or "Patience" as I say; I will add the caveat, "Only take trades you feel comfortable with and make sure your risk management, position sizing and decisions about what kind of trade it is and what to expect is as realistic as possible". Putting on large positions here with tight stops is a way to lose a lot of money really fast.
As for today, volatility continues to increase as we clearly see. Last week (4 days ago), the we saw the worst performing day of the entire year (2013) at a -0.30% loss in the SPX, today we saw the worst performing day of the year at a -1.16% loss, but the volatility is truly the story and just as I described it last week before it really started picking up, "I pretty much define volatility in this case as , "Huge moves both up and down that make no sense, there's no reason for them, there's no trend in them"
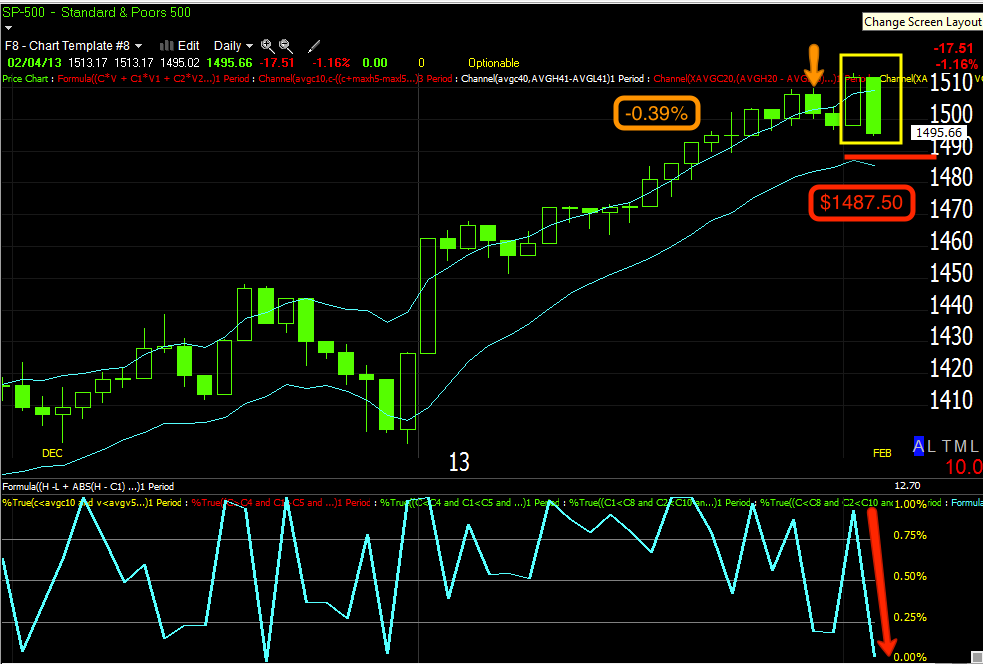
The daily chart of the SP-500 with my Trend Channel and my custom, "Close In the Range" indicator. As described above, there's little logic in these moves. Friday we have a new high which closed a few percent off the highs of the day, today we had an open EXACTLY at Friday's close and a huge intraday sell-off from there to close within a few percent of the absolute lows of the day and I expect we see another whipsaw tomorrow. The Trend Channel is starting to make its first turn to the downside and the stop is at $1487.50 on the close, then character has shifted by at least 2 standard deviations of the 10-day average ATR, or in other words, a major change of character.
The NASDAQ 100 had a more meaningful close...

I predicted the NDX/QQQ would fill the gap from the head fake day on Jan. 23rd, it did so on our Thursday/Friday weekly options trade for a 50+% gain and today closed down 1.74% for the worst close in quite a while, but more importantly, it broke the Trend Channel, this doesn't mean it will drop immediately, but from my experience in trading trends with the first custom indicator I ever won an award for, once the Trend Channel is broken, the easy money is done and any gains from here are luck for most people, they are typically not large enough to even consider staying in the trade (long) and it leads to a reversal. The daily close was something like $.27 cents off the lows of the day, for all intents and purposes, it was at the lows of the day, a very bearish close and again a function of volatility picking up.
The Dow was similar to the S&P...

The Dow closed down $130 points at -0.93% after yesterday's +1.08% gain, today also closed near the lows of the day.
The very important Russell 2000 closed down -1.31% after a +1.01 % gain Friday.

The R2K is getting close to hitting the Trend Channel stop, again the close was near the lows of the day.
S&P E-mini Futures (ES) saw their worst drop since early November...


*Now get this, Thursday we had a Dominant Price/Volume relationship as we did Friday, here's what I wrote about it after the close on Friday.
"Yesterday the Dominant Price/Volume relationship suggested a 1 day oversold condition and we'd see a bounce today, today's Dominant Price/volume relationship is the exact opposite, Price Up/Volume Down which is the most bearish of the 4 relationships and gives the opposite signal, down."
No, it's not a fancy, interesting, exotic new indicator, it's the price/volume relationship among the component stocks of each major average (so it often differs from the average's volume and sometimes price relationship itself). Thursday the indicator said the market would be up the next day, Friday it said the market would be down today, every other day we have had a dominant Price/Volume Relationship it has been DEAD ON RIGHT! This is a tool for your tool box and one that very few people follow as it differs from advancers/decliners.
Today's Dominant Price/Volume Relationship... Price Down/Volume Down across the board in a huge way. There are 4 possible combinations, to be useful the relationship has to be dominant and across all the averages.
-The Dow 30 had 24 stocks in the relationship with only 1 stock closing up (BA).
-The NASDAQ 100 had 70 stocks in the relationship
-The SPX, 324
-Russell 2000, 1082
-Russell 3000, 1678
Unfortunately, Price Down/Close Down is the least influential of the 4 relationships, it is the thematic relationship in a bear market. As you know, from today's intraday action I do expect upside in at least the IWM. The only other thing that stands out is the number of losing stocks vs gainers in each average, it's heavily skewed toward the losers which can create a 1-day oversold condition, which would match up with the positive divergence
Europe as we already knew, first from their credit markets that plunged while their stock markets partied like it was 1999 and now some of the markets are seeing their worst couple of days in months.
The DAX!?!?!

The FTSE London down -1.58%

The French CAC-40, "That other Core nation"
 Down -3.01 % and through the Trend Channel
Remember it was the PIIGS who got hit first and we speculated the core would be next, here's Spain...
 Down 5.43% and a clear violation of the Trend Channel, the earlier breaks below were not stop outs in December and early January as it needs to be on the close.
And as predicted, well this really just had to happen, the EUR/USD lost its footing, I believe it lost around 150 pips just overnight alone.
 The EUR/USD and the start of FX trade for the week.

A closer look
 With the huge leverage (up to 200x) any moves in the carry trade currencies can be catastrophic and lead to a downward spiral, then money has to come out of stocks and other risk assets to close the carry trade, strength in the JPY today is not any carry trade trader wants to see, irregardless of the pair-if it has JPY in it, it's bad news and this is on relative $USD strength as well, making it all the worse on the Yen side of things.
 You see, the $USD was up, so for the $USD to be down vs the Yen, means there was a lot of strength in the Yen-bad news for the market.
 And the EUR/JPY with the Euro seeing weakness and the Yen seeing strength, again this hurts the extremely leveraged carry trade.
I'm not even going to post credit because we have seen how bad that situation is and it's been warning of what we are seeing now for at least a week with really solid signals.
As for volatility, the VIX made a new closing high as protection is bid and fear rises...
 Ever since my custom DeMark styled indicator gave a buy signal on the VIX, we have been dead on right about every move here, when the huge volatility in the Bollinger Bands squeezed warning of an impending, highly directional move, I warned that this was a perfect place for a head fake move right before we get the real move, Friday in red we saw the head fake move below the median of the bands and today, a solid close above to a new high for the year. There's still room for some loitering and more volatility, but I really want to be using any strength now to fill out remaining shorts, Energy is one I want to get in to a bit more with ERY long. I also may look at some option positions in volatility if there's enough liquidity, otherwise maybe just something in VXX or UVXY which both did well today.
As for futures, the S&P futures look pretty mellow, but as you know from the IWM long call position today, I am looking for at least some upside sometime tomorrow. The ES futures aren't really telling me anything, but the horrible performing NASDAQ and the futures there are...
 ES futures are really bland, perhaps there's relative underperformance in the SPX tomorrow?
 NASDAQ futures though have a little spring in their step tonight and I see one potential treason why...
 The EUR/USD has been working on a positive divergence all day, it's way more positive right now than I ever remember seeing it, so it looks like some carry traders might be looking to unwind some positions with a pop in the EUR/USD, which would make sense with what I saw in the averages today, but especially the IWM where we have an open long call option.
I wouldn't trust this market too much longer and want to use any reasonable strength to fill out shorts and take profits on short term longs.
Well that about wraps it up for now, I've been showing you each piece of the puzzle, step by step so this is just kind of pulling it all together. Hopefully you are catching on to the concepts, the behavior and the tools to apply to your own trading style, that's when you are most successful.
It's 11 pm, time for some dinner.

Remember it was the PIIGS who got hit first and we speculated the core would be next, here's Spain...

And as predicted, well this really just had to happen, the EUR/USD lost its footing, I believe it lost around 150 pips just overnight alone.


A closer look


I'm not even going to post credit because we have seen how bad that situation is and it's been warning of what we are seeing now for at least a week with really solid signals.
As for volatility, the VIX made a new closing high as protection is bid and fear rises...

As for futures, the S&P futures look pretty mellow, but as you know from the IWM long call position today, I am looking for at least some upside sometime tomorrow. The ES futures aren't really telling me anything, but the horrible performing NASDAQ and the futures there are...


I wouldn't trust this market too much longer and want to use any reasonable strength to fill out shorts and take profits on short term longs.
Well that about wraps it up for now, I've been showing you each piece of the puzzle, step by step so this is just kind of pulling it all together. Hopefully you are catching on to the concepts, the behavior and the tools to apply to your own trading style, that's when you are most successful.
It's 11 pm, time for some dinner.