Tuesday, April 17, 2012

A quick look at volatility

I mentioned I would look at volatility and although there are a lot of different ways to measure it, just eyeballing the charts is probably the easiest, but here are a few observations.

 Just using a 1 day percent change indicator, this is the second biggest move in AAPL this year and after a 5 day decline of -4.26%, today.s move was +5.03%, talk about a shakeout! Note both our targets were hit today, the support trendline and the centennial mark at $600.


 AAPL's 10 day Average True Range is up about 500% since the rally around the start of the year, yet AAPL is up .55% over the last 4 trading weeks. This is the volatility I talk about with regard to topping action. If you look at AAPL on a monthly chart...

Not only is the hugely parabolic move very apparent through 2012, but there's a near perfect doji star, you might look at the longer term chart as a depiction of churning and you know how I view parabolic moves, they almost always end worse and more intense than they started.

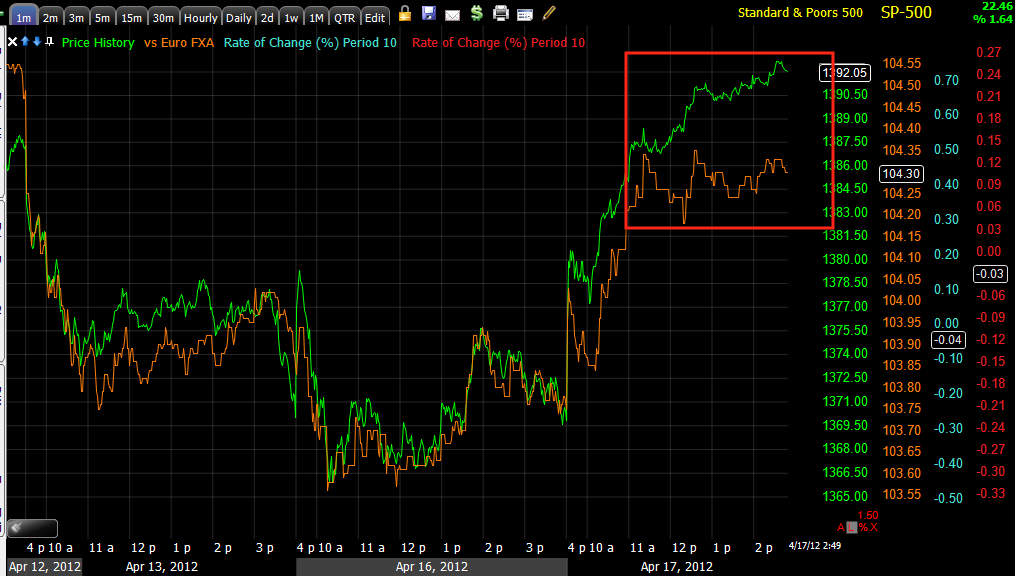
 On April 10th at the market lows or at least the SPX local lows, we saw stronger divergences in financials, Tech lagged badly until the positive divergence popped up unmistakably yesterday in Tech as we have been expecting, today's NASDAQ 100 move was the biggest move up all year at +2.01% and this after a -.93% decline since April 10th, again, that's the shakeout move we anticipated on April 10th.

Just look at the volatility from the start of the year through March and then from March through the present. After all of that volatility, this leaves the NASDAQ 100 up +.98% over the last 5 trading weeks, compare that to the compare that to the +22% gain from the start of the year until the last week of March; again, a depiction of churning.

 The SPX saw the second largest move today of the year on a shakeout, ironically, both through the same price level and trendline. Note the extreme volatility in the 1 day price percentage change yet we are no higher now then we were 5 weeks ago. If Financials still had been leading sector rotation today, we would have likely seen the biggest 1 day move of the year. Don't let me mislead you and leave you with the thought that I think this is bullish activity, it is just a reflection of the volatility I warned about several weeks ago, saying,"The market will continue to get more and more volatile".

The 10-day S&P-500 Average True Range is up 200% since February when all seemed well with the rally. Even back then, I pointed out the market wasn't making very big price moves, it was just making consistent moves up.

I suppose the moral of the post can be summed up with 1 chart that while on a much different scale, addresses parabolic moves and extreme volatility and what typically follows...

That would be the 2000 Tech bubble. I don't mean to compare the situation now apples to apples, but the market is fractal and what we see on 1 min charts we see on quarterly charts.

I'll be doing a some more poking around. I took a quick look at today's Price /Volume relationships for the 4 major averages, 3 of 4 were dominant in Price Up/Volume Down which is the most bearish of the 4 relationships, especially given the price percentage moves. Only the Russell 2000 had a dominant relationship of price up/volume up, which is the most bullish of the 4 relationships. None of the 4 averages were so dominant that they looked like they could present a 1 day overbought condition, however I still have some other internals to look in to.


A GREAT DAY!

I know there's a few emails in need of responses and I will get to them, my wife has been stranded on the side of the highway since 2:30 so I need to pick her up and then I'll get more in to the market and your emails.

April 10th as the SPX had already broken support and the 50 day average (I don't much care about moving averages, but technical traders do, therefore Wall Street does so we need to watch them), I said I had a gut feeling we would see a very volatile shakeout bounce and probably the last one. Later on April 10th, 3C gave us the accumulation signals on the short term charts that suggested that bounce was coming. I said "There's no reason to run this bounce if it doesn't shakeout the shorts". According to Technical Analysis dogma which as members have seen, is used against technical traders every single day by Wall Street, the emotional state of traders (remember price charts are just representations of fear and greed) would have been quite pessimistic as their long honored 50-day average was broken. 10 years ago I'd be inclined to short the market then and there, but we have seen the manipulation of technical analysis too many times to do something foolish like that.

Since then I have shown you at least 4 different volatility charts showing volatility has increased by over 100% since the February trend grinding higher. Volatility is not associated with consolidations as the buy the dip crowd, who have been throughly brainwashed over the last year would hope, volatility is associated with tops.

So what were technical traders looking for? They were looking for exactly what technical analysis has taught for nearly a century, they were looking for a snap back bounce to fail at broken support (resistance). This has always been taught to traders as the high probability/low risk short scenario. The trend we have observed says that the test breaks through resistance and therefore takes out more shorts, gets the buy the dip crowd excited (their time will come next) and positions everywhere are flushed out. You have to remember that hitting stops, triggering limit orders and such are big revenue streams for Wall Street on volume rebates so whatever can be done to shake out the most traders, create the most volume, is generally what will happen.

A day or two ago I posted the charts of the major averages and where I thought they HAD to go to make any bounce off the 10th's lows worthwhile, they looked like this...

 The green arrow is April 10th-the Dow needed to break above the red trendline, yesterday and Friday we were at resistance, yesterday it looked like the test was going to fail. I said I am not ready to call an end to the bounce because it simply has not done what we expected, it had not broken above resistance as it has today. I'll take a look at today's volatility later, but I'm assuming we are probably close to some records for the year.

 The NASDAQ has broken above the first level, the NDX has been a laggard as we expected for the early part of the move, Financials had stronger positive divergences than tech, THAT CHANGED YESTERDAY and the gut feeling that Tech would take over leadership (which I said yesterday would require AAPL) was confirmed yesterday with the positive short term divergences in the Q's, Tech and AAPL as well as several other tech names. I have received several emails from some of you who played the tech bounce by opening positions yesterday-congratulations! As you know, I try to give as much one on one help as I can, but I have no desire to be a guru, but a student of the market offering any insights that you can apply yourselves and again, I am proud of you all for going against what market dogma suggested and doing what does not come naturally or easy and many of you saw a nice pay day today for your thinking out side of the box. This is ultimately my greatest pride and joy from working with all of you.

 The IWM "overall" looks the worst (it shouldn't in a risk on move), the 50 day may be a target for the IWM, but it is not where I'm most concentrated.

Finally the SPX, it seemed the bounce might have failed to some, it didn't, it has now done what we expected on April 10th. We are moving exactly in the right direction!

Another Quick look at AAPL

As you know, I think AAPL is the key to the market.

We expected AAPL to underperform and then to be the last sector to rotate in. Look at the move in AAPL Today!

 Here's the AAPL 15 min chart that convinced me AAPL WOULD make the move. This chart is still holding up.

 The short term 1 min shows distribution has already started, the 2 min chart is interesting.

 Note how we have confirmation early in the AAPL move today? Then we have a strong leading negative divergence. This is pretty simple to explain, there's an average accumulated position, apparently around the $600 mark, they can't start distributing until AAPL moves above their average accumulated position, this is why VWAPs are so helpful. After price is above that position and they have profit to cover the expense of the accumulation in to lower prices, they are free to start selling shares or shorting them. This gives you some idea of what the average accumulated position was.

As always, the short term chart's damage flows to the longer term charts, the 2 min is damaged badly and it is starting to show on the 5 min as AAPL didn't see a 3C higher high with price.

Financials

Clearly as we have been expecting, financials have rotated out with Tech taking over leadership today, it was a gut feeling I had and yesterday's Tech charts, NDX and AAPL charts all suggested today would be the day.

On April 10th as the SPX broke the 50 day and as we expected a bounce to form, I  said this would be more volatile and thus far it has been, last week we had the biggest 2 day move up all year and the biggest weekly drop all year both in the same week! I am suspecting that the unpredictability factor will be much higher than the least bounces which we have been able to nail nearly perfectly. It is for this reason that I want to start adding some positions short, but YOU MUST have the emotional strength to deal with any potential draw down as the short term signals are showing massive negative divergences/distribution, but we still have some longer charts that haven't gone negative yet, PCLN was a good example. We also have hedge funds now starting to think  in terms of self-preservation. We may still yet get that beautiful clear signal, but I would prefer to have some exposure in case this market takes a swan dive, I feel VERY strongly this is the last bounce before that swan dive and all it could take is Spanish Yields pooping above 6% overnight.

 XLF/Financials 1 min with a strong 1 min negative divergence, we see the accumulation stage for the bounce and a much stronger negative divergence in place. THEY NEED price strength to sell in to, ths the reason we haven't seen distribution in Tech until today.

 The 2 min chart with several accumulation/distribution areas, the last positive divergence wasn't all that big, the negative divergence is fairly big here, at least on par with the last one.

 This 5 min chart is more important, look at the selling in to price strength, that's a strong leading negative divergence below the accumulation area, I'd say they have moved all accumulated shares and have likely initiated shorts, but as I often remind you, they need to phase in to the trade as to not disrupt the supply/demand flow and send prices against their positions.

 Here we have almost a relative negative divergence, there certainly isn't more strength here, but once again, it is these 15 min charts that haven't broken down quite yet that leave the door open for some further gains.


 Here is a leveraged Inverse (Short) Financial ETF, FAZ. The 1 min accumulation today is clear, look at the nice flat quiet area that they almost always accumulate in to.

 The 2 min is leading positive.

 The 5 min has a huge leading positive divergence and it looks almost as if FAZ has been accumulated as a small double base with the divergence MUCH stronger on the second run to the support area. They have a target accumulation price in mind and FAZ looks like it is in the area. As always, watch for the head fake move just like we saw in AAPL on the open today.

I'm not going to go in to the conversation on how wedges behave as it has been covered many times, but this is the typical set up in a bullish descending wedge and there's a 1 day leading positive divergence. I would start to look at FAZ, I almost prefer ETFs for the initial move (break) until sector rotation and stock performance inside those sectors becomes clear and then I prefer to replace the ETFs with straight equity shorts.

As with all of the trades, if you enter FAZ, you must be willing to have a wider stop as these 15 min charts still haven't convincingly broken yet.


PCLN Update

PCLN is a pretty good example of what is going on in the market and exactly everything we have expected since the break of the SPX 50 day on April 10th and the volatility bounce expected on the 10th.


 Like every other stock and average we have seen, the SPX, AAPL, etc, yesterday PCLN broke support, which means volatility shakeout of the new shorts and we saw the positive divergence develop for that yesterday. PCLN is back above the broken support level, this is what shakes out the shorts and gets the "Buy the dip" club doing their thing. The market NEEDS to sell/short in to price strength, but as we have seen, price strength is not the same as real strength.

 Yesterday's 2 min positive divergence in PCLN as all the stops that were hit were accumulated for a volatility shakeout of the shorts, everyone is getting tossed from their positions, this is when and why you keep your eye on the longer term and don't get caught up in the volatility/noise. Today where is the strength? 3C has not confirmed the move up, in fact it is lading negative, meaning the big boys and girls are selling/shorting in to price strength.

 The 5 min chart shows the extent of the accumulation of the longs stopped out yesterday, big volume on a break of support is the easiest and fastest way for Wall Street to accumulate without raising suspicions, even if it is just for a volatility shakeout, BECAUSE someone HAS to take the other side of the trade, so it doesn't raise suspicions and we know that they never want to show their cards, they have ust been a little too predictable lately. While some of the 2 min chart's weakness is bleeding in to the 5 min and while PCLN is back above the support area broken yesterday as we saw in yesterday's PCLN update, this 5 min chart, thus far looks like PCLN has a bit more to go on the upside, like I said, this doesn't have to happen tomorrow, but I would be looking at starting a position and phasing in to PCLN leaving plenty of room to add.

The 15 min chart has given some VERY clear signals for distribution, unfortunately in this case, yesterday's accumulation period was not as big as previous ones, we don't quite have the 15 min negative divergence where I would really want to start loading up on PCLN.


GDX quick look...

 This is a 5 day chart of GDX, obviously this looks like a huge top and long term I don't like it.

In the near term, what has GDX done? The same as usual, a break of support, which up until this point has reliably led to a volatility shakeout. GLD is insane, one day it's a flight to safety the next day it's doing something else, but there's is a chance that a break in the market may produce a knee jerk flight to safety in GLD and related sectors like mining.


 Short term GDX looks like a pullback here, I would not be a buyer right now.

 Same on the 2 min chart

 As well as the 5 min chart

 The 15 min chart is in line, but here is where it gets interesting.

 The 30 min has a strong leading positive divergence, all collected BELOW the break of support, again suggesting a volatility shakeout back above what is now the resistance level of that large top looking formation. I suspect the red area is a small base as GDX seems to have been accumulating in this area.


The hourly chart looks decent, it is not seeing the same amount of strength the 30 min chart is, but remember that the faster or shorter timeframes bleed in to the longer ones.

If I am long GDX or considering it, I want to leave a little room on the stop just below the consolidation area in case of a typical head fake downside shakeout before a reversal up. This is not my favorite trade and I'd much rather be a buyer on short term accumulation, but if you are in, that is what I would be looking at as far as risk management goes. The support for this consolidation is around $46 so I'd have preferably an end of day stop that is a bit lower than $46. If/when GDX pulls back to the bottom of the range, we will want to check the short term charts for accumulation and especially on a break below $46 as that could very well be the typical head fake move we se before an upside reversal. Longer term, I wouldn't expect a trending trade here, you saw the 5 day chart. The best I think GDX would give is a sharp volatility shakeout of the shorts, which could very well be worth trading.

RISK Layout Update

If I haven't gotten to your email yet it is because the market is moving fast and I need to take care of the group. Just remember that most stocks are market directional, that means if you are looking at a BIDU or PCLN short, thee greatest gravitational pull on price will be first and foremost the market's direction.


 Commodities as a risk asset have completely failed here, this is expected with the China situation, again if I have time FXP is a good ETF to play China in a pinch, remember it is leveraged. The fact commodities have failed here to rally shows this is not a true risk on move, but rather the volatility bounce we have been expecting since April 10th.

Remember earlier in the day I said the CONTEXT Model was broadly supportive of more risk on, and we have seen that, I also said I was waiting for the model to flip, now the model is lower than ES, this is the start of the ES negative divergence

 Credit is no longer in sync with the market, at least not HY, this is another divergence we have been looking for to time the end of the bounce. It looks pretty bad, but as you can see in AAPL today, the market ALWAYS moves in extremes, that's why I don't believe in oversold/overbought.


 Yields are also signaling a negative divergence, remember the concept of regression to the mean.

 The $AUD has been an excellent leading indicator, it is going negative here with the SPX, I have seen smaller divergences turn the market, but this is as I showed a few nights ago, the most volatile move in the market this entire year.

 The $USD is holding up pretty well as can be seen by the Euro leaking off and flat, no longer in sync with the SPX. This is not helpful for the market to move higher, but as you can also see, it is more the cycle Wall St. set up on the 10th that is moving the market as the FX correlation has broken down and the SPX moved higher.

 Finally, HY Corp. Credit is laking off, the divergence isn't horrible at this point, but it can leak off a lot quicker in the last hour of the day.

 Financials as expected yesterday are out of rotation, FAZ would be one leveraged financial short ETF you might consider.

Also as expected, Tech went in to rotation today, you can see it is starting to lose momentum vs the SPX in this area.

I'll try to look at some individual names next.

AAPL Update

 AAPL has done exactly what we expected, it has broken both resistance levels and there's distribution in to a very volatile move.

 The 15 min chart still says AAPL can go further, but if I had time to place trades right now, I would be PHASING into AAPL shorts, hedge funds seem to be flocking for the exits on any strength. Again, if you phase in, you MUST allow room to add at higher levels which are certainly possible at this time.

 The 1 min chart is nasty, but the 2 min chart below really shows what is going on with less noise.

 Look at that leading negative divergence-they are selling in to any strength, but remember their positions are HUGE.

The 5 min chart is starting to turn.

Being this market has a LOT of "ifs" I would prefer to start to look at phasing in to short positions on this strength, but again, the 15 min chart is still pretty strong, this indicates more upside is possible and even likely unless we really see the 15 min start to fall apart.

We are above the resistance areas we wanted to be above with the tech rotation we were looking for, I have a gut feeling that this may be a little early to enter large positions, but the market is becoming more and more unpredictable with this volatility and options expiration.

IF I had time to place some trades, I would probably be looking to start a position in AAPL short, but I would leave plenty of room to add on further upside, it doesn't have to come tomorrow, it could certainly come Thursday.

SPX/DOW Update

I don't like the looks of the Dow in this area as it rounds over...

 DIA 1 min negative and leading

 The 2 min is getting very negative here as the DIA rounds.

The DIA 5 min is leading negative

 SPY 2 min is leading negative

 SPY 5 min is still in line...

The 15 min is also still in line.

It looks like the short term is looking for a pullback move while the longer term still suggests some more upside, I need to look at AAPL and the risk assets, coming up next.