Thursday, February 28, 2013

For those who bought GLD Calls

You'll probably like this, gold futures-5 min chart
Leading positive, we should see some nice gains from this one probably tomorrow.

One more Try

This could be nothing (although I doubt it), it could be the start of a move for an options expiration pin or it could be that new Dow high I think Wall St. would love to have, especially on a Friday, but there's some movement in futures.

 The 1 min ES chart is flying with a leading positive divegrence, this may not last overnight or it might, but there's no support for any price moves that could potentially come from this, so it gives us another opportunity like today perhaps with names like GOOG and PCLN, but it's way too early to tell, I just saw it and thought to post it.

 The real problem is in the 5 min chart, this is why I preferred next week's expiration on the puts, the volatility in the market is insane, so I'd rather have a few extra days, but this shows us what's been going on with smart money.

 NQ has the same 1 min...

And the same 5 min.

Maybe I'll check these before I go to bed, but a I said in the last post, maybe op-ex, maybe the new Dow high to bring retail in over the weekend, maybe it's nothing, but it can't hurt.

The Message of the Market

I don't type those words with my two index fingers (sometimes I use my thumb to hit the "space bar" when I really have my "Hunt and Peck" typing, working) lightly.

I don't use that phrase as a market cliche or part of the lingo of trading, there really is a message the market sends out.

Lets go back to Tuesday one more time to this post, "More Data" because this is important. What I'm trying to do in this post is help anchor your expectations, I've seen something in the market, combine that with experience, etc and there's a message there for us. This post above is there for one reason and ONE REASON ONLY, TO HELP YOU UNDERSTAND WHAT TO EXPECT, TO KNOW THAT IT'S HOLLOW AND TO NOT FEAR IT, BUT USE IT TO YOUR ADVANTAGE.

Before we go back to what was said on Tuesday in the post linked above, lets just see what the market has done since.

Above is the Dow 30 with Tuesday, Wednesday and Thursday (today) marked. On Monday we sold long calls in the IWM and QQQ at a profit before the market dropped. On Tuesday we had some 3x longs in URTY and the TQQQ on Wednesday those were closed at a profit.

As far as the market, Wednesday was a big day up for the Dow, 175 points or +1.26%, the SPX was up +1.27%, the R2k and NDX were both up over 1%, this was Wednesday.

Now, Tuesday's post, "More Data", I'm going to highlight some parts.


This is just more data that backs up my position that we will almost certainly see a correction/bounce to the upside, the thing is, saying that or hearing that right now sound reasonable and most people feel like, "OK, cool, this will be an opportunity like he's been talking about".

However, Wall St. rarely does anything half-tooshied. When they wanted a low volatility melt up to drag dumb money back into the market with no pullbacks to scare them and a bunch of nightly news headlines, "This is the highest the Dow has been since XYZ0!" they did it and did it well.

When they want to scare people out of positions, they do it and do it well, you'll see a downside move like yesterday that sends longs in to a panic, shorts chased it and likely we'll get an upside move that may indeed make that all-time new high in the Dow that CNBC was talking about yesterday morning just before the market crashed.

The point is, be prepared for an emotional assault that is meant to touch on the two things that move the market, FEAR and GREED. 

This is all part of my market Pendulum concept, it swings way too far one way and way too far the other, don't fear it, it truly is a gift/opportunity.

To give you some proof to sustain you, although I doubt you'll recall if we get the kind of move I'd expect, here are a few charts....


I'm trying to prepare you for what I see coming so you can use it to your advantage rather than be afraid of it and many of you did today and yesterday so I'm happy about that.

Today there's a lot of news out there about the Sequester, the vote, this that and the other, but this was all visible in the market Tuesday. Perhaps the market was going to react the way it did no matter what happened, even if the Senate had enough democratic votes, I suspect this is true to some degree.

Futures dropped from the upper VWAP today as the voting started, 

but the market told us this an hour before it happened. 

Market Update posted at 1:52
Some Early Signs posted at 2:07

We even knew when the market was about to break out and move higher- Market Update-Futures @ 12:27.

This is what I mean about the "Message of the market". Another thing it showed us was that any move higher was pure market manipulation, there was nothing backing it up, therefore it had slim to zero chance of holding, I can show you this in a number of charts, but just think about all the risk assets that didn't move today as CONTEXT hit below -30!

The point in knowing what's happening ahead of time or having a good idea is sing it to your advantage, that's what Wall St. does, that's what we try to do.

Today's selling was ruthless...
Once ES lost the top channel, they tried to hold VWAP, when that broke, they even broke the bottom channel and went below that, remember what I said on Tuesday, "This is all part of my market Pendulum concept, it swings way too far one way and way too far the other"

Believe me, Wall St. wanted that new Dow record, it would such in so much retail and make their job so much easier, they just didn't get it.

We've already seen some of the move that we started puts for today, tomorrow is a weekly op-ex day so typically there's a floor and roof on the day, it will be interesting though to see what happens, if the weekly op-ex pin is strong enough to hold back sentiment or manipulation.

One other thing, remember when I said "Volatility will pick up, we'll have huge days up and down, but the market will essentially go no where"?
At the bottom window you can see the 5-day ATR picked up a lot, look at the area I have highlighted on the price chart, that's over 156 points of movement, if only half of that were trending in one direction the S&P would have moved 5%, instead it's moved 0.30%, not even 1/3rd of 1%, yet volatility is insane. 

Today the VIX put in a bullish reversal signal, that would be negative for the market.


Not only do we have our custom indicator buy signal, the Bollinger Band squeeze suggesting a highly directional move, the start of that highly directional move, today we have a 2-day bullish candle reversal called a "Bullish Harami" or an inside day, we also have a bullish "Hammer" that printed today in the VIX.

We have soem really serious damage done as well to the averages, beyond what's already there, add this local damage.
 DIA 15 min

 QQQ 5 min

SPY 5 min

So whatever happens moving forward, I have very little fear about selling short in to any price strength "IF" we can even get that, I still think Wall St. wanted that new Dow high, Friday would be a perfect time to get it too, let retail think about it all weekend and place limit orders for Monday morning, that would be a potential bloodbath.

I have nothing though to suggest that will happen, no charts, no evidence, the only thing was the Dow and SPX had dominant Price/Volume relationships that are like a 1-day oversold, "Close Down/Volume Up", the other averages didn't have any dominant relationships.


As far as currencies, they're not looking any better than leading indicators.

 The currency that supports risk on moves, the EUR/USD is now in a solid downtrend, remember when we first identified "something not right" here?

The Carry trade pair of EUR/JPY is headed down, that means the JPY up and the funds made by using this carry trade are going to close it out, that means hedge funds that use this to finance stock buys are selling the stock and closing the carry trade, NOTHING LOOKS GOOD FOR THIS MARKET.


Futures CRASH through VWAP

Here are the futures...
 Earlier the 1 min intraday chart started leading negative in ES, this was after there were some signs in TICK.

This is EXACTLY the signal I have been using for the weekly puts, price is up nice, the puts are cheaper and there's heavy distribution. Today feels like it may have been a very important day.


 ES and VWAP, look at where ES is turned down, right at the ideal selling/short selling place, the top standard deviation of VWAP, this is what institutional players use to gauge their fills.


 NQ went negative, it got a bit worse in to the highs of the day

 The 5 min chart though is the one I'm interested in, this is negative like the rest of the Put / weekly option plays.

Again, look  at VWAP, the selling crashed right through the bottom, that looks like major panic.

The fact VXX held up so well and UVXY as mentioned earlier were very interesting, someone was busy buying protection as VIX shows and about an hour before price started to reverse

VIX bottomed at 1:30, the SPX didn't turn down until 2:35, about an hour after protection was being bid.

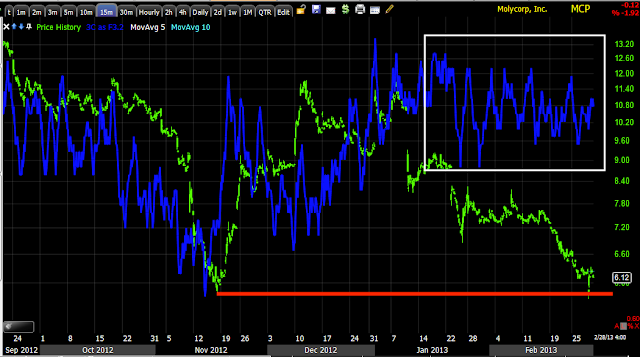
MCP Charts

 The weekly chart is similar to UNG's long term chart when we first noticed a change in character, between the bullish descending wedge of 2 years and the volume picking up, it does raise my interest after not having looked at this in a long time.

 There appears to be a recent "W" bottom, in Technical Analysis textbooks they'll tell you the second bottom should fall short of the first, in other words never make it as low as support, but for years that concept has been thrown on its head, which is purposeful in my view- what better way to accumulate at cheap prices and with plenty of supply available than to clear out the stops as well as taking out weak hands.

 Today's daily volume is up, but as you can see, it was on a wash out of the stops on the open.


 The 30 min chart looks pretty insane, I almost wouldn't believe it if it weren't for the others...

 The 15 min chart is also leading positive at the second low.

As is the 5 min chart.

Below 5 mins trade gets spotty and signals are less reliable, but for me, this is certainly with a speculative position, especially after having watched it so long, I tend to think whatever was originally seen is probably real as well.

MCP Trade

As a new trade, I like MCP a lot right here long, I'd keep it speculative in size. For my purposes, I'm going to add to as much as I can without violating the 2% rule.

Today looks like a head fake move below a "W" bottom.

Charts coming

ERY Follow Up

One of the ways I confirm a signal is by looking at the underlying ETF or asset, the different versions of leverage if available and the inverse of the asset, in this case the inverse asset of ERY (3x short Energy) is ERX (3x long Energy).

I didn't write on any of these charts because I didn't think you'd ned it, except the last one as it is a very important timeframe and the divergence is important.

 Remember, a negative signal in ERX is a positive in ERY which is the long position I like. The 2 min chart.

 3 min.

 5 min.


 10 min.

 30 min

4 hour.

I could add the XLE charts, which would look the same or worse and the ERY charts which look as good, but they are positive.

This is just another tool for those using 3C, Compare!

Filling Out ERY Long

There are a lot of charts behind this one, I'll try to get them up soon.

CONTEXT

I've never seen CONTEXT with a differential like this, I don't think until this week did I ever see 20's, but now....

We now have more than a 30 point differential, usually markets turn around -8 or -12, I have a feeling this is going to be very ugly.

Adding to TJX Short

This will bring the position up to 2/3rds a full position, it is right at break even here.

Volatility and TLT

Here's a quick look at two I mentioned just a few posts ago...


 From short to long and using VXX and UVXY (both long volatility, just different leverage) and the inverse or short volatility, XIV. This is VXX 3 min positive divergence, I especially like the flat area despite what the market has done the last 2 days.

 UVXY also nice and flat, a good area to see accumulation , this 5 min chart is leading positive.

 VXX 10 min is moving to a leading positive position

 XIV 60 min is leading negative

The VIX is actually in a candlestick pattern, very bullish, it's called, "Rising 3 Methods" as all 3 of the last days have pulled back, but stayed inside the real body of the 4th candle back, the large up and the pullback is to nearly a perfect area as far as the median goes.

TLT- 20+ year treasuries, the flight to safety trade.

 TLT 1 min is leading positive in a big way here today.

 2 min leading positive

 5 min leading positive

 15 min positive

2 hr huge leading positive in the base area.

Market Update -WOW-

I just took a look at leading indicators to make sure nothing was going to be a surprise, High Yield Corp. Credit is a bit stronger than I'd expect, but High Yield, Junk and most everything I look at, looked great.

There's been a small move up in the $USD, it's not to new highs on the day or anything like that so I don't think it has anything to do with what is starting to unravel right now and I don't think it has much to do with commodities which just took it on the chin pretty darn hard intraday vs. the SPX.

I'm moving toward filling out whatever positions can be,  I like this area here, it has been so far as we expected except it hasn't been quite as scary on the upside as I would have thought.

Filling out SPXU Long-Full size

This is a 3X leveraged Short the SPX, this is a long position (buy)

I like TLT Long Here as well

TLT doesn't have much beta so the play, if you like it might be to short the TBT ETF (it is already a short, but by shorting it you are getting long exposure at 2x leverage).

Volatility Long

I am looking at the charts of VIX, VXX and UVXY.

I prefer VXX, but al of them are looking good as long trades in this area. I'm going to see what room I might have and may very well go for it here. This was another one of the clues I mentioned about the market.

Intraday Futures starting to go negative

These are the same 1 min charts that led me to post the market was going to move higher out of the triangle.

ES looks a bit more developed than the NASDAQ futures, this is just a start, but if ES (3C) keeps moving as fast as it started on this move to the negative, then it will be pretty large soon enough.

 ES went to a less powerful relative negative divergence first and then to a stronger leading negative divergence, it's already leading nearly twice as much as seen above at this moment so it continues moving fast.


The NQ divergence is only a relative negative on this chart, it's a bit worse than what is seen above, but Es is definitely leading the negative divergence charge and right about on time.

Starting SPY March 8 Put

This is long a put in the SPY for next week's weekly (March 8th) with a strike of $155


Some Early Signs

I told you I'd post some early signs that this move is losing momentum.

The NYSE TICK isn't a special or custom indicator, it's something anyone can use, but like so many other good indicators it is looked over because of its simplicity.

 First at the top is the SPY or SPX, note the trend of the red linear regression trendline, now loo at the middle window and note the trend of the red linear regression trendline, breadth is a problem in this move right now and that's one of your first clues.

At the bottom I created a custom histogram, you can see it rising as it should with price and it just diverged by not making a higher high, but a lower high.

Just comparing the TICK (green) to the SPY (red) you can see the TICK has been unable to post a higher high vs. this morning and in the yellow box, TICK is failing to move with price/SPY.


I'd Like to See GOOG a Tad Higher

However, if I had planned on a phased entry, whether 1/3rd at a time or 50% and that was part of my risk management (the point of a phased entry is to leave room to add at better prices, but it has to be part of your risk management plan BEFORE you short 1 share, otherwise you're just dollar cost averaging out of hope, rather than strategic planning), I have to say, half a percent or 1 or even 3% higher from here would not deter me at all from starting my phasing in.


Market Update

Don't forget that this price strength is what we wanted as it is useful for tactical plans, allowing us to sell or short in to price strength, reduce risk, etc.

There are several early indications this move out of the triangle is starting to lose some luster, I'll be positing them shortly, right now I'm looking at opportunities.

Reminder-GOOG

SO the Futures intraday chart was right, we're not quite out of the NASDAQ futures intraday triangle, but we are clear of the chop in S&P futures and this is about the normal time of day for a move like this, we often see the move fade in to the last hour.

In any case, yesterday I showed you GOOG as a potential short trade and a very low risk area where GOOG could be worth a look and some consideration.

The area where GOOG would REALLY be interesting is above the recent highs, $808.97, that's only about 0.45% from here so you might set an alert if you are interested.


Energy / XLE / ERY

ERY is one of the long positions I have been putting together, there's a little room to add to it to bring it up to full position size, but I haven't made a decision there, but don't let that detract from the idea of ERY (3x bear energy)  long or there are less leveraged ways to go about it such as short DBE (2x) or XLE short (1x).

Here's Energy as an industry group which includes not only oil, but services, transportation, basically everything related to energy, much different than just oil which does make up a large part of XLE.

 XLE on a weekly chart shows a healthy trend as price moves up and volume moves up, these of course were the Bush/Cheney years, but hey, if our new president was a cattle farmer and head of the largest beef producing company in the world, I'd be buying in to cows. The red large volume around late 2009 is capitulation volume, you can see the trend since hasn't been nearly as healthy or strong, volume is way off, in fact it lines up pretty well on the advances with QE1 and 2 and tell me again Bernie how you have the best inflation fighting record in 60+ years of all the F_E_D chiefs, I remember clearly all the companies that were reporting and it was clear as day (as was ISM) that input costs were squeezing margins so hard they were laying off people to try to save money-so Bernie pulled a double whammy, but hey, the BANKS LOVED IT!

 My DeMark-inspired Buy/Sell indicator, you saw it work exceptionally well with the VIX recently; in my experience, the larger the signal like we have now, the more powerful the signal.

 My Trend Channel has stopped out, as I have said many times, after a stop out there's a lot of volatility and sometimes even new highs, but for the amount of volatility and the scraps you are fighting fot, you are almost ALWAYS better off just taking the meat of the trend's gains and leave the volatile scraps to someone else.

Note the weekly ATR at the bottom window was rising as it should with price late 2012,  then fell to extreme lows, only about 1/3rd of the previous range, this is when the dumb money started pouring back in to the market, they kept volatility low, gains nice and steady, although small and as I said, it was a perfect environment for those who have been out of the market to get back in, the real question was, "Why did Wall St. go through all of that trouble to bring them back?" I think the answer is a pretty easy one.

Volatility has picked up a lot since we started moving toward the stop and just as I said would happen with the market, we see it in Energy, huge days up and down, but the asset is going no where, just churning at VERY BEST.

 XLE and the daily MoneyStream (Don Worden's indicator, like 3C) with a huge negative divergence, note the positive at the lows of 2009.

 XLE 2 hour with a leading negative divergence.

 The same on the 30 min

 As well as the 1 min.

ERX 3x Leveraged Energy Bull-should have similar signals as XLE
 30 min chart leading negative

 3 min leading negative...

ERY-3X Energy Bear The signals here should be the opposite-positive.
 2 hour leading positive

3 min leading positive.

I like the area here, I think as the market moves down, ERY will still likely be in a decent position as a long position, I even like it here on a phased entry.