Thursday, December 1, 2011

Even Flatter night

Today was a very flat day for the market and ES, taking that in to consideration, ES is even flatter tonight thus far, I've never seen anything like it.

I can't imagine that so many traders are unwilling to take any position before tomorrow's NFP (Non Farm Payrolls).

If you thought regular hours were flat, check out after hours, near linear.

I also find it interesting that neither the European (especially) or the US markets rallied on the BTP and other sovereign yields coming down, especially after a day like Wednesday. It's all very strange.

The calm before the storm? If so, there are few times I have seen the market as flat as it was nearly across the board, but I've never seen ES this flat and volume, forget it, there isn't any.

There's not much more to say, just a lot of digging to do. If I unearth anything you haven't already seen, you'll be the first and only ones to know.

Flat Day

Last night's futures were pretty much flat except the NASDAQ 100 was slightly up, the rest were slightly down and that's how we pretty much closed, the decliners were a bit deeper on the downside as compared to the futures and the NASDAQ had a bigger advane, but nothing to write home about.

The VWAP was the theme today in ES.
The market stayed very close to the VWAP all day, with it acting as either support or resistance. Toward the close ES broke below the VWAP on some of the heaviest volume of the day, which was otherwise fairly tame in comparison to yesterday's

The S&P formed an inside day or a Harami reversal as did the Russell 2000, the Dow was just a fraction of a percent from doing the same. The NASDAQ closed up .59% which was the only gainer today with the Russell 2k losing the most at -.89%. The S&P closed at -.23 and the Dow -.21 both in line with the flat inside Harami formation that is a fairly reliable reversal pattern in candlestick charting.

Also forming a Harami were Financials (XLF), Energy (XLE), Copper (JJC), the one copper short I have been considering, FCX, Materials (XLB), Russell top 50 (XLG), Industrials (XLI), Utilities (XLU)  Consumer Staples (XLP) formed a more ominous "Dark Cloud Cover' reversal formation. In essence, nearly every major Industry group was not only flat and most at a loss today, but formed Harami reversal patterns.

It seems most of the indications from last night's post popped up today in trade.

I'll have more for you in a bit.

AAPL Breaking already?

 Volume is correct for a bearish ascending wedge, now it's picking up a bit on what may be the downside break.

Here's a closer look.

Market Update-Knocking the legs out

We saw earlier commodities as a group were losing momentum today. I consider Energy, Financials and Tech to be probably the 3 most important industry groups.

USO as we saw earlier has hit a speed bump today. The larger Energy sector represented by XLE is also at a loss and gave up some nice earlier gains from the a.m.

 Remember my earlier Linear Regression post and I said I expected USO to test resistance at $38.75-there it is to the cent, which also is now gap resistance.

 USO's 15 min 3C chart shows the recent bounce to have occurred while 3C was leading negative and moving lower through the bounce.

 Here's a close up of the 15 min chart on recent trade.

And the hourly chart, well this is the reason I decided to hold my oil shorts and let the dust settle.

As far as financials, we have seen the risk Financial momentum indicator and how it is dislocated from the broad bounce, but how about XLF?

 A kiss the top good bye bounce... Today also displays thus far a candlestick Harami reversal pattern.

 The 2 min chart couldn't confirm and went the other direction in a negative divergence.

 The 5 min chart continues to lead lower, which should drag XLF down with it.

The 15 min chart speaks for itself.

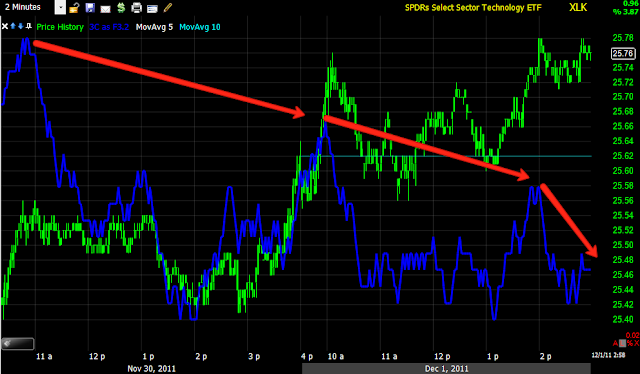
Now we have XLK (Technology) which has been the only of the 3 performing today.

 The 1 min chart made no effort to confirm which leads me to believe (since we have seen the same thing everywhere) that this bounce has been used to sell short for the most part.

 A close up of the 1 min chart for the last 2 days shows today weakening despite the move higher.

 The 2 min chart looks similar, it only needs about 30 minutes to confirm price, it has had the week and hasn't done so, instead moving down.

 Here's the close up of the 2 min, note the 3C weakness today in Tech.

 Same with the 5 min chart,

 And the 15 min chart, that's as clear of a divergence as you get.

 A close up of XLK 15 min looks like its near topping. If I wanted to add tech shorts like TYP, I'd be doing it today.


The hourly overall is leading to new lows below the October lows.

And what is driving tech today, my guess is the most weighted stock in Tech, AAPL.

 First today's price action is a wedge, a bearish one and confirmed by volume.

 The 1 min chart, moving opposite to price in a leading negative divergence.

 A close up of the 1 min shows continued 3C deterioration in to the wedge apex.

AAPL may in fact be a decent short here.

 The 2 min close up is showing the same distribution in to a bearish price pattern.

 The 5 min chart is divergence in several ways.

And long term, the 60 min chart is also at or recently at new leading negative lows below the Oct. lows.

So Tech looks to be the last leg on the table and it appears to be deteriorating pretty quickly.

I think we may have time to add tomorrow, but I have no problem adding today.


Today's trade

I was just having an email exchange with a member and we were talking about tops, the same applies to bottoms. The thing that has always interested me about technial analysis is the fractal nature of it, patterns that you see on a 5 day chart will be similar to a 5 min chart and this is because the market is moved by sentiment or emotion to a large degree.  When I taught Technical Analysis my goal was to get my students to see  price chart as a map of human emotion and not just lines, price patterns and indicators, that's a hard thing to do, however I believe that's where you find the most insight in to the market and that's also why I believe to be a good trader, you need to really be able to confront yourself and your emotions and break certain destructive cycles. The market, just lke self-discovery isn't a one time event, it's a process of constant learning and evolution.

However I'm getting a bit off subject. The subject is market tops and we are now in a bounce that we were looking for since last week, many of us to be able to use that bounce to add or initiate positions, it's a lot easier to say that before the market bounces then it is to do it once the market bounces, like the saying, "Every boxer has a fight plan until they are hit with the first punch".

Today's trade has been VERY lateral and considering some of the major support legs of the market such as energy and financials are being knocked out, I see this as probably a pretty decent area to add to shorts or start new ones.

 Today's SPY trade is range bound and after yesterday's performance, is showing no signs of follow through buying, which leads me to believe that yesterday was a sugar rush rally and today the longer term implications are being thought out.

 The October rally was pretty strong, but notice it didn't just reverse, tops are a process and very rarely an event. Once the top has reversed, usually the downside is pretty quick and strong.

 On a longer term scale (this is the fractal nature of the market) we have a strong QE based rally and again, a topping process, not a linear reversal event. Once the topping process was over, the downside was sharp.

Looking at today and yesterday, I didn't expect a big downside reversal today, the fact there's no follow through and some of the biggest sectors are falling like oil and financials, shows weakness or the legs of the rally are being taken out. Note in the red boxes there are several cases of a strong rally, but there are few event driven reversals and usually  process that starts with a loss of momentum (smaller candle bodies) and then the reversal takes place.  In fact the second box from the left looks very much like the last 2 days. I think we are in a different spot right now then we were then, back then we were topping from the October rally, now we seem to be topping from a minor bounce, so the outcome after should look different in my opinion, the work or the process of creating the October rally top is done, we saw the downside and it was pretty sharp, now we are seeing a counter-trend bounce, it's not at all the same situation.

In any case, I just wanted to bring that to your attention.

A Few Commodities...

 This is the CCI Commodity Index with a linear regression channel, breakouts or channel busters to the upside like this one in the white box are in my view, a change in character. Looking for these channel busters is virtually the only reason I use linear regression channels as I have found more often then not, a break above the channel like this often is a last ditch move before a reversal, it's a little like parabolic moves in equities that almost always reverse and usually in just as extreme a manner.

 GLD has broken below it's channel today (down -.75%) with wide red volume, which is different then a capitulation like spike that often is found at an upside reversal point.

 Here are the more capitulation like volume spikes that are often found at the bottom of a move ready to reverse up. SLV is testing the lower channel (-.60%) and volume is subdued, remember that stocks can fall of their own weight and don't need volume to confirm, however I highlighted the area because as of now, there's no heavy capitulation like volume spike that would lead me to believe silver is ready to bounce off the bottom channel.

 I'm happy to see USO has filled a small gap and broken through the LNR Channel. I'll be looking for a test of channel resistance around $38.75.

Copper also filled a gap and saw not only a channel buster in doing so, but a parabolic one as well. It's now testing the lower LNR channel and down about 1% on the day.

Today may be the day I add

I didn't have time yesterday as the MP is my last priority and members/updates are my first. However adding in this area to some shorts is starting to become more attractive to me, some reasons outlined last night, and some from today's trade which should have seen strong follow up buying, instead we are slightly down on the day, which isn't surprising given how the market reacted to the last Multi- Central bank intervention (2 days of rally and then a steep decline) as the half life of all interventions, whether it be the ECB or multiple Central banks acting in concert, is noticeably shorter then it was say 2 months ago.

The knee jerk reaction eventually gives way to the reality that another band-aid has been slapped on the problem and the fact that the band-aid had to be used, tells you something about the condition of the market above and beyond what we already know as the CBs are certainly way ahead of the curve.

The newly proposed "Redemption Fund" that was out in the main stream press (I haven't had time to understand exactly what it is other then the fact that it does not violate the German constitution) seemingly has not been well recieved in Europe as Europe's close was rather weak.

ES moved to the day's lows at the European close.

Furthermore, the sovereign yields and spreads that improved dramatically today, slipped back lower toward the close.

Commodities moved lower in to the EU close as well.

Finally the broader Context Index continues to move lower, which supports much of what we have seen in our own more specific risk/credit indications which  will update below.

ES (S&P Futures) in orange remain elevated above the broad risk asset model (black), these divergences pretty much always revert to the mean so it appears ES is overvalued and due to pullback to the model, however as selling picks up it often overshoots the model.

Our models...
 Here's the long term High Yield Credit (hourly), each dislocation in red has been followed by a drop in the S&P (green on all charts) and there's a very clear dislocation now. We started supplementing analysis with risk and credit indicators as they give a broad view of what "should" happen in a risk on rally/bounce and what actually is happening, it's somewhat synonymous with weak breadth in a rally or bounce.

 As for intraday there have been several moves lower in credit while the S&P has ignored them.

 Since commodities have performed relatively well, I am a little surprised to see this hourly chart's dislocation on this bounce. Even without looking at the oscillator (which help as sometimes scaling issues make the divergences between the two assets hard to see-it's still not a perfect solution), commodities are clearly underperforming the S&P as is especially apparent in the red box to the far right.

I showed you earlier several commodities not performing well today including copper and oil, two of the recent out performers.

 Relative to the Euro, there's a decent dislocation as these two assets have a fairly high correlation (move together). The chart above would suggest that the S&P is over-valued here. I'll try to figure out how much so by the Dow correlation.

 High Yield Corporate Credit also performed fairly well early in the week, but has since dislocated as is very obvious in the red box to the right (price window). Note each of the past dislocations have seen the S&P move down shortly after as credit tends to lead the market and thus the reason we follow it more closely.

 Intraday this is probably the biggest shift we have seen all week in HYCC. I'm always sensitive to changes in character in the market.


 In white you can see the weak spot of this oscillator as it works on Rate of Change and when rates don't move much as they haven't in the white window, the rate of change indicator remains flat, even when there's a pretty serious dislocation (it's still in the works).

 The intraday chart displays this best as rates are flat in the white window, the oscillator doesn't move, but to the right in the red box, rates  are moving and the dislocation becomes apparent. So far this pretty much just effects rates which the market tends to gravitate toward.


 The financials momentum indicator remains at a serious dislocation on the recent bounce (this is an hourly chart, the bounce is to the far right). This isn't surprising as financials are quickly becoming a problem again.

 Intraday financial momentum has leaked lower after a strong close yesterday,  had my opinion about that, we'll see how today's close pans out.

Lastly the EUR/$USD has seemingly hit resistance at the $1.35 level which has been a key level.

All of this taken together, I'm pretty likely to add to short positions on the strength this bounce has offered, this is what we were looking and hoping for last week, it's here.

GLD Update-Gold Topping?


I have been questioning for sometime whether gold is in a bubble, if I were to post that remark in certain forums I'd be strung up by my thumbs. Gold has a loyal following, more so then any other asset I've ever seen, which could also be the followers Achilles' Heel. One of the ways I judge bubbles other then technically, is when the layman all of the sudden becomes an expert on Gold, when people arrive early at garage sales to try to scoop up any gold jewelry and when a certain circle of people I know become deeply involved, it's usually right at the tail end of a bubble. That's my gut, here are the charts from micro to macro.


 Gold did very well under the inflationary and dollar deflationary QE regime and for a brief time when the market collapsed, it looked like it would be a safe haven trade, but it has vacillated so much between the two it's hard to make out what the rules are. With recent data from China, we may very well be entering a deflationary cycle (and the rest of the world isn't helping much there). QE options are becoming more limited every week it seems.

 GLD found support at the red trendline, I even posted in an update it was likely to bounce from there as it did, but the rally has been on very low volume.

 Large volume spikes near support areas are often reversals to the upside, a sort of mini-capitulation and we see that 2x here, but the cumulative volume indicator also shows how soft the volume has been on the bounce (in red).

 3C 1 min is literally running the other way in a leading negative divergence.

 Here's a zoomed close up of the 1 min chart, it seems this morning's parabolic spike may have been a last gasp of sorts and 3C was negative there.

 The 2 min hart looks just as bad and confirms the 1 min readings.

 And speaking of running the other way-look at the 5 min chart recently. That's a lot of confirmation on this bounce.

 The 10 min chart unfortunately isn't available on StockFinder so it has limited history, I can't place it' long term relative position, but I can see a negative divergence very clearly.

The hourly chart is the one that really seals the deal and why I will NOT buy gold long, not even for a bounce play. I may consider it a short under the right conditions.

 The volume and parabolic nature of the recent spike is a change in character and these often precede reversals.

 Long term MoneyStream is very negative on GLD and calling massive distribution at what appears to me to be a top.

 3C which was confirming the uptrend with higher highs (green) is now nearly as negative as MoneyStream. These two indicators do the same thing, but they are not coded the same, they are very different, so to see each giving the same signal tends to carry a lot of weight with me.

Finally, the long term buy area of the 150 day moving average has not acted like it has in the past. As a matter of fact, the moving average seems to be the support line of a triangle top that is forming, the volume is correct for such a top. I would consider GLD a short either on a false breakout of the triangle to the upside or upon a break down from the triangle in which I would add a partial position most likely, wait for an upside correction and add the rest of the position.

Looking at everything, I would say that the chances of gold topping are fairly good, even if it is not a huge secular top, I would rather bet on downside then upside at this point.