Friday, March 21, 2014

PCLN Update

Yesterday the 20th I posted two pieces on PCLN, a heads up to put it on your radar which essentially said...

"PCLN's longer term or core equity short charts are fine, I wouldn't move those at all as trend trades, but short term you'll see a little "W" base between the 17th and today, that has some accumulation in intermediate/short term charts. I would consider playing it as a long, but I'd prefer a call position, what I mean to say is as a quick swing trade a long in PCLN equity is probably worthwhile, I think with the leverage of a call, definitely worthwhile. I'll have some charts up soon, again this isn't anything that threatens the Core short, that's pretty much cemented, but it does look like a nice little trade especially with some leverage. Right now I'm more looking at timing than anything else so I'm definitely interested."

And then a follow up with charts...

Basically I like this as a short term bounce-type position with leverage meaning calls, as I mentioned yesterday the trade idea looks solid, but what I'm looking for (especially using options) is timing.

Today I think PCLN did a LOT more to move closer to that timing and early next week (Monday perhaps), I'll be looking at an entry , but once again as a reminder, the PCLN core short trend position will NOT be moved, this is a longer term trend trade for good reasons and I'm leaving it as such.

The set up is pretty basic, it's based on Wall Street using technical analysis against traders as they have been doing since the Internet and online brokers and the mass migration to technical analysis as a way of trading the market on your own without a broker's assistance. The concepts are a century old, in some case several centuries old and barely changed so it's pretty easy to know what a technical trader will do when faced with a technical concept and all Wall Street has to do is turn the tables on them as they know even better what these traders will do as they have the complete book of orders and know where they are already positioned to make moves, THIS IS WHY I NEVER PUT IN AN ORDER UNLESS IM READY TO EXECUTE...Would you play poker with me and show me your cards? If so, give me a call.


 On the daily chart, this is a concept II've talked about a lot, at "A" we have a clear trend, a clear character to the trend and predictability, at "B" something changes and changes in character lead to changes in trends which is exactly what happened at "C" as PCLN's price goes nearly parabolic. I've shown many times in the past how price goes parabolic like this or has a distinct ROC (rate of change) usually to the upside and especially at changes in stages like from stage 1 base to stage 2 breakout or mark up and then like we see above, from stage 2 mark-up to stage 3 distribution or top and then there's usually a volatility change or roc change from stage 3 to stage 4 but to the downside with the first break often being one of the larger.

I often say, "Price is deceiving" because at "C", what looks like an even stronger trend in PCLN more times than not is actually the end of that trend, look at historical tops and look at the transition area from mark-up or trending up to the top, you'll see price shoot up nearly parabolic right in to the top.

 Taking a closer look at the daily, here's where Technical analysis comes in, there's VERY defined support and resistance, this area is ripe for a head fake move  because it's easy to know how traders will react at such areas, a breakout above the clearly defined resistance and they'll chase price or buy the break out which they call confirmation, but it's typically just chasing and often puts you in a tight spot.

If price drops below the well defined support, they'll sell short. Lets assume price will drop below support because that's what I think will happen and have been expecting, traders will come in and sell PCLN short on a break of support and that's typically where we will see the head fake move as institutional money accumulates below support because it's easy to do. Remember , their positions are huge compared to ours and they must be careful entering them, we are not going to move PCLN against us with a 100 share lot, but when you are trading 10's of thousands of shares or more, it's easy to do.

What the break below support gives institutional money is supply, sellers who are stopped out are providing supply on the cheap, short sellers who are again, selling, are providing supply on the cheap making it much easier to accumulate a large position (by our standards, not by institutional money standards) without moving price against them.

Next, to make the trade work all they need to do is work the bid/ask or put a little money to work and push price back above the support area that has become resistance, most technical traders who are short will have their stops right above what they perceive as resistance (former or current support), that creates a short squeeze. 

On the short squeeze the next "DEFINED level of resistance around the  $1317 and don't think the actual resistance of $1316.99 isn't intentional as the buy limit orders work VERY nice with the whole number which the human mind gravitates toward anyway, $1317, why do you think retailers always use $.99 instead of $1.00? It's not a big difference, but the human mind perceives it as a big difference as we are inclined to gravitate toward whole numbers.

Once a short squeeze triggers the buy to cover orders it easily propels across the $1317 level where buy orders are lined up or will be. The "buy to cover" orders create demand, they are in fact buyers driving price higher, when the $1317 level is crossed the longs step in and that creates even more demand moving prices higher and what did institutional money have to do other than know how retail technical traders would react? Not much, they didn't have to buy so much PCLN that it moved on its own leaving them a lot less profit. THIS HAPPENS EVERY DAY.

 This 60 min chart shows the "Tweezer bottom" which is a bullish candlestick reversal that acts as support, this is what I was pointing out yesterday as a likely area for price to cross below and initiate the trade, that's also where I'd likely (as long as I have 3C confirmation), enter a call or long position although for this position I prefer a call because it doesn't have a large accumulation area for a long duration move.

I doubt it's coincidence we ended the day right at that level.

As for the trend or core PCLN short positions, this trade doesn't threaten them at all and that's why I say I wouldn't close any of the core PCLN equity shorts. The 4 hour chart shows MASSIVE distribution which is right where we'd expect the top just from the nature of price action alone as mentioned above.

There was a range that was pretty clear, it was broken and traders will buy that breakout and it was distributed to weak hands or retail longs buying the breakout.

I could post several other long term charts showing the same heavy distribution and why I would not close a trend or core short, but I think that's enough to get the point across.

The 10 min chart has more detail than the longer charts which have less noise and more trend, but the 10 min chart does show us distribution at the highs and VERY recent accumulation of the area around support (white arrow).

This is what I was seeing Thursday and why I said to put PCLN on your radar as a TRADE, but was still waiting for the right timing which means in my vernacular, "Waiting for the head fake move or the trap".

The intraday 1 min chart shows PCLN was distributed on the gap open higher, but as it drifted lower toward support from 3/14, note the positive divegrence. This is why I think we get a head fake move to the downside first, then a break higher and why I want to enter a call position (long) on the head fake move as buying a call in to a break below support as PCLN is moving down while 3C is confirming institutional money accumulating that break gives me the best premium on the call option, it also gives me the best risk profile.

So... that's what we're waiting for and if you saw the Market Update/Leading Indicators. today, that's what looks probable for early in the week. Why not make some money on a trade that either comes to us on out terms or we just skip it?

XLF Charts

I'm not posting all the charts as there are a number that have the EXACT same signal, just enough to show you what that trend is and why I want "some" exposure right now. By the way, I'll likely add to the GS April $165 Put on a bounce which I think it sees Monday.

 As for my X-Over System, you can see the long signal and there have been 2 of 3 interruptions in that, the 3rd is a short sell signal, but being 3C leads faster than the moving averages, I'm essentially front running a signal I think will be here soon, but I wouldn't get as good of an entry in waiting for it.

 This is the 4 hour chart, I think that's pretty clear, stage 1, 2, and 3

This is the 2 hour chart and where you see a trend start developing in just about every important long term and intermediate timeframe chart, negative at the last pivot high, worse at yesterday's

This is the same on the 60 min chart, here I included the market wide accumulation from Jan 27 to Feb 5/6th and the Feb trend that was born of that accumulation and strong head fake move. Again the same trend at the last two or more pivot  or reaction highs.

 I didn't include others because the 10, 15 and 30 are all showing the same thing.

Here's what was expected for the week from last Friday, and the breaking of that with HYG, we are leading negative, that alone is enough considering the other signals for me to enter a FAZ long position. As far as timing which has to be more precise with options...

It's very hard not to take at least a partial position when the intraday 1 min looks like this. Even if I expect something a little more next week, which I'm not sure I do, that doesn't mean Financials won't rotate out as they rotated in yesterday.

 As for FAZ 30 min, it's pretty clear, it's also the mirror opposite signal of XLF in all of those timeframes mentioned.

This 5 min chart IS SCREAMING, I have a VERY hard time ignoring these signals.

The 2 min looks great as well.

THE ONLY REASON I WENT PARTIAL IS THIS 1 MIN FAZ

This shows what looks like a short term pullback in FAZ or bounce in XLF, if that happens, that's where I add the rest of the position, at this stage I don't even need 3C confirmation as there's so much.


Trade Idea: XLF Short / PUT

I would add to my FAZ long in the trading portfolio, but it's already near full size and adding to it doesn't make much sense considering transaction costs and it's not down by much.

However my point in saying that is that I would have no problem opening a partial position short XLF using FAZ 3x short or SKF 2x short.

I'm going to use April $23 puts, but at half normal position size as I think there may be a little bounce or at least some lateral movement and waiting another day to add the rest may get me a little better pricing, in the mean time I still have the exposure.

I'll be positing some charts shortly.

Market Update/Leading Indicators.

Lets start with the market update as it's faster, I'll use the SPY as an example, it has the best proxy signals for the rest of the market.

 Intraday 1 min SPY shows distribution early at the open and some small accumulation that looks like an afternoon bounce in to the close.

The 2 min chart shows no such bounce meaning it's likely weak and the majority of the action today has not been positive in any way.

The 3 min chart is leading to a new negative low, this is rare with price moving down as the street rarely sells in to lower prices.

And the 5 min is also hitting a new leading negative low intraday. If you follow the yellow arrows this is the VERY basic concept of what I expect in to the afternoon, perhaps early next week as window dressing is completed.

QQQ intraday also showing a probable EOD bounce signal, is it enough for me to even day trade? No I wouldn't take that risk, especially as Russia / Ukraine is more of a wild card this weekend than last, we knew what to expect last weekend.

And the IWM with distribution at the intraday highs, and a small 1 min positive at the lows. There's no other significant signals intraday in these charts beyond the SPY.

However the Leading Indicators tend to confirm my tentative thoughts about early next week and window dressing, this doesn't stretch as far as a tradable bounce right now, it just tells me it's likely the VXX reversal process will look mature and complete by the time we are ready for the reversal and that's where I want to enter the majority of short positions that I'm interested in and wrap up any market correlated long exposure as I think as we move to April we will see a much different tone once the quarter's end window dressing is complete.

*LEADING INDICATORS ARE ALWAYS COMPARED TO THE SPY/SPX (GREEN) UNLESS OTHERWISE NOTED.
 HYG (High Yield Corp. Credit- the manipulation lever)... You  can see an outperformance of HYG vs the SPX correlation which suggests some short term upside for the market, that may be in to the close or even in to early next week, this does not suggest any serious upside whatsoever, more along the lines of ranging in the area we have been in the last several days thus far.

High Yield Credit which is not used as a lever and therefore has no manipulation relationship was selling off yesterday which is appropriate considering today's action and has seen a little better relative performance today going in to the close.

As for our sentiment indicators (professional, not retail) they were selling off yesterday, again appropriate and have seen a little strength today, but again I stress a "little".

Our second sentiment indicator is confirming the exact same as the one above.

This is VXX vs the SPX correlation, to do so since they move opposite each other I've inverted the SPX prices and you can see that VXX or short term VIX futures have lagged or seen a little relative weakness vs the SPX which is to be expected if you recall the reversal process map I drew for VXX, ultimately this is a strong signal for VXX as it needs that reversal process to move to the next stage (VXX up/market down).

 In addition VIX Futures have shown they have used the lower prices today to accumulate which is exactly why we wanted them lower last Friday so this is why I say this is a good signal ultimately as far as the purpose of this week's price action.


As for VXX...
 We also see accumulation in VXX (short term VIX futures) today.

More importantly, the entire larger picture process that we foresaw happening this week as of last Friday afternoon, has happened EXACTLY as envisioned, which is good for our market positions and opportunities in the coming days.

The 5 min chart is not only leading positive in a big way, but the reversal process that seemed like it may not complete on Wednesday's F_O_M_C policy announcement as the knee jerk lower in the market sent it higher, has done as expected and come back down to the rounding reversal process and continued to accumulate, the entire point was and is smart money doesn't chase nor do we, this is the process that needs to happen as a timing cue/trigger as the larger VIX position is already in place,  THIS WOULD BE AKIN TO THE FUSE.

As for the market's lever helping to push stocks higher which was really all about moving VXX lower, we see continued deterioration signaling that we are approaching the end of the mini-cycle, VXX should have flying leading divergences soon while HYG should be ready to drop like a rock with the market soon.
 Absolutely no acumulation or even in line status in HYG intraday, distribution continues the unwind of the position which is the only thing holding the market together right now and I believe for the express purpose of allowing smart money to finish putting on protection in VIX futures.

The 3 min chart as we saw started distribution earlier this week, that has increased every day since and today it's leading negative on a fairly strong intraday timeframe.

And the 5 min chart, earlier in the week we had NO negative divegrence and I was looking forward to the 5 min chart showing something, now it is leading negative in a large way, *NOTE THERE'S BEEN NO ACCUMULATION IN HYG SO IF THE MARKET SEES ANY UPSIDE WHATSOEVER IT'S LIKELY TO BE WEAK AS THE ONLY ASSET SUPPORTING IT IS SHOWING DISTRIBUTION IN ALL TIMEFRAMES.


TLT/20+ YEAR TREASURIES OR THE "FLIGHT TO SAFETY " TRADE VS INVERTED SPX/SPY PRICES SHOWS THE "FLIGHT TO SAFETY" TRADE IS IN FULL SWING AS YOU'D EXPECT WITH THE FLIGHT TO PROTECTION IN VXX.

Interestingly, commodities have been slammed because of the Chinese unwind and cash calls, however as noted earlier today, I think we have a chance for a copper short squeeze and entered JJC long for that trade earlier today...

Note how commodities are not falling like they have been, but rather ranging as we often see when there's accumulation, THIS JUST MAKES OUT JJC LONG TRADE A HIGHER PROBABILITY SUCCESSFUL TRADE.

And finally the patron carry saint for the market, AUD/JPY is in line and able to offer intraday support for a bounce in to the close, I WOULD NOT READ ANY FURTHER IN TO IT THAN TODAY. 

Quick Update

As the 2 pm hour approaches, typically most contracts are wrapped up and the price pin is removed, this means price will do what it wants, in this case I think it bounces a bit in to the close, but the 3C signals in to the EOD are most important as they give us the best lead as to what to expect next week which will be the t+3 settlement for window dressing on Wednesday and the end of quarter by March 31st the following Monday so we still have some room for gaming the market.

I expect an intraday bounce in to the close starting soon, not something I'm too interested in trading at this point, but after the next post with charts we'll see where we stand.

Trade Idea: JJC (Copper Long) Counter Trend Trade

Copper has been hit really hard with iron ore and a few other commodities that companies in china use for collateral in the shadow banking system, "Commodities for cash". Since the Chaori default the market over there has been nervous, the banks have stopped lending and they've not only cancelled new deals, but put in cash calls on loans which has forced the company's that put up the commodity as collateral to sell it to come up with the cash. However now that we seem to be getting a bounce in China (See my last post FXP) it seems likely Copper will get an oversold bounce as well, it's that whole "Blood in the streets" thing, not so much a fundamental change in China.

I did mention copper earlier this week, specifically Ways to Play China  in which I noted,


"Look at Copper today, it just broke MAJOR support...
You know we don't chase assets, but try to let the trade come to us so right now copper is a no go play on China, however, the same volatility shakeout that is applied to H&S tops is VERY likely going to be seen in copper in which a massive short squeeze will send copper back above former support (now resistance) and that's where we can take a look at copper short as the trade would be coming to us."

It looks to me like we may be in a decent place to play a volatility shakeout/short squeeze being under long term support, it's the perfect place to run a short squeeze and shakeout new and older shorts. Above is the chart I posted on Wednesday and you can see what I envisioned, a short squeeze (yellow arrow) and then a plummet lower (red arrow). The first trade would be the short squeeze, then we'd be set up to look at a copper short after that so two potential trades.

I'm going to enter JJC (copper) long in the trading portfolio, the options liquidity here is very poor as is the volume, but I think it's the best choice out of a what we have to work with.

Here are the charts backing up the trade idea which I will enter at full size in the trading portfolio as soon as I get this posted.

 This is the weekly chart so major support has been broken, this draws in the shorts as they like to enter a trade on confirmation like the break of long term support. Wall Street loves to shake them out.

On a 5-day chart we have a bullish Harami candlestick reversal, or as the Japanese call it, "Mother with baby", but it is a bullish upside reversal and the increased volume makes it at least 2x more likely to be an effective reversal signal as well as putting in a short term capitulation event.


On a daily chart we see there have been a couple attempts at resistance on increased volume, that means the ask stack has been slowly chipped away at and we should be able to break right through that resistance level which will facilitate a short squeeze which is a nice momentum move higher.

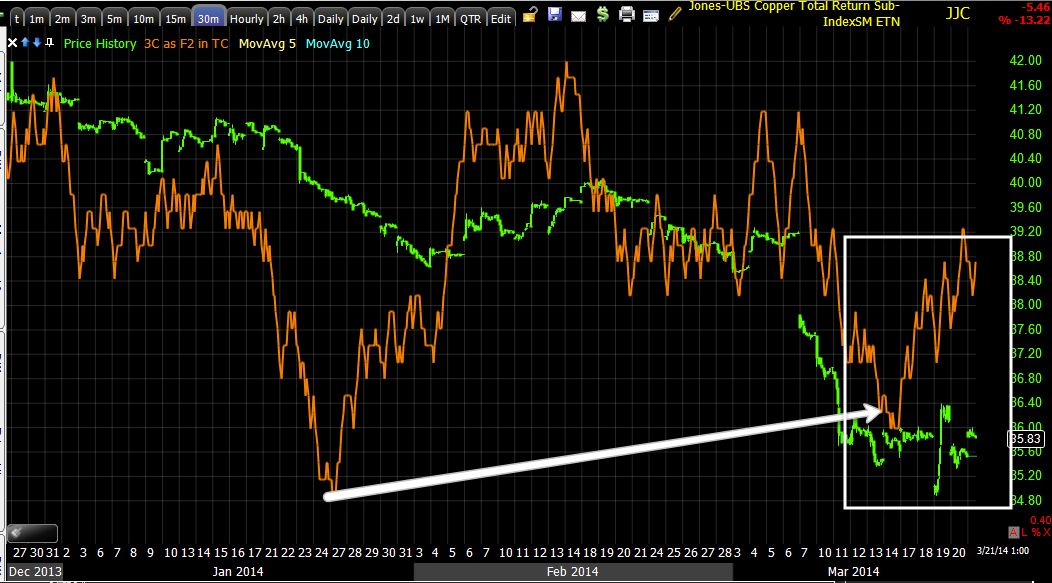
The 60 min chart shows a positive divergence at the new low

 As does the 30 min chart and several others so there's enough confirmation for me to trade this as a swing/counter trend trade.

I'd prefer options, but the market is so thing, the bid/ask spread is pretty darn wide.

Here's the 5 min chart, there may be a little more work needed before JJC is ready and with op-ex that may be playing a role, but as an equity long position, i'm not very concerned about it.

I'll be entering a full size trading position and when that breaks above resistance and stars to see distribution, I'll mover out of the long and look for a new short entry as these volatility shakeouts are pretty common in these situation like a newly broken H&S neckline, this is just all the more impressive because of the size of the support level broken and the recent sentiment in Copper which has been horrible, this would definitely be considered a contrary trade.

FXP

I have been hoping for a while to get some downside movement in FXP (China 25 Ultrashort) for a long entry as a way to play Chinese weakness broadly, it hasn't happened, but with today's move to the upside in China we are getting a possible entry long FXP, we definitely aren't there yet, but this is one to have on the radar and offers the kind of portfolio diversification that we just can't get in most US stocks broadly, plus it's a different global economy more so than ever.

So here's where we stand, what's likely to happen and how we can let FXP come to us at not only a better price, but lower risk and that's the difference between a high probability and a high probability/low risk trade.


 This is the Daily FXP chart with Wilder's RSI 6, the divergence in RSI is clear and this is a nice opportunity that we haven't seen all year, I'd think FXP would be below the ascending trendline by the time it's looking like a possible/probable long play and thus we have some broad exposure to China.

 My Custom DeMark inspired Buy/Sell signal indicator gave a clean buy at the bottom and several sell signals that worked well and a recent sell. At the orange box we have a Harami (bearish) candlestick reversal pattern, at the yellow box we have a head fake move or bull trap to new intraday highs which closed lower trapping longs buying the intraday breakout, that is enough to give us some decent downside momentum as most head fake moves are designed to provide (increased momentum).

*Note the gap, there's a decent probability it is filled before the ascending trendline is broken, although it's not as high a probability as other gaps in general just because we should eventually fill it any way.

As far as longer term 3C charts from 60 mins we can see the accumulation of the base and a head fake move as we almost always see right before a reversal (upside here) which was in the form of a run on stops, allowing a last accumulation effort as the stops provided supply at cheaper prices as well as creating a small bear trap for upside momentum on a short squeeze.

The distribution is clear as well, there was a head fake on the upside as an intraday break out just before the downside reversal, head fake moves are an excellent timing cue for a reversal as they typically occur just before a reversal and we knew it was a head fake because there was a deeper leading negative divegrence in 3C at the attempted or failed breakout.

 Just for confirmation, the 30 min chart.

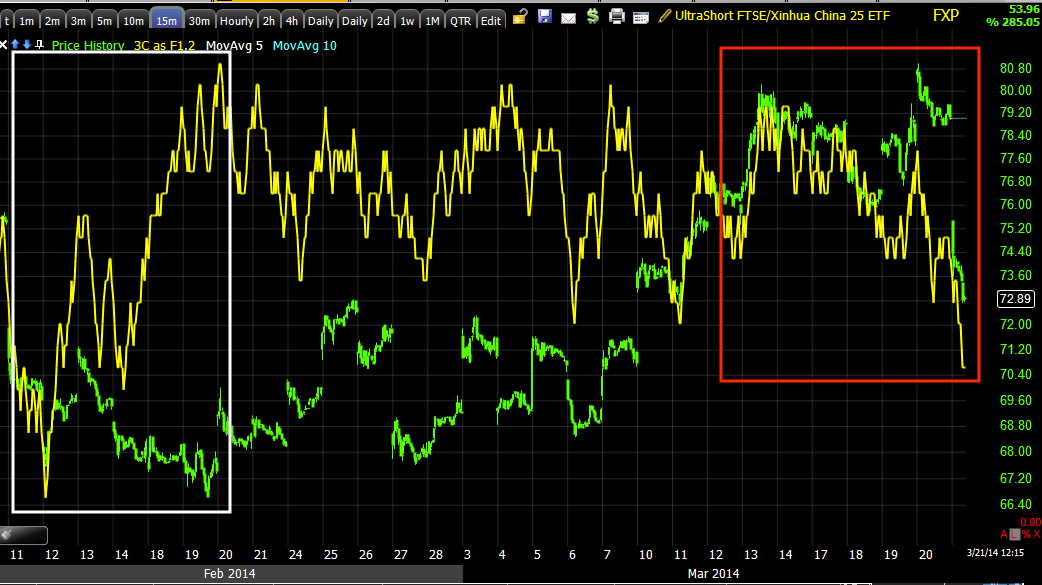
Again for confirmation the 15 min chart so we aren't dealing with an anomaly.

 The 10 min chart has much more detail from confirmation of the uptrend to distribution, but for a pullback, China is not fixed, in fact it's on the slippery slope.

As far as the intraday chart, there is a 1 min positive and this may lead to a gap fill, it could be traded, but this is not where the probabilities are, they are in a pullback that sees accumulation and that's where I want to be a buyer, I'm thinking the <$70 level.

If the gap is hit which it should be either way (short or longer term), here's where it is from today.

The orange area on this daily chart.

The idea is let FXP come to us on a pullback likely below the ascending trendline in the <$70 area, look for accumulation to confirm a constructive pullback and enter FXP as a longer term trend position or core position (long) short China.

I'd put this on your radar, set some price alerts around $70 as a reminder and we'll take it from there, I've been waiting for this all of 2014, China's seeming counter trend bounce looks like it will give us the opening we have been looking for this year.