Wednesday, July 2, 2014

Daily Wrap

It's always the days when you feel like you are watching grass grow that are the most dangerous and you need to be paying the most attention, since I haven't said it in a while, "It's like the kids in the room next door being just a little too quiet, you know they're up to something" and that something is what I spent a good part of the day looking for.

Tomorrow is going to "theoretically" be a very volatile day, although the set ups in advance didn't seem to materialize, I'm guessing not many know what's going to happen. First it will be a low volume day as  the equity markets close at 1 p.m. and are closed Friday which means whatever high level traders were left on Wall St., they're on their way to the Hamptons right now for a nice 4-day weekend. Non-Farm Payrolls are pushed up to tomorrow as the market is closed Friday, that's at 8:30 as weekly Initial Claims also come in at 8:30. 

If the pretty much irrelevant, backward revising ADP employment report can cause as much volatility as it did this morning at 8:15, just imagine what one quarter of a market will do on Initial Claims and most importantly, NFP at 8:30 tomorrow morning.

This morning as ADP was released and came in with the biggest beat and best print since December and November of 2012, the $USD knee-jerked higher then spent the rest of the day treading water laterally, gold and silver both spiked lower, then gold and silver both moved higher (especially gold) in to early and mid morning and gold later started to roll over in to the afternoon along with Gold miners (GDX) who saw a nasty little end of day plunge.

GDX's late day plunge on heavy volume, still managed a 0.91% gain on the day, but trading lower in AH. You may recall we closed our long NUGT position last Friday, Closing the Rest of NUGT Long Position to preserve 40 and 50% gains as GLD and GDX are both set and need a pullback which I have every intention of buying as the charts there are still spectacular on a longer term base that is very close to a stage 2 breakout. I see that pullback heading at least for the 22-day moving average.

Gold was seeing stronger distribution signals today, they have been strong since the 30th but especially around 1 pm today.
GLD 5 min, signals last week were more than strong enough for a pullback, today's leading negative mostly from 1 p.m. makes me consider adding a GLD put if prices are still at a reasonable level tomorrow, I don't care much for the volume of most of the leveraged gold inverse ETFs.

Gold futures give us a good idea of the short term distribution/profit taking that precedes a pullback.

Also sharply leading negative, so these should pullback no problem, but the longer term chart patterns and accumulation in both gold miners and gold are spectacular, especially miners which I believe will lead gold as they use to before the F_E_D got involved in the market.

We are VERY early in the gold trend (miners too) as they are both still within their bases, I think this is going to be a huge winning position over the next year or so, but just as importantly this tells us something about inflation expectations as gold is bought on inflation expectations, well before actual inflation which is (as I have noted before), the one thing that will force the F_E_D's hand to hike rates as they were even warned this weekend by the Bank for International Settlements (the central banks' bank),  which said, that "leading" central banks shouldn't "hike rates too slowly or too late" which the market is going to hate as that's a market bubble buster every time.

Also on the ADP report this morning (which is usually widely ignored because it's so noisy), 5 year, 10 year and 30 year treasury futures fell sharply, even though this is directly attributed to the ADP as they fell at 8:15, there has been a trend the last several months of treasuries selling off the first two days of the new month (I suspect it has something to do with bank window dressing as we just saw a new record via the F_E_D's 1-day reverse repo to the tune of 1/3rd of a trillion dollars in borrowed collateral for 1-day, the last day of the quarter, WINDOW DRESSING).

Note the negative divegrence in 30 year treasury futures from around midnight to 4 a.m., then 8:15 ADP at the yellow arrow and accumulation in all 3 treasuries the rest of the day. As far as any leaks of NFP, traditionally the Chairperson, Yellen, of the F_E_D receives the data the night before, of course media outlets will have it on embargo early, but it makes me wonder what the knee jerk to a better than expected NFP print might look like?

As mentioned, the $USD shot up on the ADP data and then treaded water the rest of the day, USD/JPY gained on $USD gains, however the market TOTALLY ignored the usual market mover.


ES (purple) vs USD/JPY (candlesticks), you can see the 8:15 ADP spike in USD/JPY, but SPX futures (ES) are flat as a dead cat. I don't know what to think about that other than the distribution in to the flag of the last week and the head fake move of yesterday.

Speaking of flat as a dead cat...
The major averages ended the day as follows: SPX +0.06%, Dow-30 +0.11%, NASDAQ 100 +0.12%, Russell 2000 -0.54% and Transports -0.36% with the Dow having its narrowest range day since December which has in the past led to corrections, which makes sense as the daily candlestick would have a tiny body and wicks, a typical candlestick reversal pattern. If the Dow breaks $17k, it's not going to be on any strong accumulation whatsoever as you saw in today's intraday updates, maybe it does and provides 3 days for the bulls to wallow in their "apparent " victory, it would also set up a nice bull trap,  because the only thing I've seen set up by Wall Street the last week or so has been the flag that saw a head fake move yesterday with significant negative divergences in to it.

Each time the Dow has neared the 17k level we have seen progressively deeper leading negative DIVERGENCES with this last one leading to a new low as price is the highest of the 3 attempts making this the largest divergence and it gives us a pretty clear sign of what's going on, DISTRIBUTION IN TO PRICE STRENGTH.

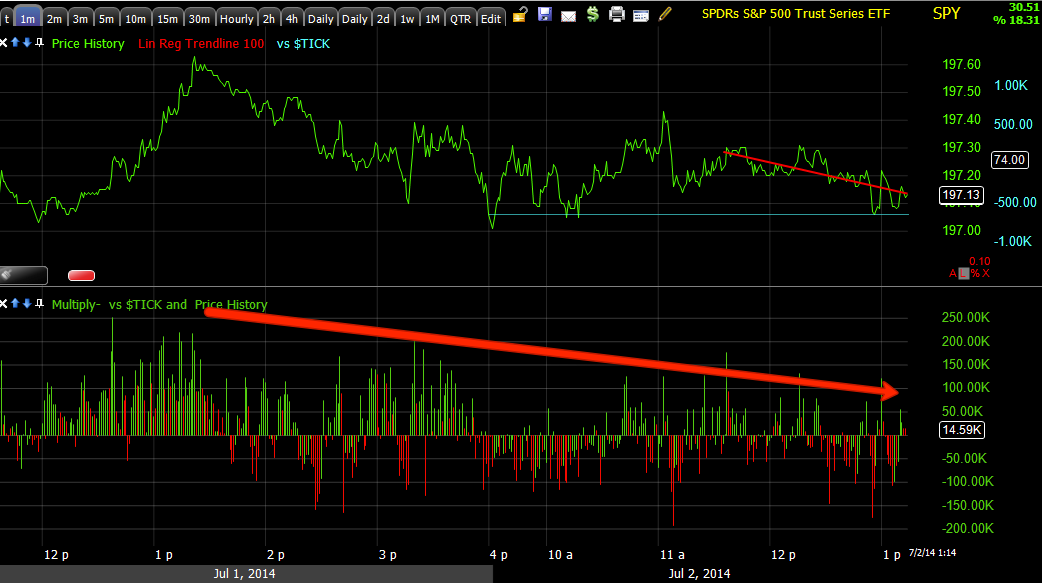
You probably saw the small intraday positive divergences that might make a run for Dow 17k, they don't hold a candle as far as the underlying trend to this chart. Here they are in case you missed them, not much to see, certainly nothing I'd trade...Dow 17K 4th of July? Just off the top of my head, perhaps that's what the game is, all the bulls expecting 17k to be taken out so they're all in? It leaves them holding the bag which is what the game is all about at the end.

Even the VIX today didn't move the market!
The VIX (red) is hammered early on the open, the SPX, FLAT. The Index futures didn't even move on the ADP data that moved everything else from the $USD to carry pairs like USD/JPY to treasuries and precious metals, Index futures barely budged.

YES, SOMETHING WAS VERY STRANGE ABOUT TODAY'S ACTIVITY.

HYG was flat today after selling off yesterday, it looks like it could be used to support the market for a half day tomorrow, yields were the same unless the positive divegrence in treasuries send them lower before the open. Credit markets were ugly in the early morning, but regained some of the lost ground the rest of the day, the certainly weren't leading.
 HYG vs the SPX, at 1 as normal it's ramping the market, at 2 it's leading the market and the SPX plays catch-up and at 3 it's leading the ,market, but this time to the downside, although it was flat today which might be used as a lever for tomorrow, I just can't imagine much is going to trump the NFP on such a short day, but you never know with volume as low as it will  be.

Professional sentiment remained sour today, it was selling off on yesterday's head fake move above the flag-like price pattern and continued selling off today as the SPX was flat across the day, just as we saw in TICK with +/- 500 readings most of the day.  Something certainly doesn't feel right, especially with a number of short trades setting up the way we had hoped.

As for MCP, it was down today on a Seeking Alpha article last night suggesting that if they don't raise cash, the stock is worth $1.60 a share which sent it down in premarket, however there were positive divergences on the day and the longer term ones remain in place, I'm beginning to wonder if a GS or someone else like that is an accumulator and also a facilitator of a capital raise? Clearly this is retail selling, a GS is not going to sell on a Seeking Alpha article, they have much better research.

 MCP's longer term 30 min positive divegrence with our last trade at A when $2.50 was broken, we had a +12% gain the next day in equity longs and a call position that was in the double digits closed the same day. At #2 I was looking for a stop run under $2.40 and potentially another call trade, but the short term charts didn't give a strong signal like at #1, however as I was watching today, I came close to looking at a call trade at #3, here's the intraday action below...

MCP intraday 3 min positive divergence, if this hit 5 min leading positive I would likely have entered a call position, but it still has time.

As far as the rest of the volatility for tomorrow, we have International Trade also at 8:30 (lots of data dumping at 8:30), we have PMI Service at 9:45 and ISM non manufacturing at 10 a.m. and we close at 1 p.m., lots of data in a condensed space on ultra-low volume, should be interesting, maybe set up some option trades.

Oh, of note, SKEW ticked up again today to the 140 level which is an extreme, which means OTM low strike puts are being bid up, someone is desperately seeking protection via a hedge against longs or just have heightened expectations for a Black Swan event, otherwise known as a market crash.

Index futures are still range bound and clogged up, nothing on the intraday charts even approaching a divergence, this is one strange day.

I'll check in if anything changes in futures.


SCTY, Z, NFLX

On the close I didn't get the exact bearish engulfing candle I'd like to have seen, but SCTY did retrace 82% of its move today to end with a bearish candle,

Volume was increased today, but it's not something I was too concerned about. While not a significant gain, between yesterday's 1/3 position and today's add to 1/3rd position, the SCTY position is in the green now, again not a big deal, but this is what I'd like to see when phasing in to positions, getting the best entry with the least risk.

The speculative 1/2 size Z position is also starting today off in the green.

The NFLX put position (July $465 puts), Opening NFLX July $645 Puts Now entered yesterday on what I believe was a head fake move above very clear resistance in a popular stock, started this morning being down about -20%, for options this isn't as big of a deal as it sounds, they can move quite a bit quite fast as long as you have some time on them. NFLX did cross below the 50-bar 5-min moving average, which was the original trade set up from yesterday, it crossed that moving average today and the change in price's character was almost immediate. The position ended the day today only down 5.44% from today's earlier -20%.

Look at that change in character as soon as the 50-bar 5 min moving average was broken today.

Quick Review Of Index Options

Here's a quick peak of Index options, you'll notice today looks like total noise, only as you move further out do trends become apparent.
 ES 1 min

NQ 1 min

at least TF is following price down, closest thing to a trne d all day in index futures...

Longer term charts though...
 NQ 5 min

TF 15 min,

it seems to me the R2K is getting ready to see a stronger or leading move down, consider yesterday's IWM volume and shortly thereafter the volume surge in SRTY (3x short IWM), in addition index futures not looking good, nor are the averages. I still like SRTY as a play on the broad market as well as small caps.

The SRTY position with 3x leverage is down around 5.5% which is very manageable for a 3x leveraged ETF. I'd consider adding or perhaps putting out a new trade alert, but I need to look at leading indicators, yields, treasuries, and breadth as well as some other candidates to see which has the best looking set up now.

Dow 17K 4th of July?

Many of you have written in today suggesting that the Dow $17k is being saved for the 4th of July 3-day wekend where retail can fester and gloat in the new DJ-30 high, setting them up for a nasty surprise on the open of next week, I suppose this is possible, it's something I would have suggested in the past, however I don't see why a move above 17k yesterday and further moves today and tomorrow wouldn't be just as if not more effective, it almost seems as if there may be limited firepower to accomplish this goal and that (if what many of you think is correct) it has to be preserved for the right moment like tomorrow's half day in which there will be a skeleton crew on Wall St. with EXTREMELY thin volume making the market a lot easier to move, that still tells you something about what firepower is left in the market if that's what needs to be resorted to.

Don't forget we have non-farm payrolls and Initial claims tomorrow, NFP being way more important, it would seem to me any good news would be bad news as that just puts the F_E_D further in to their mandated or stated goals which they've already surpassed on both mandates. I would think that would be the defining tone of the market tomorrow, but the market works in strange ways that are set up in advance.

If I were very sporting I may take out some weekly DIA calls (next Friday's expiration) for such an event, I don't see any positive divegrence in the Q's and we have seen the averages with a 1+% gain in the Russell while the Dow prints red on the same day so if I had to choose, I'd go with the Dow calls, but I'm not that sporting that I'd be willing to see if there's a gain there still available to collect come Monday morning when the market reopens at full staff, higher volume.

For now, the TICK has remained in an extremely narrow range today and we have divegrences intraday in 3 of 4 averages.

 TICK in the +/- 500 range this afternoon, as tight as tight can be.

The DIA has a leading positive divegrence, not the typical, but it should do the trick in a half day market with volume VERY low, this is a  2 min chart. I don't usually trade any divegrence unless it's at least out to a 5 min chart so this small period on a 2 min chart doesn't cause me to want to take that risk.

The broader 15 min trend during the last few days, very ugly.

 IWM intraday 2 min positive, again I would not take the risk of chasing this.

And the 15 min trend of the last 2 days.

The SPY is very hard to even call a positive divegrence, this is as close as it gets and...

The 10 min trend overall and last 2 days, I would not trade this long even with the signals we have.

As mentioned, only 3 of 4 average have anything approaching a positive divegrence and not impressive enough that I'd hold over the weekend.

QQQ has no positive and is seeing an increased amount of decay today after being one of the best underlying performers.

PErsonally, I'd just leave the calls alone unless something larger develops.

In Index futures, there are no positive divergences at all, there's a small negative in the $USD. There's no positive on 1 min charts and 5 min charts have nothing but leading negative divergences.

I'll try to get Index future charts up, I want to look at a few other things.

Personally I wouldn't mind if any downside was put off over the weekend, it would give me more time to gather more assets that are ready to enter positions in rather than scrambling all day and in to the night.

That said, these are VERY weak, be careful if you try to trade them.

Z Chart Follow Up

There's still an intraday IWM divergence brewing, but I'll cover that later. For now SCTY, even Z are already at small gains and the NFLX put has cut it's loss from this morning in half and is very much within reasonable limits for the position. When you see so many shorts lining up at the same time, it's like that old, very time consuming way of measuring the market by looking at hundreds of stocks a night, but it was effective.

In any case, here's the Z charts, the reversal process is my major concern and why it's a partial position, but other than that, I like what I'm seeing.

I'm just guessing, but I think it's reasonable to assume higher rates would have a detrimental effect to a company like Zillow.

This is where I usually start, on a 5-day chart to gather in information about the character of the stock, where it is in the 4 stages, etc and what I notice here is a very pronounced increased rate of change, in fact a parabolic price move and I never trust them whether they are up or down, they tend to end badly.

 A closer look at the weekly shows several reversal candlesticks and how increased volume increases the probabilities of these becoming effective reversals, remember they don't give any forecast on the size of the reversal, but a weekly reversal candle should see at least a week of reversal.

The Doji Star we have currently is a loss of momentum, a balancing of supply and demand whereas before, demand was outstripping supply, this is an indecision candle and just like anything that loses momentum like a ball thrown up in the air, there's a high probability of a reversal at that point.

 On a daily chart you can see the former trend line and the increased ROC break-away, I often say these increased ROC break-away's are "seemingly" bullish, but between EVERY stage (1 base, 2 mark up, 3 top and 4 decline, there's always a change in the ROC of price just before entering the next stage.

I mentioned a stop above recent intraday highs, I prefer something wider, but even with a tighter stop of $145.75, you still have a position risk of only 4.2% which is well below the norm most traders use of 7-8% which I find totally arbitrary as each stock has much different beta so one percentage stop doesn't fit all. This can still be position sized so it only represents 1 or 2% loss of portfolio if it is stopped out, again that's via position sizing which is a handy little calculator I have created for the new site, giving you both the maximum share allotment for the 2% rule as well as for your own maximum position size, mine tend to run around 15-20% of portfolio (total position size of a trade).

The last several day's daily candles also have higher wicks which is a bearish sign of a rejection of higher prices intraday.

 As for my Demark-inspired custom Buy/Sell indicator, it has given 4 sell signals in Z, each has been virtually right on, the current one is much larger and I do find that has a correlation to the size of the reversal.

 I don't show this often, but do look at my MACD Heat Map, you can see the faster blue has gone in to a negative divegrence while the longer term Red/Yellow are very large, typically very bearish with a small blue or negative blue reading within them.

As for the 3C charts...
 The 60 min overall underlying trend is where the highest probability resolution is, it has been negative which would suggest distribution in to the increased ROC which is often the case as stage 2 ends and moves to stage 3, however the even more negative recent downturn to a new leading negative low deserves some attention.

 The 15 min chart in line with price and even showing a positive divegrence at a dip in price, after that it looks like pure distribution in to the following price trend. If an institutional entity hasn't moved their entire position and you have price turning down as it was at the divergence, it's not uncommon and often seen by market makers and specialists to create enough demand to get the trend back on track to finish the job.

 The 10 min chart shows the exact same thing which is why I like to use multiple timeframe confirmation and multiple asset confirmation.

 As far as timing, it has been intraday charts I've been watching for our member in Z, this 3 min has gone negative and over the same period as the flag which seems to have been used exclusively as a distribution zone as seen in charts of the averages so the fact that we see the exact same signal on the exact same days starting at the 25th tells me something not only about Z, but confirms suspicions about the market in general.

And finally 1 min intraday going negative at both intraday highs, thus forming the longer wick daily candles as intraday highs were distributed.

The only thing I'm not crazy about is the lack of a reversal process, but I can give a little slack because of the parabolic price trend.

Trade Idea: (Swing) Z

I'm going to open a speculative (1/2 size) short position in Z. I've been watching it for a member who entered it a while ago and it's finally looking interesting. The reason I'm only going with a half size position and I'd encourage a stop, I prefer a wider stop with fewer shares, but a tight stop above recent intraday highs can work as well, the main problem with tight stops is you usually have a good trade, retail tends to get stopped out once and forget it where prod who use tight stops will enter the trade several times until they get the position they want, having taken very small losses on tight stops allows them to do that. It's just my preference with a reversal candidate like this to use a wider stop and fewer shares to allow for that wider stop as reversals, tops, bottoms are all very volatile.

The charts for Z have looked interesting, it has been a matter of the short term timing charts not being where I needed them to be to consider it as a position, they are now getting there.

As you know there are VERY FEW "V" shaped reversals which this would have to be to work, the reversal process is something I take seriously, the only reason I consider even taking the partial short is because of the parabolic move in Z, they tend to have much narrower reversals areas and a more tight "U" or even "V" shape and as you know, most parabolic moves end just as badly on the downside as they were impressive on the upside.

Charts are coming right after this.

Broader Market Update

I was starting simply with an intraday market update, but some of the deterioration over the last 2-days, especially with the miss of Dow 17k , almost as if someone didn't want to encourage more speculative stock buying activity (someone who'd have the power to move the Dow down 1.3 point/s from 17k like the NY F_E_D's open market's desk) demanded that I put some of these trends in to perspective.

Many have asked about "Blow-off tops", it's hard to look at some of these charts and say that the move above SPX's 3 month range doesn't look a lot like a blow-off top, not only in 3C, but in price's ROC taken with everything else like forward earnings, manufacturing misses, global economic indicators hitting all time lows, etc.

*I've had to reduce the number of charts which paint a clear picture for the sake of time, there are too many assets that need to be monitored for a post this large during the trading day, but the point of me capturing and intending to post all of these is to show the deterioration and in context of the broader trends already in place, I'll try to retain as much of that as I can with fewer charts.


 SPY intraday deterioration since Yellen started her lecture. This is a trend in the averages.


 Here's the Flag in the SPY, more distorted because of Bullard's, "Market is wrong" comments pre-market on the 26th, the accumulation there is a stick save of the flag, as I often say, "When Wall St. starts a cycle or a price pattern for whatever reason, they rarely let it fail".

Deterioration on a 5 min chart is pretty extreme vs. previous divergences that have sent the market lower to the left (a weak relative negative on the 24th), also the deterioration is almost EXACTLY where the Dow failed , again as if the invisible hand of the NY F_E_D's trading desk took action to make sure Dow 17k wasn't hit.


 10 min chart shows the underlying trend more clearly with less noise, the  flag seems to have had one purpose and one purpose only, to use it to sell/short in to.

 Looking at a SPY 10 min to the left is the strong accumulation of late January/early February that created the February rally which turned in to a 3 month trend with the SPX having a range of about 3%, the breakout above that range which we expected and noted in early and mid May as it was such obvious resistance has seen nothing but large leading negative divegrences, if you are looking for a potential blow-off top, we may have just went through it. 3C is at new leading negative lows.

 30 min chart shows the same theme with the range in yellow.


 it's hard to see because of scaling, but intraday the DIA has deteriorated.

  DIA 2 min, Love these charts showing clear confirmation and no divergences as a price trend is confirmed, they are almost calibrated so the move in the DIA which would be a head fake move in almost every other average above the flag-like price pattern, shows ZERO confirmation which is what we look for in confirming a head fake move as they are used to trap bulls, distribute which includes short selling.

 10 min deterioration since the Dow missed 17k

 15 min chart shows a pattern oof distribution creating a resistance zone, I'm especially surprised this hasn't been head faked with 17k just above and obvious resistance, it makes a perfect head fake set up.

DIA 15 min trend

 QQQ which has had the closest thing to confirmation intraday is seeing rtrouble right as Yellen began her lecture at 11 a.m.

 2 min QQQ


 Much stronger 15 min also starting a negative turn, Yellen again seems to be the catalyst.

 QQQ 60 min overall trend with the Feb. rally and the QQQ and IWM being the 2 averages that retraced the entire rally on a negative divegrence just before the range developed, note the 60 min 3C chart as there's a breakout above the range, this is why shorter term charts/timing are very important against the backdrop of this longer term, higher probability divergence.

 IWM has actually seen some of the worst underlying behavior, that seems like an oxy-moron as it has seen some of the best price gains, but smart money needs demand to sell in to so if you look at it from a TA textbook point of view it doesn't make sense, if you look at it from a supply/demand balance it makes perfect sense.

 2 min IWM as confirmation

This closer view of the 2 min is where I see a potential IWM bounce intraday trying to get together, I'll keep an eye on it and see if it is tradable or if it's just a consolidation or is run over.


 And the 15 min since the flag and what I'd expect to be a head fake move above the flag-like price action, the longer term 4C charts don't have as much detail, but trends are much clearer.

 The 60 min view, just like all of the other averages since the break above the 3 month range, thus a potential blow-off top being used as such . You can't forget about numerous top patterns in popular stocks as this is taking place, the falling 10 year rate trend since the F_O_M_C, the spike in SKEW as OTM puts see their premiums rise as someone is buying them up in large supply, obviously they are worthless unless the market sees a crash.


The cumulative effect on my custom TICK indicator is continued deterioration, the actual TICK is still in a mild zone of +/-750, essentially the market components are almost evenly weighted when taking a cursory look, however above you can see there's clear deterioration cumulatively.