Well I do like it when 3C warns of something and that something comes to pass. Almost all of my positions from Friday are at a profit and as a whole the model portfolio is up 6.33% on the day. Of course I did do a little trading around today which helped.
3C was showing a strong 1 min positive divergence long before anything came out of Greece, when something did come out of Greece, price moved up as 3C had suggested it would on an intraday basis, this allowed me to re-enter shorts I had taken profits on earlier at a better price.
However, as I mentioned in this weekend's "Bigger Picture" there are a lot of volatile undercurrents that are developing from fundamental sources such as Greece and the Troika and mid week, the Fed. So it's important to observe what is happening and try to make some sense out of it. I would prefer to take profits a little quicker then usual because of these event culminating around the same time and it's difficult to say what the outome in Greece will be, even if the Fed outcome is already known and being traded in underlying trade.
The latest out of Greece s that they may hold a referendum vote as the political leadership s truly between a rock and a hard place. On one end the Troika is rghtly demanding that Greece meet fiscal guidelines set out for their next loan installment, which without, they are expected to default in October. On the other end, to meet the Troika's demands, many public sector jobs will be cut and demonstrations and strikes are already planned.
There is a bill already submtted to Parliment that will be discussed in coming days, the bottom lne, "Should Greece keep on the path laid out by the Troika or exit the EU and go it alone?". It is said that the bill will be discussed in the coming days, however, the announcement today from the conference call between the Troika and Greece is said to have made progress" and set for a second call tomorrow. These to paths seem at odds, how can Greece or the Troika commt to anything when Greece is considering a referendum that won't come about for several more days? It seems like political theatre, but who knows for sure? It could also be that the EU is trying to put off the decision until after the FOMC meeting ends on Wednesday, by then I intend to be out of all shorts.
Credit did not perform as well as the market and this has been a common theme, but credit is where the true professional analyst are.
Also interesting, Treasuries, the safe haven trade, didn't move on the afternoon rally. Remember, 3C was projecting that this would be an intraday move and nothing much more serious then that.
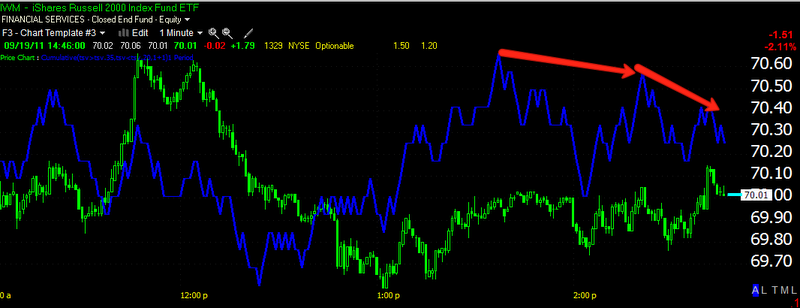
I'm being generous in drawing this trendline of the SPY, note how the afternoon rally breaks above the trendline.
Now TLT 20+ year Treasuries, which trade inversely to the market as a safe haven play, did not break below the trendline as you would expect.
IEF, the 7-10 years didn't either.
SHY, nor did the 1-3 year
IEI or the 3-7 year.
TLH, the 10-20 year didn't break the trendline. Treasuries held up, suggesting that those who bought in a flight to safety were not worried about the afternoon rally.
Even looking at an inverse ETF, TBF Short 20 year Treasuries didn't breakout with the market.
This makes me feel better about having added the shorts back in to strength.
The SPX $1200 area was clearly the impetus of the rally suggesting that Wall Street knew where the limit orders were and algos probably participated as well.
Just look at the volume jump as soon as $1200 or $120 on the SPY was breached. It looks like resistance from Friday afternoon turned the rally back.
What is truly difficult is watching for accumulation at the same time I'm watching for a drop in the markets, if you read the Bigger Picture, you'll understand what I mean. The two (the bigger picture accumulation and the intraday-day to day) can get rather confusing at this point. I'm expecting to see accumulation going in to the FOMC announcement as per my theory, but also expecting to see some more downside in the market. This is not a time to get greedy on your shorts, starting tomorrow, any big moves down and I'm going to be taking profits on them. I'd much rather be flat and in cash then caught off guard going in to the FOMC. Best case scenario is a clean long signal going in to the FOMC, the longer term charts have been suggesting that.
As I wrote about on Saturday, developments out of the EU are driving the market primarily right now, you can see that in this next chart.
In green is FXE-the Euro ETF and in red is the SPY, you can see they are moving together and that is
why I said to watch the Euro earlier today.
As for the Euro short term because our short trade is more likely then not, short term at this point, here's the hart for FXE.
3C s lower at the afternoon rally top then at 11 a.m. when prices were lower, suggesting the Euro and the market will see more downside pressure tomorrow. However, with currencies always caution tht a lot can happen overnight.
In confirmation of the Euro chart, here's the $USD which has an inverse relationship with the Euro and the market.
UUP 1 min suggest accumulation and a move higher in the dollar tomorrow, which is equity negative.
And the 5 min hart showing a positive divergence in the afternoon as well, so we have treasuries, the Euro and the Dollar all suggesting more market downside, but still we are on the watch for accumulation for a possible big move higher after the FOMC meeting. Note how UUP/$USD on both charts showed a negative divergence early in the day, this put downward pressure on the dollar and created an equity positive environment.
As for the averages, what is most important is the short term which is more or less dictating our short position and the 15 min chart, which I would expect to see go positive before or around the FOMC announcement.
***SPECIAL ALERT*** Before I bring you those charts, something is going on in Europe, I just saw this.
The Euro just plummeted 73 pips in 6 minutes. This is what the FXE/Euro 3C chart above was hinting at. As always, a lot happens in FX overnight, but it seems someone knew a little something before the close.
To put the move in context, in green was this afternoon's rally, so in 6 minutes, the Euro erased that entire move. This is stock/equity negative.
Back to the major averages, remember, short term and 15 min charts.
SPY
Here's the 1 min chart, below in the white boxes you can see accumulation areas, so it looks like this move up was planned well in advance. Toward the end of the day, 3C went negative at the rally highs.
SPY 2 min chart shows basically the same
The 15 min chart is the one we are on Fed Watch, if this goes positive quickly, we may be looking at a Fed announcement that will move the markets much higher. Right now it's still in a leading negative position.
DIA 2 min shows the same early and mid day accumulation and the distribution in to the rally. Some watching ES futures on a Bloomberg terminal said it also looked like distribution as the S&P broke 1200
DIA 5 min. we see several zones of accumulation before the rally, this was planned in advance and I feel lucky to have taken advantage of it. There's distribution into the afternoon rally.
The 15 min hart shows accumulation from the last cycle rally, it too is still in a leading negative divergence.
IWM 2 mins shows accumulation in white on an intraday basis and distribution in red.
The 5 min chart has the same basic conclusions.
We see several cycle bottoms/accumulation for short rallies and an over all pretty nasty leading negative divergence still, although we have signs of accumulation within the negative divergence.
QQQ 1 min shows the same as the others short term, accumulation in the a.m. and mid day and distribution of the rally.
QQQ 2 min shows the distribution a little more pronounced.
The Q's 15 min are still leading negative and I just wanted to show the rounding over of distribution on the 3C bar chart below and how it is normal to see that and still prices move lower. We are looking for a clear positive divergence to develop.
OK, I just got the news on what took out the Euro, the S&P just downgraded Italy from A+ to A outlook negative. That's a whopper. Futures took a big hit. So there's the dilemma and difficulty, sorting out 3C between what's going on in Europe and what is going on with the Fed, hopefully we'll get a clear picture within the next day or two, but as I mentioned, I'll be taking partial profits on my short position moving forward.
I'll let you know what else may uncover.


 | Theme by Thur
