Tuesday, June 12, 2012

AAPL Follow Up

AAPL has already run up as much as 12.7% from its 5/18 lows. My opinion on AAPL has been that all the accumulation for a move higher (lets not forget about AAPL's big picture which is very ugly) in the sub-intermediate term, has already been done and was complete at 5/18 so I haven't expected to see any more except maybe some intraday stuff here and there.

AAPL has a macro/micro set up that is ripe for a shakeout, both short and longer term.

 Here's what I mean by "any accumulation in AAPL is already done and was complete at the lows.

 The daily chart shows a price pattern that AAPL has not broken out of, this keeps the bears confident.
A breakout above that level will change some minds.

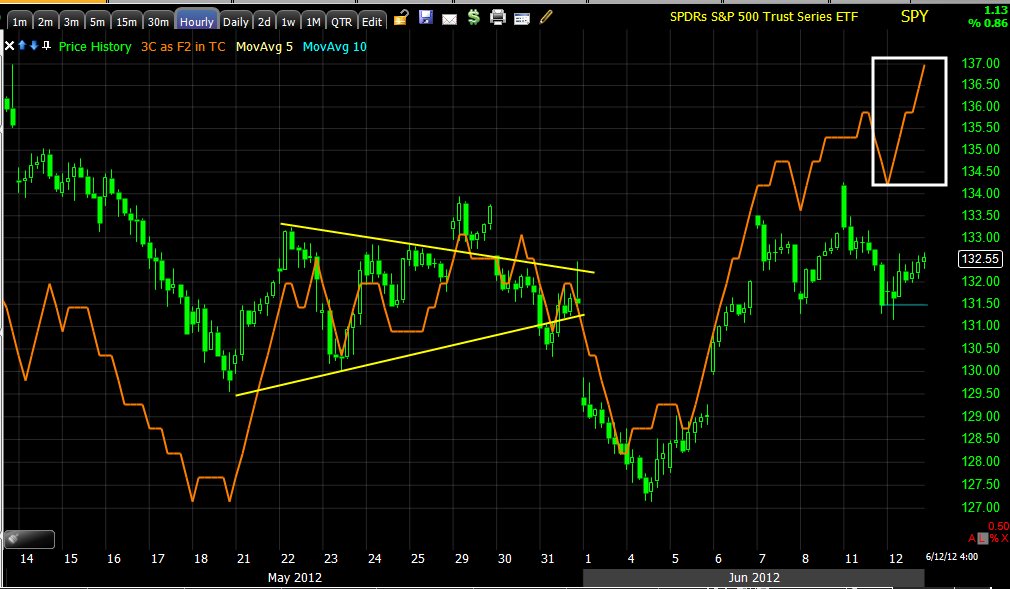
 Here's a 5 min chart with the breakout yesterday above that price pattern above on the daily that failed and promptly formed a bear flag/pennant, traders expect this pattern to break down so they'll short the pattern early-before confirmation of a break, so just imagine what an upside breakout from both this small pennant and the larger triangle would do for a short squeeze.

 AAPL 2 min incl. yesterday/s move and today's. This has the smell of manipulation by the invisible hand. Why distribute at those highs and then buy at the pennant, if AAPL was serious about moving lower on today's pattern, I'd expect a leading negative divergence, not a positive one.

 The 3 min chart looking at the same areas.

And the 5 min chart-it's not huge, but as I mentioned earlier, I don't expect any more accumulation in AAPL, the period was long enough and has already produced a gain, I'd only expect some middle man stocking up which is what we see often on the short timeframes.

In any case, AAPL is in good position to shakeout a bunch of shorts. I initiated an equity short on AAPL that I intend to hold for the long term, but I also have some speculative calls for a short squeeze move and as a hedge for the core short in AAPL. Three out of 4 of my AAPL calls are in the money, the only one that is not is June because I wasn't paying attention to it. The AAPL equity short is also in the green.

AAPL is one to watch

Take a look at AAPL, I already have long calls there, but it made a head fake failed breakout yesterday, formed a bear flag today and that bear flag is ripe for an upside shakeout move.

GOOG Update

As always, price is deceptive. GOOG is ugly, but I wouldn't write off a trade there just yet, in fact it looks to be in pretty decent position. Look at what GOOG has been up to while looking ugly.

 GOOG daily-for a speculative long a stop could be placed below today's lows.


 And sneaky, check out these chart- 1 min

 2 min

 3 min-all good confirmation

Even the 15 min, I'd consider taking this as a speculative swing trade and see if it gives more.

And This is why you have to pay attention during a dull market

That breakout happened as I was putting together the last post.

EOD Market Update

In the last post I mentioned quiet markets, I should have made some reference to them being sneaky markets. They lull you in to not paying attention and that's typically when underlying trade is moving the most.

Given the improvement in risk assets, what was seen in the Euro, this market update makes sense, but it almost seems as if even with 3C there's a bit of sneakiness going on, which would not be the case as smart money isn't trying to fake out a small private site with a proprietary indicator that isn't in circulation, but the way the positive divergences look, it may be that in an effort as to not alert anyone as to what's going on through the tape or order flow.

 The DIA sneaking up-large caps are always difficult as they are used for many purposes other than straight accumulation/distribution, such as adjusting an ETF. In any case, 3C is above Monday's open.


 DIA 5 min-the DIA is the weakest looking of the averages.

 IWM 2 min leading positive

 IWM 5 min leading positive and it makes Monday's opening negative look small.

 QQQ 1 min leading positive

 QQQ 3 min leading positive

 And the 5 min is back to the highs in 3C from Friday

 SPY 1 min sneaking up

 SPY 5 min leading

And interestingly the 60 min chart made a new high today.

Quiet Markets

Whenever we have a quiet market I'm, well nervous isn't the right word, but I'd say vigilante. Quiet markets more often than not lead to explosive moves and it's easy to be lulled in to complacency with a quiet market like we have seen this afternoon.

 SPX rather quiet this afternoon... Volume dropping off is where we typically see smart money making moves and especially in a quiet market.

I decided to check on the risk asset layout to see if there were any changes, whatever isn't shown here is moving along fine like High Yield Corp. Credit, but there are some changes worth noting.


 High Yield Credit is acting even better than it was this morning, it still has a ways to go to get back in line, but intraday I like what I'm seeing.

 Yields have been one of the biggest changes since our earlier risk asset update, they looked good this morning, now they are flying and yields tend to be like a magnet for stocks.

 Longer term view, Yields not only got back in line as I mentioned yesterday as needing to happen and soon, but they are now leading.

 While I wouldn't expect too much movement if the Euro was being accumulated, I did check the $AUD and it is showing a positive trend today.

Sectors are moving quietly, but shaping up. The safe-haven trades are gently fading, Basic Materials and Industrials are gaining, Tech in an under-performer, discretionary is quietly creeping up.


A WILD GUESS

If I had to take a guess at what we've been seeing intraday and based on some quick checks of charts, I'd say the Euro is getting ready to make another run at the major resistance zone that has separated bearish confirmation of price movement from a short squeeze.

This run may be getting ready to start soon, perhaps overnight, perhaps sooner. Of course a short squeeze in the Euro would drop the dollar and be bullish for the market.
The EUR/USD for reference, the blue trendline has been the downtrend since the May 1 top, the green line has been the uptrend since the June 4th bottom, the red trendline is the major resistance that I mentioned above.


FX trade since Sunday night's open at the green arrow.

 15 min Euro chart, at first glance it doesn't appear to be telling us anything new...

 A closer look at the intraday chart for today is telling us something as the 15 min is making a new leading high.

 Here's the 5 min that went positive earlier with the IWM/QQQ 5 min charts.

 Meanwhile the $USD isn't looking so hot on the same timeframe.

 The 30 min negative in the $USD and 30 min positive in the Euro have been obvious, but now we have a definitive 60 min negative on the $USD.

 The Euro for the first time is bleeding in to the 60 min chart with a leading positive divergence.


XME Request

XME is a metals/miners ETf that tries to mimic the  S&P Metals & Mining Select Industry Index so it is more diversified than GDX for example. 


In any case, despite the lower than I prefer volume, there seems to be something going on there, which may be worth investigating some other US miner stocks in particular. As I mentioned to the member, when I look for a trade, the first thing I look at is the market as it has the most gravitational or directional pull on any given stock, the actual stock is usually the last thing I look at. The earlier market update I was preparing before the IWM 5 min chart jumped before my eyes, was showing the funk the market has been in this week since the EU announced the Spanish Banking Bailout which backfired in their faces in typical EU problem solving fashion and sent Spanish sovereign debt to record high yileds. 


I'm getting a bit off track, but as mentioned Sunday night, "Watch the Spanish Yields". The EU is going to have to come up with some rumors, lies or something concrete to undo the damage they did to Spain this week. The reason I mention this is because we want high probability trades with low risk, the market so far this week has not given us that environment. Your portfolio capital is precious, I demand a high probability environment before risking money.


Back to the Metals and Miners, XME...


 Price alone seems to be indicating the character of XME is changing.

 The Trend Channel has a Buy to cover short stop at $41.30, a move above that level would also show a change in character in the stock. The Trend Channel is meant to sniff out changes in character of the 2 week behavior of a stock, typically when there's a change in that, there's a change in trend nearby.

As for 3C...

 The 1 min chart on its own doesn't seem to show much except the disaster open on Monday being sold in to. There's a small positive divergence today, but that wouldn't be enough to interest me.

 Step back and look at the 1 min trend and a different picture emerges, the current position is leading positive.

 The 5 min chart reduces some of the intraday noise and shows a clean divergence, also in leading positive position.

 The change in character on the 15 min chart is pretty clear, from a confirmed downtrend with a few negative divergences on bounces to a reversal to a leading positive divergence.

 The 30 min chart shows a pretty decent size positive divergence building here too from about May 18th or so.

Finally the 60 min chart shows the top and negative divergence, trend confirmation on the way down and a big change to a leading positive divergence, also around the same period.


In my view it's a matter of  tactical entry or looking at stocks within the sector. I doubt XME is a closely watched ETF, so I wouldn't say the typical head fake move that starts a reversal is high probability, but it would be a good timing signal if it occurred, the move would need to break below the $38.30 level. Further confirmation could be a break above the trend channel.


In any case, something definitely seems to be going on in XME and these are the strong signals I prefer. I also think some US metals/miners are worth a look.

The move in the Euro

The dollar didn't seem to have the same momentum move as the Euro-5 min

Very Fast Changes

I was just capturing charts for a market update, the main notable feature was how the market had posotive divergences last week and in to the end of week and how much things deteriorated since the Spanish Banking Bailout announcement, it' as clear as day. I was capturing my last chart and the IWM 5 min just jumped before my eyes.

I'm guessing this is Euro related as the Euro is moving and as I mentioned last night, the Spanish bailout announcement was a major screw-up as it took a bad situation and made it worse, meaning by subordinating Spanish debt /bond holders, the yields on Spanish bonds are going through the roof, meaning they'll be locked out of capital markets and need a real bailout, not just of the banking sector, but of the entire country-all that from one well intentioned announcement that was suppose to give the market confidence. Last night I also mentioned, "Watch for news from the EU as they try to undo this screw up".

I haven't seen news, but I suspect some will be coming shortly.

Here's what the market looks like now which is a bit different then when I was capturing charts for the market update. The QQQ/IWM virtually skipped right over the intraday timeframes to the 5 min.

 DIA 1 min responding, but it didn't see the same move as the QQQ/IWM

 DIA 2 min bleeding through as you'd expect.

 IWM 5 min just jumped leading positive

 The same with the QQQ

 SPY 5 min is moving as well, but again not to the same degree.

Take a look at how quickly the 15 min Euro/FXE chart changed.