Friday, November 23, 2012

Closing Indications

My guess is over the weekend or perhaps Sunday night/Monday morning we'll hear how sentiment has soured over Greek concerns or the fiscal cliff, that's my guess.

As far as the market close... A bit interesting.

 During US market hours and particularly from 12-1, the closing hour, the Euro made a nice move up, this of course is positive for the market, negative for the Dollar and after the US market closed it started moving flat.

 A longer view shows $1.30 coming up for the currency pair, I think it will break through, but not without a fight and that may be what sends the market on a pullback, an initial rejection of $1.30 next week.

 Here's 3C on the EUR/USD and note the negative divergence in place today and especially later today before the US markets closed.

 Here's ES with 3C.

 Here's a closer view, as soon as the US market closed at 13:00 (1 pm) ES dropped .

The same with the NASDAQ futures, as soon as 13:00 passed, it dropped from the high of the day which was right at the US market close-LOL!! Wow are they obvious.

Since then and it's only been 30 minutes, here's what the EUR/USD is going now...
If the market were open now, it would be dropping too, but now the market is closed, the final print for the week is in, the currency pair is free to move with the natural market forces.

I hope everyone has a FANTASTIC weekend, we should see lots of opportunities next week!

Financials (FAS/FAZ)

FAS is a 3 leveraged long Financial ETF and FAZ is a 3X short Financial ETF, to express a bullish position you buy FAS to express a bearish position you buy FAZ.

I opened FAZ calls which is expressing a VERY leveraged bearish view, but remember that ETFs are generally a good tool and used for short term moves and options, ESPECIALLY MY view of them are ULTRA SHORT in time holding them, usually little more than a day. So this position would be a shorter term one to hedge longs that I wouldn't want to take the time to move around selling and buying back, etc.

Nothing has changed since earlier in the week when the first pullback signals showed up, nothing has changed with the highest probability, largest trend signals still VERY bullish. Nothing has changed about wanting to use a pullback to establish leveraged longs like AAPL calls, etc like we did last Friday and closed Monday this week for a 100% to 115% 1 day gain.

Here are FAS and FAZ expressing the outlook of the trend, just like the market signals.


This is FAZ (3x Bear Financials) and this is the higher probability timeframe that shows us the same thing the market has been telling us, we are going to see a strong move higher that will probably last the rest of the year, maybe even longer. The negative divergence on the 15 min chart (the longer the timeframe the more important) tells us that Financials should do well over the coming weeks/month/s as this bearish ETF is seeing distribution in a timeframe that is known for pretty decent trends of weeks to months and considering the size and intensity of the divergence (leading negative at a new low), it is probably on the longer side of that estimate.

 Go out even longer to an even more important timeframe, 30 min chart which we have seen move stocks for 4-5 months and we have a very ugly leading negative divergence at a new low, the point is as FAZ was run up and Financials were run down, Institutional money was selling (distribution) in to the run up. There are two gaps in FAZ at the yellow areas, I'd guess that a short term pullback in the market as we are expecting will send FAZ in to one of those gaps.

 Even on a shorter 10 min timeframe, FAZ is leading negative and you can see not only where smart money bought in anticipation of Financials falling (white arrow), you can see how they sold those shares in to higher prices in FAZ and demand, by the top, they were out and long gone, probably long Financials at that point in FAS.

The point of showing you the 10 min chart is if this were to be a pullback in the market that I expected to last 2-3 weeks, this 10 min chart would be positive, not leading negative.

 Now on a very short term 2 min intraday chart we see some recent accumulation in FAZ in anticipation of a pullback in the market including Financials, today's new low allowed them to pick up shares on the cheap, but this isn't a big divergence and does not reflect a serious move although as it is happening it always feels serious, that's why we put these in to context so we have an idea of what to expect.

 At the FAZ 5 min chart this is the last timeframe that is positive over the last 2.5 days, so the December $17 calls opened today should take advantage of a short term move up in FAZ/short term move down in the market and financials, how short? We can't say, we just know the more serious probabilities are heavily in favor of the market trending higher over the next few weeks to month/s.

Now FAS, the 3X leverage Long Financial ETF... If we expect to see confirmation (which we've already seen the last couple of days this week in almost every asset class) we expect FAS to look the opposite of FAZ.

 On a 5 min chart FAS really isn't that negative, so it's not that strong of a move against Financials in the big picture.

 On the 3 min chart though (which is less important) the last 2.5 days have shown a negative divergence in FAS or distribution, again indicating the same thing we knew on Tuesday, that a pullback in the market including Financials was very likely.

Now if we look at a little more serious timeframe in FAS, a 10 min, we can see a leading positive divergence, so the short term tells us in the next several days FAS moves lower, but the big trend has been to accumulate FAS and over the bigger picture it and the market move up, this is why once the pullback reaches a certain area, I expect to see heavy accumulation of FAS, Financials and the market in general, that's an opportunity and that's when I want to add to or start new long positions.

Savy?


Partial post

Charts are coming, but just to get this out


FAS is a 3 leveraged long Financial ETF and FAZ is a 3X short Financial ETF, to express a bullish position you buy FAS to express a bearish position you buy FAZ.

I opened FAZ calls which is expressing a VERY leveraged bearish view, but remember that ETFs are generally a good tool and used for short term moves and options, ESPECIALLY MY view of them are ULTRA SHORT in time holding them, usually little more than a day. So this position would be a shorter term one to hedge longs that I wouldn't want to take the time to move around selling and buying back, etc.

Nothing has changed since earlier in the week when the first pullback signals showed up, nothing has changed with the highest probability, largest trend signals still VERY bullish. Nothing has changed about wanting to use a pullback to establish leveraged longs like AAPL calls, etc like we did last Friday and closed Monday this week for a 100% to 115% 1 day gain.

Market Update

It looks like some last minute lifting of the offers as the volume is absolutely minuscule, a very small investment to make to keep the market closing green today and on the week, should help morale with shopping over the weekend, at least more than some bad market news.

I had some questions about the options trades and whether that was a reflection of a change in my opinion, no it is not a change in my opinion, it's just trying to take advantage of what the market is offering very short term and to hedge leveraged long positions such as FAS that I want to keep in place so with a couple of options, AAPL puts (after just having made a decent gain on AAPL long shares) and a more leveraged Call (long) FAZ (which makes money if Financials go down), those two should be about close enough to hedge leveraged longs which I may very well consider adding to once a pullback takes place and shows strong accumulation in to it as it nears its end.

I'll post some charts of FAS (long Financials) and FAZ (Short Financials) next, here's the market update on this last minute stick save...

 The divergence in S&P Futurs is still very much negative intraday, the volume is very low right now so it doesn't take much to move the market.

SPY volume over the last several days vs right now, it is VERY low as you'd expect so it doesn't take much to move the market.

As for the TICK (1 min) today, it looked pretty good this morning at +1000 (even though earlier in the week we saw +1500 to +1800 readings -much better), then the TICK fell while the SPY was at the same price area and the TICK went negative, more stocks falling than climbing, the stick save in yellow is all over the place as their picking up offers and sending the market higher.

I'll show you financials next

Also Opening Some FAZ Dec $17 Calls

This is a bit aggressive, but I want to hedge any leveraged longs.


Market Update

First we expected a pullback, second right from the start of trade the gap up was not confirmed, third there were negative divergences on the intraday timeframe, the weekend is perfect to say Greek sentiment has shifted and take the market lower. Like I said, it could be a pullback only, but it could be uglier and even a new low to set a nice bear trap, either way it should be a nice opportunity.

Here are the intraday charts as they have continued to develop, notice they are all worse than earlier, but still intraday. The TICK is now in the negative.

 DIA 2 min

 IWM 2 min

 QQQ 2 min

SPY 1 min

Small AAPL Dec. $570 Put-Why not?

Or somewhere around there, but small/speculative

Closing AAPL position for now

The long in AAPL shares will be closed and re-opened at lower levels.

Not a bad quick gain.

Market Update Charts-Don't Miss

Amazing how on a day like today with virtually no one on Wall Street, a day I thought would be absolutely useless, we are getting some great signals.

As I said in the last post, there's distribution (selling) in to today's price strength mostly on the back of a weak dollar which sends risk assets higher. The distribution is in the intraday timeframes meaning it's small scale compared to the size of the cycle (but could still look nasty while it's happening) and that means it's along the lines of the pullback in the market I expect, see Wednesday's last post which made it very clear.

As I said before whether we see some intraday decline today or not doesn't really matter, it appears some last minute inventory shifts are being made in anticipation of the pullback that the market has been telegraphing-our opportunity. If I were a VERY aggressive trade, which I don't think we need to be right now, I might take some SPY (or IWM) Puts for early next week.

 DIA 2 min chart, looking at the intraday negative leading divergence today-distribution (remember this is not heavy distribution that effects the trend over weeks, months, just intraday and day to day-as in our pullback)
 DIA 3 min also showing distribution, I will say the Dow is one of the stronger looking averages as far as near term trade.

 IWM 1 min intraday leading negative today.

 IWM 2 min leading negative

 QQQ leading negative 2 min


 QQQ leading negative 3 min

 The SPY 1 min on an intraday basis was in confirmation until late Wednesday and then again today as it gets worse today .

 SPY 3 min leading negative.

All of the longer term charts where the heavier institutional action can be found are still looking great so this still looks like a constructive pullback at the start of the bull trend, it may get ugly, but I have no doubt it will be an opportunity.

Now check out the NYSE TICK chart (all advancing issues minus declining issues) for today. Remember how great this looked all this week?
 The SPY is there for comparison in red, note early on we were seeing pretty positive +1000 readings this morning, but at the same price level that has now dropped down to the +250 to +500 area, this is what wasn't happening early in the week as the TICK looked very strong. The bottom line, at the same relative price area more stocks are starting to decline vs the earlier move today, no sector rotation to support the market.

 The S&P Futures (ES) 1 min also going negative intraday

 Here are Treasuries, the flight to safety asset when the market declines, note the 2 min positive divergence.

 Also a 5 min positive divergence, some money is flowing in to the safety f treasuries as they know and have known all week that a pullback was part of the early trend. For us this is probably not worth trading as they are trading in 10k lots and most of us in 100 lots, they can make money on the volume/size of their positions, for us not so much.

In case you were wondering about the longer term trend, the one that shows the market is in a bullish phase and should move higher over the weeks and maybe months/s to come, Treasuries on a heavier distribution basis went up in November just to be sold hard in large distribution, that's how the market works, they buy weakness and sell strength.


Market Update

The averages and some other confirming assets are showing short term distribution, whether this is for an intraday move down today or they are just preparing for next week by adjusting their inventory, I'm not sure, but I am sure there's short term distribution.

I'll post the charts next.

GLD and EUR/USD-VERY INTERESTING- DON'T MISS

This week on Tuesday I started a position in GLD,  today GLD is up about 1% as the $USD has taken a MAJOR tumble of -.77%

You may recall in that post that we were seeing positive signals in to the trade Tuesday (more so than the general market in the short term charts) and even though GLD didn't react well on Tuesday to the F_E_D or Bernie's speech rather, as always, the initial knee jerk reaction to anything F_E_D is almost always wrong.

 Gold/GLD breaking out of that triangle I showed you in that post, today...

And the US Dollar breaking down hard today after a head fake move first at the yellow arrow above resistance, the EXACT SAME head fake move I showed you as it happened that showed distribution in to the move higher!

As for GLD specifically, it looks better than most of the stocks and averages VERY short term (as in the pullback) and why shouldn't it with the Dollar dropping like that. Remember last week I said the KEY, the FULCRUM to getting this cycle kicked off to the upside was the $USD dropping and that's a big drop today, also a big gap to leave open.

You saw earlier the EUR/USD and how much the Euro is up and how much the $USD is down, unless I missed something, the only significant FX news re: the Euro is that the Euro-Group summit was CALLED OFF! This would send the Euro and Dollar the EXACT OPPOSITE direction, there's only a few organizations that can make the EUR/USD move like that so once again on this Black Friday it seems the invisible hand of 33 Liberty Street in New York is at work in the markets and we have proof or at least a clue as to what's going on.

As for positioning, all of the longs started for this move are still open and will remain open through a pullback/consolidation/etc. The only thing a pullback opens up is an opportunity to start heavier leveraged options positions like AAPL calls and maybe adding to some already open positions.

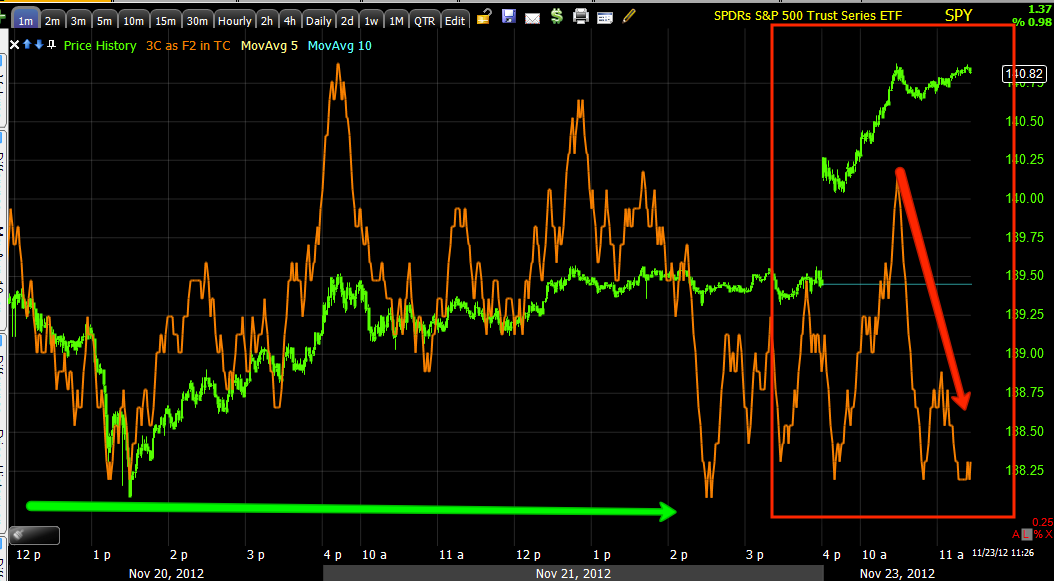
Here's what GLD looks like right now (which is better on average in the short term than most risk assets, longer term about the same)...

 Here's 1 15 min chart of GLD, note that the price of GLD was knocked down with distribution in September and as it hit the lows 3C shows a big round of accumulation and Gold is up from there, of course smart money isn't going to pay a premium for gold or any other risk asset, that's what the entire cycle is all about!

 Very short term the GLD 1 min chart looks like it's in confirmation if you looked at today only, but back out and it's not seeing confirmation very short term, likely there's some profit taking in to this move up as they likely know Gold will come down a bit next week, probably early in the week-more on that in a minute.

 The 2 min chart shows the improvement last week that made me like Gold and open a position there, but on this pop, it is not confirmed, 3C is not hitting a new high with GLD, so again we have a VERY short term negative divergence today.

 The 3 min chart shows why I opened a long in Gold/GLD last week, but again on the pop today, there appears to be confirmation, but...

 Back out a bit and you see there isn't. This isn't heavy distribution, it looks more like some quick profits being taken on a day that would otherwise be pretty quiet.

 The 5 min chart's trend as it is a stronger indication of underlying trade, looks much better, but even today we still have a small negative divergence in to the pop up. The trend should remain, but I'm betting gold pulls back next week otherwise why take profits in it today? Because they know they can buy it cheaper next week and it will move higher after that.

Now, the KEY to all of this, the Euro and $USD

 VERY short term, the $USD is seeing a positive divergence today, that confirms the negative short term divergence in gold as they trade exactly opposite each other!

 The 5 min chart in the $USD is in a leading positive position, it did not confirm the gap lower, again, this confirms what the signals are in GLD and suggests that pullback in the market I've been saying the last 2 days to expect.

Now the Euro which for confirmation should have the exact opposite signal as the $USD and the same as GLD.
 The 1 min chart is seeing a negative divergence RIGHT NOW

Although the trend in the 5 min vhart is very strong and I have NO DOUBT the Euro , Gold, Silver and the market go higher, in the very short term (over the next few days or so) there's a negative divergence in effect so expect the Euro to come down with gold, silver and the market and fill part or all of the gap, the $USD to move up and fill part or all of the gap.

And how? Over the weekend all they have to do is say sentiment on Greece changed and there's concern which sent the Euro lower and $USD higher-SIMPLE as that!

And I thought today would be boring!


Opening Indications

NOTHING has changed since Tuesday in my opinion of what comes next in this cycle, it can be demonstrated with 4 charts of the SPY/S&P-500, oh and by the way, I think I was right about the trade action on Wednesday which seemed very much like the invisible hand of the PPT was holding the market up just enough that it wouldn't close red and later that day after the close, I heard on the radio and TV as I thought and told you we would, that the market was performing great on the week, they went through all of the averages being up on Wednesday and I just kept thinking to myself, "It didn't matter if they closed up 1% or .10% as long as they weren't red and the whole 4 day winning streak could be drug out in front of Black Friday shopping. With light volume on Wednesday, even the offers of retail could have sent the market lower with the guardians at the Hamptons, 33 Liberty Street doesn't sleep and I'd say I'm 95% sure that green close was to prevent the news and radio from telling everyone on Wednesday the market was down -1% just before Black Friday or Thursday as it has now become as retailers know the Consumer situation isn't good.


As for the SPY charts (and other averages are pretty much the same)...

 Where it counts, on longer charts like the 10 min the positive divergence at the lows is clear and so is the overall bullish positioning of 3C right now, this represents the larger trend.

 The more important 15 min chart is leading positive, even more important for the trend and cycle up, but in the very near term on a shorter term basis...

 Charts like the 1 min intraday didn't confirm the gap up again today...

Nor did the 3 min or 5 min, all shorter timeframes of less consequence, but all suggesting a pullback before the next major leg up that holds in the trend, this is where we'll find some opportunities.

I SERIOUSLY doubt that we would see the pullback today with the pullback accumulated and ready to go for Monday so in my opinion, unless something big happens in underlying trade today, it really doesn't matter where we close, the charts are pretty clear that the near term trade will see a consolidation/pullback and the longer term charts say that it will be bought/accumulated for the next leg up, and that is where we'll find the next batch of opportunities, although the leveraged longs that were opened over the last few weeks as the cycle developed are all remaining open for this trend, it's just the more leveraged call positions like the AAPL and GOOG positions that made between +12% and +115% this week )and in 1 day) that this will effect.