Tuesday, May 28, 2013

Daily Wrap

Lots of interesting stuff today, I'll try to stick to the most important.

The things that stand out most to me would be Treasuries and yields and the deep divergences in Leading Indicators, they are at the point now in which I have ZERO doubt about the fate of the market and I have NEVER seen them this bad.

Overnight the Nikkei saw volatility as it's volatility has picked up in an insane way, about a month's worth of bullishly parabolic gains were taken out in 3 days, today it lost all of its gains and just popped at the EOD to close green, much like the SPX today. I believe Japanese JGB futures went limit down again on the open to halt trading. The BOJ is to meet with traders of JGBs to try to come up with a purchase schedule as the Yields are out of control which is what I said the day the BOJ unveiled their QE, "JGB Yields will determine whether the BOJ lost control or not", so far they have. There was some BOJ lip service that "easing will put downward pressure on yields", but where's the beef? Apparently the BOJ also engaged in "Price Keeping Operations " in the market today via the banks as proxies buying up ETFs. Speaking of the banks, with all of the JGBS (a market with a notional 4x larger than equities) on their balance sheet, they effectively have ticking time- you know whats.

It was my contention in the articles linked at the top right of the member's site, "Currency Crisis" that the BOJ did lose control and everything we have expected has played out thus far.

The incredible Yen/SPX correlation continues, I pointed this out back in April, but I didn't realize that it was building in intraday trade to, now to the point the SPX vs the Yen (green) looks like this.

 There's obviously an inverse relationship there and as I showed you last week, the Yen looks to have bottomed, as soon as it made a head fake move it shot higher, today it was under control no doubt due to the BOJ, but if this divergence in the Yen (positive) and correlation with the SPX keep up, well here's what the Yen positive 3C divergence looks like.

 Yen 4 hour 3C divergence close up showing last week's rounding bottom, the head fake move in yellow followed by the reversal as we often see after a head fake to run stops-also note the 3C positive divergence through the rounding bottom which we called perfectly.

Zoom out a bit and you have this...
 A huge 4 hour Yen positive divergence, if the Yen follows this (and you know I have thought it will since the BOJ announced their massive QE that doubles the monetary base in 2 years)  and the SPX correlation keeps up, the SPX goes the opposite direction.

The Yen 1 min intraday is in line right now, but this 5 min leading positive suggests that the Yen will explode higher within a day or so, perhaps tomorrow which won't be good for US equities.

The real asset to watch is the USD/JPY carry pair, the BOJ would like it to hold at $100, but if the Yen jumps as I suspect it will, it will sink well below 100 to the pleasure of China and the G20.

 Tis is the pair's 4 hour 3C chart, I never see divergences on pairs this far out, and it's obviously very negative making it look very difficult for the pair to hold $100 at which point I think the BOJ has to admit they lost control.

The 5 min chart also looks like the Yen, as if it will see downside in the next day or so, again not good for the market, here or there.

European markets were in a different mood, here's the European Top 100

What was it? Perhaps Hungary's Hungarian National Bank cut their main rate by 25 bp to 4.5% after having already cut it 100 bp this year. This makes the 5th Central Bank rate cut in May; Israel cut on Monday.

Speaking of which briefly, Russia is to send ground to air defense systems while Israel says it will target any such equipment coming in to the country and the US and France draw up plans for a no fly zone in Syria setting the stage for a Russian, Israel-US showdown as the Russians have the biggest naval fleet in  the Med they've ever had within the last few weeks.

The excitement in Europe couldn't have to do with the fact that Spain will miss all official budget deficit targets, this stuff, especially PIIGS and even core EU nations' sovereign Yields will be more and more important along with the Macro-data I warned of about 2 weeks ago.

Treasuries were the big news of the day and I think spooked traders, the normal correlations were no where to be seen and there were a lot of risk assets selling off hard, in fact all, equities, commodities, credit, bonds while the $USD and Precious metals were relatively bid.

What  sent 10 year yields to the biggest move since 2008 and the highest close this year? It "seems" to be the 10 a.m. Consumer Confidence number as seen below...
This is somewhat farcical as CC beat at 76.2, well over the high end of consensus at 74 and above the previous at 68.1.

At the same time we had the VERY farcical Richmond F_E_D (which accounts for a little more than 9% of U.S. GDP)...

The prior was -6, consensus at -3 and actual at a beat of -2, but what is comical and no one ever digs behind the algo scanning headlines, is that despite this beat, sub indexes such as New Orders fell to the lowest reading since January; Employees went negative; the Average work week fell to the lowest level since August 2012 and Wages are nearly the lowest in a year, but the F_E_D needs the yardstick to read "positive" so they can justify backing out of QE which is exactly what I said they'd do last year when they changed the yardstick from a solid, unambiguous Calendar date, to an easily manipulated "Economic data" such as above.

Even the algo scanning computers couldn't do much with this and for all those POMO people who think nothing changes, look at what happened to the market after today's POMO ended around 11 a.m.

After 11 a.m.,  the big POMO didn't seem to do anything for the market. There's no doubt POMO has been used for the last several years to create this equity bubble, but the F_E_D in their own words from the April F_O_M_C minutes openly admitted they created a monster and now fear the repercussions. This is partly why I think the PPT is not working to keep the market up, but rather to manage the destruction.

What equity bubble you ask? Besides the obvious of comparing the 2005 economy, employment and consumer spending as well as SPX levels to the same now, we also received notice from Morgan Stanley that the top 1500 U.S, companies have seen their net profit margins decline since June 2011, in fact, they have declined EVERY SINGLE QUARTER since then. If it weren't for Stock Buy-backs, the situation would be even worse so we have 2 year lows in net margins/corp. profits.

Take that with today's after market NYSE announcement that NYSE Margin Debt is at all time highs, meaning more investors than ever are leveraged, while at the same time investor net worth has dropped to the lowest reading on record!

But I digress as I have a tendency to stray a bit...

As I was saying, 10y Treasury Yields are up the most since Oct. 2011 and closed at April 2012 highs.
This now puts T. yields higher than the SPX's dividend Yield... Hmmm...

This is TLT vs the SPX (green-Remember all leading indicators are compared to the SPX in green unless otherwise noted).

In red we saw a negative divergence that seemed like they were intentionally sending TLT lower, this is positive for the SPX, you'll note at the same time HYG was being accumulated for the market run in yellow, HYG moving up is another lever that helps the SPX move up on short term manipulation (the 3 assets are TLT, HYG and VXX). Remember this time period when you see HYG Credit. However the plunge in yields is pretty amazing, do to Consumer Confidence? I don't think so, but that will most likely be the CNBC line although I don't listen so I don't know.


 TLT intraday today vs the SPX, there's some semblance of an inverse correlation as they normally move, but the SPX didn't tag new highs and TLT tagged new lows-even if just on an intraday basis.


Yields vs the SPX
 Yields are actually positive, remember Yields act as a magnet for the SPX so we could very well get our remaining bounce tomorrow with Yields up here vs the SPX.

Here would be a more appropriate comparison on a 15 min chart, Yields are begging the SPX to make that bounce, TLT is in line to help, even VIX futures as well as currencies, but beyond the immediate intraday trends, there's lots of trouble.

Take credit for example, we say, "Credit leads, stocks follow" because the credit markets are much better informed.
 When I said I had no doubt the market's fate was sealed, take a look at this "Leading Indicator's" divergence-this is what we look for in reversals, HYG (High Yield Corp.. Credit-the most liquid kind) is at an enormous negative divergence vs the SPX, we have seen decent 10% reversals on divergences 10%  this size.

 Intraday on a 2 min chart, HYG was accumulated at the white box, I showed you at the time, I predicted it would move higher to help the SPX (arbitrage) and that it would be sold in to every chance they get at higher prices, I also showed you that last week. Now go back and look at the same timeframe in TLT, it was used to send the SPX higher last week as was HYG, the selling in to any HYG strength is more than obvious even without 3C as it made a new low.

 Junk Credit that trades amazingly like HYG put in an end of day positive divergence, you can even see it in price. In fact both HYG and JNK put in positive divergences so I think they try to help tomorrow with a continued SPX bounce, but it's one I want to sell in to / short in to with new urgency as I see these Leading Indicators, including the $USD and Yen of course.

High Yield Credit...
 That's the kind of divergence vs the SPX that spells HUGE trouble, this is part of the new urgency to get out of longs and fill out short positions.

Today's market didn't have enough gusto beyond the open to move emotions, I suspect it tries again tomorrow, I want to use that to fill out all remaining short positions for the longer term.

 HY Credit intraday, even as the SPX bounced EOD, HY Credit sold off even harder-it's also less liquid so they need to get out and only so many can fit through the door at once.


This is an example of a 5 min positive divergence at the EOD today in HYG, I have 1, 2 and 3 min positives as well in both HYG and JNK so they should at least give it a shot, I'm ok with having added to HYG today, but I wish I had sold the position from Friday right on the open where the momentum is.

Other charts...
 This is a market Breadth chart showing the Percentage of all NYSE stocks trading above their 200 day moving average, note 81+% back in January, you'd think this breadth indicator would rise with a higher SPX, but in fact we have more stocks falling below their 200-day m.a. which is a basic way of determining a stock's trend, this would be bearish. The recent decline has been somewhat stunning considering the market, if this doesn't tell you smart money is moving out and handing the potato to retail, I don't know what will-these are real , hard numbers. There's no interpretation here.

 FCT as out sentiment indicator went "RISK OFF" very clearly today, but more importantly...

The Trend of this leading indicator vs the SPX, this is the negative divergence or dislocation we look for, I just have never seen one this big and that attests to the extreme nature of the market I have been talking about which I think will have a bad outcome.

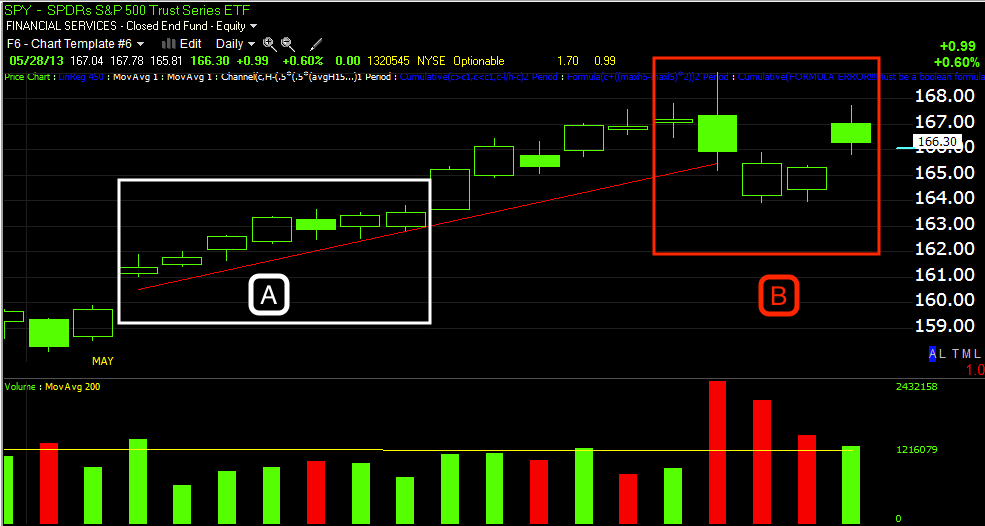
The market has been extreme to the upside, but the market always acts like a pendulum, it swings way too far one way and then way too far the other, I think it has been very extreme on the upside and the pendulum is just about at a dead stall before head ing the other way.

 The $USD didn't have much of a correlation with the SPX or commods today, but look above at how tight the Yen's is.

 The VIX as I pointed out a week or so ago has seen a Bollinger Band Squeeze which means a highly directional move is coming, the last two broke to the upside, this one is tighter and already started an upside break-remember the VIX and market move opposite each other.

 VXX, VIX short term futures is remarkably in the pocket of the normal correlation with the SPX intraday, however...

 The VXX and VIX's failure to make new lows as the SPX made new highs shows traders have been bidding up protection, this is some of the first true demand without manipulation I've seen in years. It wasn't that long ago that the VIX was making 7 year new lows as the SPX moved higher, now both have solid support from real demand for protection.


Sector rotation today looks like a risk on day except the Healthcare sector. I suspect this will look different soon.

So as mentioned before the close we go in to tomorrow with positive divergences in place, I'll be looking to unload longs/ calls in to price strength and set up shorts and fill out existing partial positions.

Strangely the ES CONTEXT model looks very bullish for a day up tomorrow, take a look-OI think this is so skewed because of treasuries decline.


We have almost a 20 ES point positive Es model, again I think its skewed by the decline in treasuries, but this should help get our move in the market tomorrow.

As for futures right now, I showed you and told you about the Yen, USD and USD/JPY which are the main players, short term they are on board for a bounce tomorrow, after that they get REAL UGLY.

ES and TF (SPX and Russell 2000 futures) both have a small 5 min positive divergence, NASDAQ 100 futures are in line on the 5 min charts. The intraday / overnight charts show ES and NQ with large positive divergences, here's SPX futures, but NQ looks the same.

Es 1 min 3C chart.

Of course the 4 hour ES trend/3c makes clear what's been going on during this "extreme market", there's always a reason and as I always say, "Price is deceptive" and for those who say "Price is all that counts", well in a market like this you can easily see 3 months of gains taken out on an opening gap.

As the SPX was set up with TLT, HYG, Yen etc to make it's extreme move higher, look how smart money used higher prices... I trust the divergence is MORE THAN CLEAR.

If anything pops up while I'm awake I'll let you know, otherwise unless there's a stampede, we should be set for tomorrow, it will be analyzing the market and shifting positions quickly that will then become the challenge which is why I have been building positions in advantageous areas in advance.


WHY USO?

This is just as good a post for market concepts as it is for understanding the position.

First a USO Call position was closed this morning for something like a 17% gain, it's not anything I'd write home about, but if the same trade were taken just using USO long with no leverage it would have netted about 1.2%. Last week I said we'd be using more hit and run tactics for the simple reason of rising volatility. This doesn't just mean rising volatility in the form of a 1.5% gain from Friday's close to the SPY's intraday high or even the +.60% close today with a big gap up. It means the the increased ATR like the Dow's nearly 2% ATR last week, it means the SPY high to low in one day moving 3%, the increased volume, it means going from "A" to "B" below.

From very low ATR, low gain, but steady movement to very high ATR, no trend and very unpredictable "looking" movement-although I'd say we've done a darn good job in navigating this mess just judging by positions opened Thursday and Friday of last week and closed today.

This is why our tactics for short term trades are leveraged and "Hit and Run". Maybe we will see higher prices in USO tomorrow (I'm hoping), but holding the USO calls that were sold this morning would have meant that the gain of 17% today would likely be worth even less tomorrow even if USO was higher as options have a pricing model that takes volatility, time decay, premium, etc in to consideration, it's nothing like buying the stock and if it is higher, the gains are higher. It's better in this market to take the gain and reset the position if you feel its worthwhile.

This is why I opened USO calls last Thursday...
 I rolled the chart back to 4 p.m. last Thursday, note the leading positive divergence on the 23rd, this worked out well for us as it fired and this divergence alone may have some more gas in the tank as it was at least a 5 min divergence (5 min being typically the fastest timeframe I believe we see institutional activity on with some caveats).

However, I'm about as bearish on USO as any other asset out there, at least for the next several weeks to months. So why take a long position on an asset I'm bearish? Because there was a good trading signal in place, USO was going to move, nothing drops or rises in a straight line, there are jiggles and we just so happen to find a signal for a nice jiggle. However, as mentioned before, this trade would not have been worth putting money , at risk, in the market (as your money is always at risk when its in the market) without a higher profit potential.

I have very high standards for options trades, they not only have to have solid signals, they need to give a set up that gives us as much advantage as possible. The difference between that and say an equity long, the Equity long still has to give the same excellent signal, but it doesn't need the same momentum criteria for getting a lower premium on the entry as USO stock costs whatever the ask is, USO options (all options) change according to time and volatility.

the Bearish Case for USO...  Honestly, the trade I really want is a USO short equity position, short equity rather than buying puts because I want to be able to ride the trend without trading in and out multiple times a day. There are advantages an equity short has that say a Bear oil ETF  doesn't (and vice-versa).

I want to set up a nice core position, full size (about 3x larger than most speculative positions).

 An hourly chart is a STRONG signal, this can easily foretell primary trends so it's no joke.

The signals here show a worsening USO position as the recent highs since mid-May have seen a deep leading negative divergence, in fact 3C is at a new low on the chart and it is lower than any reading as far back as I can see which is the entire year of 2013, that's bad.

I show the divergences with arrows or boxes for leading divergences, the small boxes are where the actual accumulation and distribution occurred. That's a pretty persuasive case on its own.

 The 30 min chart shows the same things, but with more detail, the same leading negative divergence, the same areas smart money has accumulated the lows to send USO higher so they can sell or short in to price strength. You'll see a better example of this in a minute.

 However, short term charts like this 3 min above show a pretty decent accumulation area from last week, I think it has more gas in the tank, even though the trend today was to sell USO in to price strength.

This 1 min intraday chart of USO shows how smart money buys at the lows and distributes at the highs, the first divergence on the opening was a deep leading negative that was sure to stop USO right then and there and send it lower where it was accumulated at "B", it moved up from the demand and was sent back down at "C" with distribution and so on and so forth. Often this is a way to accumulate a position at a stable price and at the best prices intraday, by keeping it in a range. Toward the end of the day they weren't selling to get out of USO in front of tomorrow, but in fact buying with more strength than the rest of the day, they're in a hurry at the end of day to buy, but understand this is a 1 min chart, the buying is exceptionally weak, it's enough to move USO in the a.m. or for several hours, but it's in no way a change of character to a more bullish stance, this is all about positioning not the position.

If the divergence is strong enough it migrates to the next longest timeframe which is 2 mins., here there's 1 early positive that doesn't show up here, it wasn't strong enough to register here, but the other 3 do and again the end of day (EOD) is seeing the strongest divergence of the day.

No matter what happens to crude futures overnight, this small accumulated position is in place and that's why these divergences, even ones like Friday's that we held over a 3-day weekend, hold up.

The ending trade in USO is what got me off the fence and why it was late day.

Taking on some USO June $33 Calls

Working Theisis

My assumption is the market is going to build a bigger divergence, this is still not very big or strong, but it needs to move emotions, today didn't do that.

I'd say look for the SPY to pullback to $165.8- or so and accumulation to pick up on the second leg of a small "W". We'll set some new positions there.

TLT

Thought I'd mention that TLT took out 3/8 support, that's a head fake move. I'm not ready to go long TLT and if I did it would have to be with major leverage, I did do a TBT Put, but that had very little volume.

I'll be watching the short term charts because the long term are very bullish, this could make for a nice longer term options/call play.

Adding a Little to HYG Call

This is probably a decent spec position here as a new one, but make sure it's spec.

Market Getting Help From HYG Positive

It also just saw some huge intervention in the way of volume, it may have been stops, I'll have to look closer, but I doubt it.

TLT is still moving lower (good for the market) and as mentioned, the intraday negative in VXX has turned it lower (also good for the market).

No wonder ES futures look like that, I'd be ready for a closing ramp.

Index Futures

As mentioned before, an Index futures divergence right now won't mean squat in the morning, it will mean something to futures traders probably over the next few hours, but not like an equity divergence, those mean something the next day, however I wanted to point out how strong this ES (SPX E-mini futures) intraday 1 min positive is.

Perhaps for the closing ramp? Perhaps a reflection of what's going on in the regular market for tomorrow a.m. at least.


Example of a Longer Term-Big Picture Perspective

I'm talking a lot about the near term, that's because we entered so many short term calls and have done great on all of them so far, a couple are still waiting to fire and this "bounce" should do that.

However the bigger picture is really using any market price strength to set up short positions or take TECS for example, a 3x leveraged Short Technology ETF that I have as an open long which is still at a profit, but this is an example of the bigger picture or the strategic view and how we can use short term market strength in price any way as a tactical advantage to setting up the strategic trade.

These 3x leveraged ETFs tend to move in this situation, last, in a reversal, first because of their leverage, smart money and ourselves) want to be in them as close as possible to the take off.

This is a 15 min chart which is a very significant timeframe for institutional money flows and TECS has seen very strong leading positive divergences, that's the strategic view.


The 5 min chart is institutional, the earliest timeframe in fact and its ready to go so its just intraday charts, but in terms of the big picture, looking at the 15 min chart, yes I want to get the best entry possible, but the big picture is that anywhere in this area is fine, it's just easier with leveraged positions to be as close as possible so you don't have 3x leveraged normal intraday drawdown effecting you emotionally when it's not a real problem.

Market Update

AAPL itself has a positive divergence reaching out to 5 min, I wouldn't have added there if it didn't stand out.

I'm seeing a lot of positives in Bellwethers, AMZN, GOOG, AAPL, etc as well as Financials, Energy and even Tech to some degree.

Just like last Friday's positives lasted through the weekend, something that works with equities, but not so well with futures as they trade around the clock, I'm guessing these positives will either create a move that will last through tomorrow (unless there's so much upside momentum in the next 30 mins that it uses up all of the weak positives and goes massively negative intraday which I doubt.)

These divergences could also be the start of a bigger one, by that I mean like a small 2-day "W" bottom, but since there's not much migration to longer timeframes, I kind of doubt that.

In any case, if there are some assets that I think are high probability, I may enter/list some. I urge you to really consider these as speculative longs, it really is razor thin between the road and the cliff.


Quick Market Update

The Yen's intraday negative divergence took hold a bit, the $USD is still struggling to hang on and so is the yen to some extent, but the correlation remains incredibly intact.

Yen (green) vs the SPX intraday.

Credit, which is one of the best leading indicators is getting slaughtered today, however HYG does have a positive divergence in place that should be enough to help an afternoon ramp or perhaps it continues to build for a bit longer or even do both with a pullback after a ramp.

VXX has a decent intraday negative divegrence-again a lever that helps the market move up when it moves down, but this is intraday only. I continue to hold VXX / UVXY long positions open.

TLT has been in line with its move down intraday which helps the market as a lever, but beyond that it is being accumulated as a flight to safety trade.

As for the averages, these are REALLY weak intraday divergences, so again the margin is razor thin.

I even had to look at some of the leveraged versions of the averages as they often move first in a situation like this (move first in 3C accumulation), the reason is the same reason we use leverage for these short choppy moves, it's not worth putting money in the market for such a small return without leverage. That's a good tip for 3C users, but think about the situation we are in, nothing is a blanket statement.

IWM
 As you can see, even on the fastest, least important 1 min intraday chart the IWM STILL has the weakest positive divergence possible, a relative one.


 I have been watching the 3X leveraged IWM longs, like URTY above to see what's really going on, accumulation nearly all day, but only in the 1 min tiumeframe. This almost suggests a move a little longer than just today, but that depends on how much volatility is in the move.

 QQQ 1 min intraday, again VERY weak, that's how much trouble this market is in.

 Again I went to the leveraged long versions like WLD and TQQQ above to see what was going on, an intraday positive almost all day, but nothing beyond 1 min intraday.

The SPY has shown the best divergence on its own, the 1 min leading positive.

This should tell you, I'd be taking long profits ASAP and not trying to get fancy and overtrade this market.

I'd also wait for any decent price strength to add to shorts and if we get enough, then maybe buy some puts.

The short side positions are the ones that I really want to concentrate on filling out, but if there's a ride to the upside with some money, I'll take it, but not much beyond this-it's too risky.


URTY Long

This may turn in to a day trade, so if you look at it make sure you are Reg. T Compliant.

URTY is the Russell 2000 Ultra pro 3x leveraged long, if you don't  want to use IWM options, you  can buy this. Again, this is a short term trade only, whatever the R2K gains, this gains 3x, but you have to be nimble because the bigger trade really is to be short the IWM/R2K in to price strength and you have seen how razor-thin the ling between the two are. This is why this is speculative.

I have some URTY long, it's at a profit and will look to sell in to some strength.

Dollar / Yen

The $USD looks on the brink of that pullback we talked about just 45 mins or so ago and the Yen looks as if it will come down as well, it will be interesting what the USD/JPY does.

Point being, assets like the XOM short we just entered/add-to are looking like they will give a SCSO (Second Chance Short Opportunity), of course with a lower $USD, higher oil- another SCSO and with both a lower $USD and Yen, that helps the market so there are a lot of SCSO's there, usually the Yen and $USD don't move together like this, but in this case it's one of the best levers that can be pulled on the currency side of manipulation.

SPY Update

Another look at how razor thin the line is...

 SPY 1 min intraday positive divergence suggesting we get an intraday move to the upside as we have been expecting. The negative in the a.m. shows what started the pullback so SPY could be bought at cheaper prices for this move up.

 At 2 min there's no confirmation in 3C so the move is VERY weak, the 2 min chart though, which shows the set up of this move last week (the reason we entered so many calls Friday) shows a divergence (positive from last week) that looks a bit bigger than just a 1-day move, but I suppose they have to as sellers are going to overwhelm the market on any price gains.

At the 5 min, the failed breakout, the breakout that led to the head fake high and this current move today with ZERO 3C support-pure distribution from the big boys.

That's how razor close this is so don't fool around or get greedy.