“It never was my thinking that made the big money for me. It always was my sitting. Got that? My sitting tight! It is no trick at all to be right on the market. You always find lots of early bulls in bull markets and early bears in bear markets. I've known many men who were right at exactly the right time, and began buying or selling stocks when prices were at the very level which should show the greatest profit. And their experience invariably matched mine - that is, they made no real money out of it. Men who can both be right and sit tight are uncommon.” – Legendary speculator Jesse Livermore, “Reminiscences of a Stock Operator” by Edwin Lefevre, 1923
Livermore is talking about the importance of both patience and courage of conviction for the professional speculator. He claims it was never his thinking that made him money, but sitting tight when he was right.
Think about that for a second, one of the greatest speculators of all time emphatically believed that being right on the markets was relatively easy, but sitting tight was the great challenge.
If you haven't put all my posts together in to a coherent understanding of my opinion of market action recently, let me sum it up as I believe the readings in 3C and MoneyStream as well as the market price action clearly show we are in the last stages of a bear market rally. You don't have to agree with me, but it is wise to understand at least what a bear market rally is.
When the history of this market is written in 10 or 20 years, I also believe that the F_E_D's unprecedented intervention and manipulation of the market through QE1/QE2/POMO, etc, will also reveal a new and extreme type of bear market rally, what it will be called, how it will fit in to the doctrine of Technical Analysis and market history remains to be seen, but the 2009-2011 rally, I believe will be considered a new type of bear market rally when the market finally unfolds and we have several more years under our belts to see the extremes the market will almost certainly experience. Many of my long term members know that I think there's a good chance that we as investors, our generation, will see the first secular bear market in equities and understanding how to adjust to that will either make fortunes or lose them.
In studying many, many bear market rallies, there are 4 traits that keep popping up over and over. You may not recognize them at first because each market, bull and bear is different, different timeframes, different intensities, different fundamental drivers, etc, but human emotion is what ultimately moves markets, even the machines are programmed and by-passed by humans. I said what I said about the 2007-to present market as looking like a huge bear market rally because it has these same 4 traits that keep popping up over and over in each bear market rally I have studied, although each trait is distinctive, the concept of the 4 is the same.
First it's important to understand what a bear market rally looks like, what it actually is because during a bear market rally, very few traders will recognize one, that is why they are so insidious.
In bear market rallies, the fear caused by the preceding sharp fall is replaced by powerful, consuming greed. Wall Street, investors, and speculators, most of whom are biased in favor of rising markets, see a small bounce, they assume the bottom is in place, so they start buying stocks, and a mighty bear market rally ensues which quickly feeds on itself and grows larger.
Interestingly, the biggest daily rallies in market history in percentage and absolute point terms occur in the midst of raging bear markets! The best performing NASDAQ days in history did not happen before March 2000 while the bubble mania still lived, but during the two massive bear market rallies in the first half of 2001.
Bear market rallies are almost always extremely impressive and compelling!
When I was teaching Technical Analysis, my goal was to get students to see historical charts in an emotional light. At a quick glance of a historical stock chart, several months does not look like a long time. But when you are in the market, making profits on some longs or loosing on shorts, two months is plenty of time to be seduced by a bear market rally.


Here's the rally to the left in the S&P-500 during 2008, with the 2007 top to the left. Most interestingly is the very small move to the right, barely noticeable on the chart, however it was an 18% move in 7 days, almost the same as what we have seen since October to now, except in a mere 7 days! However the impressiveness of the move alone gave it away as a bear market rally.
During the 2007 top, which I had been talking about despite the CNBC pundits still screaming the DOW was headed to 20,000, I spent probably a hundred hours studying the bubbles and bear markets of history, including the Dutch Tulip Mania, the Great Railroad Mania and Crash of 1873, The South Seas Bubble of 1720/The French Mississippi Bubble of 1720, the Dot.com bubble and of course the Great Depression. Every one of these has one thing in common, the notion that, "It's different this time". We might call this era "The Great F_E_D Intervention", I think we will look back and see that it was a bubble, not supported by economic growth, innovation or any other fundamental driver of growth, but by the F_E_D's relentless manipulation of the market starting in 2008.
In studying bear market rallies resulting from the 1929 Market Crash, 1946, 1961, 1966, 1973/74, 2000 and 2007, I found that it is hard to quantify a bear market rally in terms of a normal or average percentage gain, from the bear market rallies I tracked during these bear markets, I found rallies from 7% to 48%, although I will say that the bear market rally's percentage gain seems to have a high correlation to either the length of the preceding bull market or the intensity of the preceding bull market, so in a sense, they are somewhat symmetrical. There also seems to be a connection to the market conditions, the worse they are, the stronger the bear market rally is as it needs to convince bulls that the waters are safe and that they are missing out. The average bear market move from what I have studied is around 17.33%, we are now at 19.63% off the October low, although the most dangerous looking area started on 11/28 and has gained 12.75%.
Some of the characteristics of bear market rallies:
One definite characteristic of secondary reactions is that the movement counter to the primary trend is always much faster than that which occurred during the preceding primary movement (the bull move).
The market should show a sharp decline from high to low going into the short-term bottom and a marked volume increase of well above the average on the day of the suspected bottom.

Then, the market begins to rally just as swiftly as it sold off in the coming days...
They'll throw nearly anything at you to convince you that the bear is dead, there are few rules.
The Dow 1929 Crash saw one of the most powerful bear market rallies, although there were a total of 6 during the bear market.

The Dow 1929 Crash saw one of the most powerful bear market rallies, although there were a total of 6 during the bear market.

This was a 48% bear market rally.
Since the market is an emotional animal, it may be useful to understand some of the emotions...

Since the market is an emotional animal, it may be useful to understand some of the emotions...

Remember that traders (partly due to human nature, partly due to Wall Street brainwashing over nearly a century) are typically inherently optimistic, this is partly why bear markets do so much damage, why they may fall in 15% of the time it took to build the bull market and why they almost always take back more then the bull market made. If fear and greed drive the market (and sometimes the same event causes both emotions at the same time), clearly fear is the stronger of the 2 emotions, but hope is the most dangerous.
 Does this 1969 bear market rally look particularly dangerous (at the time, not with the benefit of knowing what came next)? It was stronger technically then the pullback of late 1967-1968, it made a higher high, technically, it would be classified as having broken the downtrend and in an uptrend. I doubt there was much fear over this being a possible bear market rally at the time.
Here are the 4 market stages I describe, 1) accumulation, 2) mark up, 3) top and 4) decline...
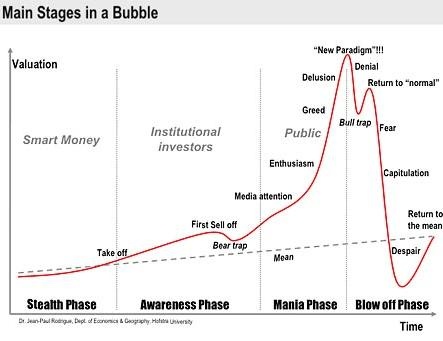 The stealth phase is the quiet accumulation I often mention, the awareness phase is what I call mark up, we are watching several long trades right now moving in to mark up, this is when volume soars and catches traders' interest, then the volatility associated with tops followed by stage 4 decline. These stages play out in primary market moves of several years, in position trades, swing trades, and even day trades. This is why I say the market is fractal and it is no coincidence, it is just a representation of how Wall Street works and how human emotion work, just in different timeframes.
 I've seen several bear markets now in my trading career, it was the 2000 tech bubble that I learned very quickly that I needed to overcome my irrational fear of selling the market short if I was to survive. I remember this bear market rally particularly well, it was later in the bear market, but caused a huge amount of disagreement as to whether the bottom had been put in. Bulls were adamant that the bottom had been put in, it hadn't though. Even in a well developed bear market, these rallies are still convincing and still cause traders a great deal of hope and often money.
Now I want to show you the 4 traits I have found in nearly every bear market rally, I tried to overlay charts from different markets and bear market rallies so you could see them, but my skills with graphic programs leave much to be desired.
 Try to ignore the part to the left and just look at the overlaid chart. The green is the SPX right now and the light blue is the NASDQ 100 at the top of the Dot.Com Bubble. As I mentioned, there are 4 components, and I don't think you will read about this in any book, I had never heard of them before I started studying the market. Remember each component is unique, just as each bull/bear market is unique, but they do share the same 4 stages I mentioned, these are the 4 traits of a bear market rally. Remember that each one is unique, but do you see them?
Here they are...

I removed the symbol and date on purpose so you can see the stages rather then the market. The first characteristic is a top and a sharp decline, the second is a low followed by a new low, I assume this is a shakeout mechanism and an accumulation phase for the rally which starts at characteristic 3 and then is followed by what is an even sharper rally at characteristic 4, I suspect (4) is sharper because at this point, people's greed takes over and they finally enter the market after feeling they missed the bottom of the market and first rally.
 Here the top saw a steep decline, a first bottom and then a second bottom which was relatively quicker to form then the above example, there was the initial rally at point 3 and then a very straight line, sharp rally with few pullbacks, much like the market recently, this was the end before the next leg down started, confirming this to be a bear market.

Here we see the right side of the top at point (1), it was actually larger, point 2 shows our low followed by a new low and 3 and 4 were almost imperceptible. Remember, as I said, each is unique.
 Again, our top, a first low and a new lower low, the first rally and then an even stronger rally with few pullbacks.
 This one is obvious, but is it a new type of super bear market rally. This is the S&P from the 2007 top at point 1, through the present.
The preceding 4 charts were:
The NASDAQ Dot.Com bubble

Here are the 4 market stages I describe, 1) accumulation, 2) mark up, 3) top and 4) decline...


Now I want to show you the 4 traits I have found in nearly every bear market rally, I tried to overlay charts from different markets and bear market rallies so you could see them, but my skills with graphic programs leave much to be desired.

Here they are...

I removed the symbol and date on purpose so you can see the stages rather then the market. The first characteristic is a top and a sharp decline, the second is a low followed by a new low, I assume this is a shakeout mechanism and an accumulation phase for the rally which starts at characteristic 3 and then is followed by what is an even sharper rally at characteristic 4, I suspect (4) is sharper because at this point, people's greed takes over and they finally enter the market after feeling they missed the bottom of the market and first rally.


Here we see the right side of the top at point (1), it was actually larger, point 2 shows our low followed by a new low and 3 and 4 were almost imperceptible. Remember, as I said, each is unique.


The preceding 4 charts were:
The NASDAQ Dot.Com bubble
The Dow Crash of 1929
The S&P at the 2007 top and 2008 bear marketThe Current SPX from 2011 to Friday last week
One other thing about bear market rallies is that they are often more powerful then the actual start of a true bull market, they are sharper in general.
In part 2 I'll cover in more detail why I have thought this was a bear market rally and why I think the 2007-2012 may be a new super bear market rally. I will present you with the evidence that I have gathered, not just opinions of what I see and how it looks similar to other bear market rallies. The truth is, the indicators made me first consider the possibility of this being a bear market rally long before I discovered these similarities.


