Wednesday, November 2, 2011

CITI's Technical Analysis Team Catches Up with WOWS

On Tuesday, October 25th in the wee hours on the morning, I posted "History Doesn't Repeat, But It Does Rhyme"

Today, Citi's Technical Analysis team puts together almost the exact same conclusions and the same time period that  used to illustrate what we are most likely looking at. While I may not agree with their target, I do agree with their analysis for the most part being I posted mine 2 days before the market top.

Here is Citi's take,

"The Bear Market Rally Is Behind Us; We Anticipate A Move To 1,000-1,015"

T's are pulling ahead


ES indications

ES seems to indicate that the SPY/market will lose this battle. This may be a good time to look at SPXU or any of the other inverse ETFs.

You don't see this often

Apparently due to Bernanke's remarks, both equities and the safe haven treasury trade (which moves the opposite direction of equities) both moved up, one will give sooner or later and probably sooner.
SPY vs Treasuries (red)

Correlation falls to .40

SPY/Euro

Kind of fishy

SPXU (long)

 SPXU 15 min

 SPXU 30 min

I really like SPXU and any where in that white zone I would love it.

On another note, listening to Bernie, I think he just blew his "tell", about every 5 words there's an "ah, uh, uhmm, uhhh, well um," and the harder the question, the more of the ticks you get per sentence.

Disconnect

This FOMC announcement was more positive then the last 2, very little language was changed, but what was changed, was more positive.

How does that fit with these downgrades to GDP and Unemployment expectations?

No wonder Credit is going down the drain.


FED OFFICIALS SEE 2011 GDP 1.6%-1.7% VS 2.7%-2.9%
FED OFFICIALS SEE 2012 GDP 2.5%-2.9% VS 3.3%-3.7%
FED OFFICIALS SEE LONGER-RUN GDP 2.4%-2.7% VS 2.5%-2.8%
FED OFFICIALS SEE 2011 UNEMPLOYMENT 9.0%-9.1% VS 8.6%-8.9%
FED OFFICIALS SEE 2012 JOBLESS ESTIMATE 8.5%-8.7% VS 7.8%-8.2%
FED OFFICIALS SEE 2013 JOBLESS ESTIMATE 7.8%-8.2% VS 7.0%-7.5%
FED OFFICIALS SEE LONGER-RUN JOBLESS 5.2%-6.0% VS 5.2%-5.6%


Resistance is back in play

That last bit of short term accumulation was stopped dead in its tracks at resistance, which looks like it is back in play.

This could be an important or one of the most important intraday technical events so long as it continues to hold.

You an see that last little bounce hit a brick wall exactly at the resistance/support level we have been watching this week.

If I was looking to initiate or add to positions, this would be an ideal spot for me as that resistance level should make for a good stop (above it, not at it!) and thus risk would be reduced and the probability of a successful trade goes up as well.

And the Long Term View

These are probably the charts that have kept many of us short and still others entering shorts as the media , the blogs and the general consensus was that we were entering a new bull market. The longer term the chart and the longer and deeper the divergence, the worse the reaction will be on the reversal.

 IWM 30 min is hitting new leading negative lows, far below the accumulation area that started the rally and this with the IWM still, even as of today up 18.5%. This would suggest that as the market went higher and perhaps higher then even smart money was prepared for, that they shorted more and more in to strength.

 QQQ 60 min also hitting new leading negative lows. As I have said, I haven't seen the averages look this bad in probably years on these charts.

 DIA 60 min has been a laggard since early on in the rally, it also made a huge leading negative divergence to the far left before the market crashed.

SPY 30 min is hitting new leading negative lows.

As of the European close, credit which almost always leads the market (except for this last rally for reasons I have explained due to EU bank repatriation of capital from selling $USD denominated assets on orders to recapitalize at the very worst time) took a nose dive in Europe and is doing so now in the US.

I don't think any bounce, if we even get that today, will last too long.

Market Update continued

Bernie will speak in about 25 minutes so this may be a "Hope" he says something important move, but it seems rather contained. I wanted to get the last update out fast, but I also wanted to include these 5 min charts-these are more important then the 1 min charts you saw and suggest that we may still get the upside move, perhaps even in to the close, as I mentioned yesterday, the Doji suggested it and just the normal function of even the worst bear market sees at least an equal amount of up days. Otherwise the move seems contained thus far.

All of these charts are "in line", there aren't any accumulation surprises.

 DIA


 ES

 IWM

 QQQ

SPY

Here comes the next wave, should be up

 IWM 1 min

 QQQ 1 min

SPY 1 min

 DIA 1 min

ES 1 min

USO Update

I don't recall whether I updated USO earlier or not?
 USO 1 min negative for most of the day thus far.

 The 2 min has a potential area for a bounce, however it may be just that 3C hasn't moved down yet.

 The 5 min chart seems to signal continued weakness


 And the 15 min above and 60 min below signal longer term weakness in USO. However....


Look at any news site out there and the talk is Israel hitting Iran, if so, all bets are off on crude as it will likely explode. I have never seen anything move oil faster and against all correlations then bad news concerning Israel. So if you are in the trade, pay attention to that news, maybe consider a hedge or just stay very nimble.

RIMM Update

The RIMM trade is an older trade that quite a few of you are still in, this was a trade that went perfectly according to plan, so here's the update.

 First we had a trading range in RIMM and in August as it broke below, it seemed like that range was broken, but as I will show you, as we identified at the time, it was a false break down or a head fake and many bought on that weakness. Our expectation was for RIMM to move above the trading range which it did and likely fill the gap, anything else was a bonus and then for RIMM to collapse. They had just introduced a new line of phones, but were and are loosing market share to AAPL and Android based phones. This is a trend we don't expect to reverse until they release their new OS.-so RIMM did exactly what it was supposed to do.

 The 1 min chart is in line with prices to the downside/trend confirmation

 as is the 5 min chart.

 Here's the 30 min showing the breakdown from the breakout of the trading range and further downside confirmation.

And the 60 min hart shows the range, the false breakdown in white below the range where many members bought and then the false upside breakout which nearly filled the gap and out upside expectations. The 60 min chart is also in line suggesting that RIMM has more downside to go in all timeframes. When they introduce their new OS, maybe they'll have a chance at a comeback.

First Reaction

Or mini reaction, the Bollinger Band Squeeze just blew open, but don't get lazy, stay focussed and nimble, these post announcement days tend to trade like an EKG reading
 A break of important support on an uptick in volume as stops are once again hit.

The BB's open up

FAD Bottom Line

Hands are tied, but there was a little cheerleading and the expected dissenting vote.

As usual, the mass of media expecting a huge action, was wrong.

"Household spending increased"- counter-point, US consumer saving's rate hitting multi year lows, it won't save Q4 GDP, but makes for a cheerleading point.

"Economic growth strengthened, but recent indicators point to weakness"- counter-point- see above.

"Inflation moderated" counter-point, year over year inflation is on target for 4% which is why Bennie's hands were tied

"Expect moderate growth"-counterpoint, that's sitting on the fence as much as one can do and still have a positive sounding statement.

"Unemployment will decline gradually"-counterpoint, that's very arbitrary and subjective, are we talking about gradually over a year or over a decade or century?

"See downward risks in global financial markets"-counterpoint, is this the best these scientists of the economy can offer? Everyone knows that, even my brother who doesn't know anything about the economy or care to.  However, as I stated pre-announcement, this is something they are going to want to observe to get a feel for where they will likely have to expend firepower, whether it's a BAC bailout or some kind of European aid in one of their bizarre schemes that saw European banks getting billions of dollars from the FAD in 2008/2009 to most people's surprise and dismay.

As for the knee jerk move, I don't think it has set in yet. The 10 min Bollinger Bands look like it will shortly. We have 2:15 volatility and then bak to Europe.

10 min BB's suggesting a directional move coming

Luckily I spent just about a much time on this FAD/FARCE statement as was deserved and not a minute more.

Knee Jerk Higher?


Isn't this interesting?

Sector Rotation

Here's the promised Sector rotation. There is a bit of a decline in Tech, that might explain the QQQ chart, however Industrials look pretty decent. Financials are still lagging, Utilities as a defensive play are still performing well, I guess it is surprising to see Industrials and Utilities both up, maybe a flight to the big gaps as a form of a flight to safety?

35 more minutes

I almost forgot that the announcement comes at 12:45-then at 2:15 (if I recall corretly, Bennie will have another press conference-that alone is interesting).

Unfortunately I'll have to tune in to CNBC :(

JPM just issued their thoughts on the meeting results:


"In recent weeks the doves on the FOMC have become more vocal. If the Committee takes no action today -- which is our expectation -- this raises the risk that we could see a dovish dissent, which would be the first since Rosengren did so in late 2007. The most likely candidate for such a move is Evans. Next in line would be Tarullo, though it is rarer for Governors to dissent than for Reserve Bank Presidents to do so. Raskin has also expressed some strong dovish views lately, though a dissent from her seems a long shot. Dudley and Yellen may be sympathetic to the motives for a dovish dissent, though their leadership position will almost surely prevent them from actually casting a dissent. All in, five of the ten voting members might at least sympathize with a dovish dissent; when you count the three hawks, that leaves only Bernanke and Duke in the center.

If the Chairman wanted to throw the doves a bone (block that metaphor!) one simple action would be to extend the mid-2013 rate guidance to late 2013 -- this wouldn't be much but at least it would convey a sense that the Committee is not content with the employment outlook. Another outcome that could prevent a dovish dissent would be if there was a sense that the communications sub-committee were making progress in moving the Fed rate guidance in a way that might eventually be more in line with Evans' trigger strategy. In any event, hawkish dissents from Fisher or Plosser are still the more likely outcome, but it wouldn't be a complete surprise to see a dovish dissent."

Market Update

On the heels of the last ES update in which a negative divergence formed suggesting a pullback, the major averages are showing the same.
 SPY 1 min  negative leading

The 5 min chart though looks comfortable here, this is likely due to what I mentioned last night, that Doji was a pretty good sign of a short term reversal and remember, there are more up days typically in a downtrend then down days as I pointed out yesterday so it's nothing unusual.

 The DIA 1 min looks really bad and suggest pullback very strongly.

 The 5 min chart is not in line, but lagging in a negative divergence.

 QQQ 1 min chart also looks like it wants a pullback

And the 2 min chart is somewhat in line, but the current reading is a bit low. I'll have to take a look at sector performance.


Quick GLD/SLV Glance

 SLV vs FXE/Euro

 There's some short term possible concerns of a SLV pullback, probably tied to the EUR.

 The 10 min chart shows some decent confirmation of the trend.

 As does the 15 min chart

However the 30 min chart asks the question, whether SLV really belongs at this level right now.


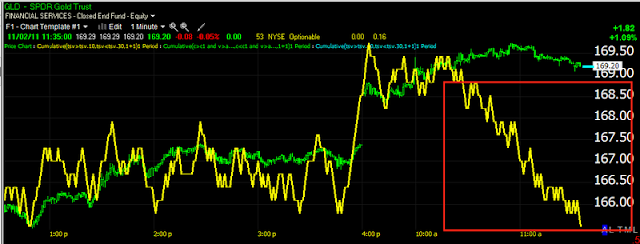
 SLV is outperforming GLD and there are some 1 min suggestions that GLD is ripe for a pullback

 The 5 min chart as well

 like SLV, the 10 min hart is in confirmation and looks almost exactly the same.

The difference is that GLD is showing the same question as SLV, is it ready to be at this level, except on a 15 min chart rather then a 30 min chart, again reflecting the relative strength in SLV right now.

A pullback would be interesting to see what materializes out of it.