Tuesday, April 26, 2011

COULD TLT BE TELEGRAPHING?

A recent article I read suggested Bill Gross is either coming out and blasting Bernanke's policies like never before or " is engaging in the most acute case of reverse psychology ever seen". In the past, interviews Gross has given a day before Fed policy statements have seemed to indicate that he was in the loop on Fed policy. So the question is valid and very interesting. It wouldn't be the first time a well respected manager ha misled the public for their own gain. On the other hand, his actions ( at last tally) seem to fit with his words.


I talked with a member about examples of inverse H&S bottoms and suggested looking at TLT, I found the chart to be interesting as well.


Take a look


 This look a lot like the classic H&S bottom or inverse H&S, from here upside volume would have to pick up.

 The daily 3C chart seems to like this as a significant base.


When the S&P-500 is overlaid (red), an inverse relationship becomes evident. So could TLT be telegraphing the Fed's next move?


One thing to be aware of is the initial knee jerk reaction to Fed policy statements. It hasn't been as pronounced as of late, but the Fed's policy directives haven't exactly been surprising lately either. Something feel different about tomorrow for many reasons I outlined already.  In any case, 12:30 we'll know what the policy directive to the NY Fed will be. At 2:15 Bernanke will hold the first post policy press conference ever for a Fed chairman, that alone is a big deal and suggests tomorrow's policy or comments to follow, will contain some element that will take us off the Fed's predictable path of late.

AMZN FOLLOW UP

I know congratulations are in order for at least a couple of you who took the AMZN short trade into earnings. I haven't read the entire release yet, but they missed on EPS and I suspect there's a margin related issue in there.

In any case, AMZN has been down over 6.5% in after hours thus far, maybe more, that's just a quote I caught.

FOMC Policy Announcement Tomorrow

I've got to say, I've been doing this for a long time and I don't often get nervous about much anymore, but I have to admit, there's some energy flowing through me regarding the FOMC announcement tomorrow. Almost as if we're about to witness something historic, in a way we will. Bernanke will be the first Fed chairman to give a Q&A to the press after a FOMC policy announcement. That in and of itself is strange, it comes with huge risks which Greenspan learned in 1987, then he developed his "Greenspeak" so no one would ever have a clue what he was saying again.

Bernanke is taking to the mic and taking this risk for a reason, he wants to beat someone else to the punch and I'd guess that would be the hawks, although I can't say for sure.

Bil Gross who at times has been apparently very close to the inner circle is very vocal and critical lately. Is it for real or theater? It doesn't seem like Bernanke has a lot of choices, but if he feels the need to be the first to the mic and get his message out, then it would seem something big and potentially controversial is coming. Remember, this was scheduled before the Fed started meeting today, and certainly before the vote.

I can't remember an FOMC meeting tht was stranger then this. The Chinese criticism and threats, the Primary Dealers taking a step back today in the 2 year auction, PIMCO's positioning, Bill Gross' comments, all the Fed speakers who have been talking everywhere the last month, it's all very strange.

My mind can spin this 200 ways in 5 minutes, but the bottom line is, we won't know until 2:15. I'll try to get you a live link up.

GOOG

GOOG looks like it's starting a cycle up, most probably to fill some of that big gap. It's still pretty early on so it may be worth a look for you.

 30 mn positive divergence

 15 min positive divergence and the start of a move up from what appears to be an accumulation cycle, so it's pretty early to catch it with some confirmation.

As you can see, there's quite a bit of room to fill the gap. With what appears to be about 4 days of positive divergences, it could be a decent little run and it's close enough to support that the risk isn't high and the price has started moving so the probabilities are pretty good.

Some Minor Market Moves

Here's the SPY and QQQ
 A small pos. divergence around 1:30 in the Q's on a 1 min chart.

And the same for the SPY on a 1 min chart. Nothing big, it could just be normal market jiggles or an attempt to keep the market higher or at least above the breakout level until the FOMC announcement. The one logical reasons for this is that the IWM hasn't made it to the "new breakout high" above local resistance. It also looks stronger today then all of the others, so my guess is that the IWM will try to follow in the footsteps of the other major averages.

 IWM daily chart, close, but not at the breakout high.

This is by far the strongest 1 min 3C chart of all the averages. Even the accumulation period seen in the SPY, QQQ is far stronger in the IWM and there's been no negative divergences like the others saw earlier.

$35B in Treasuries

Nothing too remarkable, except for the 2 ear note auction, Primary Dealers showed the lowest interest in 2 years which harkens back to a recent post on 4/24 ,


"When you can't sell U.S. debt and the market is flooded with additional sources of US debt for sale to the tune of $3 trillion dollars, what's the answer? One the Fed can't stop buying debt, so some sort of QE 3 in some form is looking more likely. Secondly to sell whatever is possible ( and the Fed can't buy it without the Primary Dealers buying it from the Treasury, which until now has been a risk free handout of billions of dollars to the PD's) even the Primary Dealers now are going to want a higher rate of interest as the holding period which has been a few weeks typically before the Fed monetizes it, is no longer a risk free assumption."


It's all falling into place very quickly now.

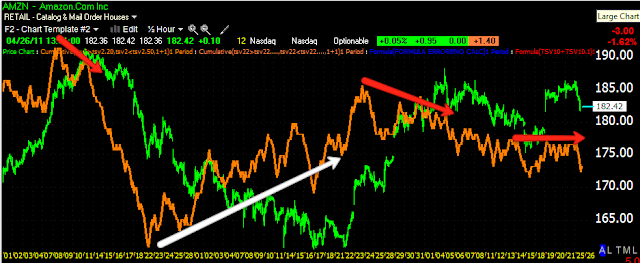
Chart Request for AMZN

AMZN reports after the bell.

 On the hourly chart there was an extended accumulation period, so it's not surprising AMZN has run for about a month. What bothers me about this chart is the extent of the accumulation, but there's no distribution signs here.

 Moving to a more specific 30 min chart, an accumulation zone can be seen and several points of distribution, again, not exactly commensurate in size of the accumulation zone.

 On the 15 min chart we are looking at the more recent run with accumulation and distribution into a largely lateral trend.

The 5 min just confirms what we are seeing above.

This isn't the typical earnings chart that I'd be excited to publish because of what I mentioned about the 60 min chart. However, I'll go ahead and give my opinion on the most likely outcome (which is not to say they'll beat or miss, that's irrelevant, it's how the stock reacts after that we are looking at). As I said, the lack of strong signs of distribution are a bit bothersome, however the trend up has been long enough that they could have fed out shares in small increments spread over a longer time period. Taking that into consideration and the fact we aren't seeing any heavy accumulation as of this moment (remember though how quickly GOOG changed, in the last hour of the day), my guess is AMZN will not have a good reaction to earnings in the coming days. If you are interested in trying to play this, definitely get in touch with me before the close so we can make sure there's no GOOG-like, last minute heavy action.

SPY Update

In yesterday's market update I had the following to say about the negative 1 min divergence around 2:30

"The acc/dist cycle is very much like the 4 market stages in a cycle, whether it be intraday, a swing pattern or a Primary trend. Those stages are 1) accumulation, 2) mark-up, 3) distribution, 4) decline. When watching 3C, as I showed in an earlier post on the SPY, we saw the accumulation, the mark up period when prices rise and 3C confirms the uptrend, distribution when we see the negative divergences, typically starts when the market is still rising and then a reversal. Distribution and accumulation occur most often in a laterally trending market as we can see the least two days. The recent trend before a reversal of a cycle has been a false breakout, whether it be a false breakout to the downside kicking off a move up as seen in the SPY chart I featured earlier, or a false breakout to the upside before a reversal. As I mentioned, the SPY is close enough to pull off a false breakout, whether it does or not, I can't say other then to watch the 1/5 min 3C charts. If the negative divergence worsens, but price fails to fall, then it's more likely we'll see that false breakout, what is happening is distribution which can also be interpreted as short selling. If the market prices fall in response to the negative divergences, the false upside breakout becomes less likely."


 You can see yesterday the market didn't have far to go at all to pull off a breakout.

As for what I said above, you can see 3C continued trending down in the afternoon , price remained lateral increasing the chances of a false breakout. Today's 3C action has been very negative in a leading negative divergence. I'd think it would be possible to keep the market above support until the FOMC meeting, "possible", is it likely? Common sense would tell me yes, but the readings on 3C don't seem to agree with common sense. I'm going to look at the market's breadth next.

AAPL Update

AAPL is similar to PCLN in many concepts, the price pattern is and trend are different, but for the short term situation, it shares many of the same characteristics.

 First are the false breakout of the consolidation triangles, which fall into the continuation pattern category so for most technicians, when these triangles broke to the upside, it was a buy signal. Now price is moving below and putting them at a loss, but once again this is the smaller picture.


The real damage would be done if AAPL breaks down back into this channel, the same margin calls would roll in, the same loss selling by longs would occur and most likely send AAPL to the bottom channel quickly. This trade could also be entered short right here with a stop above the recent highs, or on the confirmation of the bigger false break out when prices fall into the channel or as with PCLN, a blended strategy of the two.

PCLN Update

PCLN continues to act badly after yesterday's false breakout of the triangle and even on this morning's gap up. There have now been several posts on PCLN and specifically on false breakouts, so far we have a minor FB, we're looking for the more meaningful larger one.

 Here's yesterday's triangle that I suggested would see a false breakout to the upside, it did, that fell. The volume in the red boxes is the way HFTs make money by triggering multiple orders by crossing above and below support and resistance. I said those orders would dry up and a trend would emerge soon, right now the trend intraday is looking pretty bad.

On the daily chart in the first PCLN post, the one thing that bothered me was the lack of a conniving breakout from an obvious zone of resistance-much like what we are seeing in the market today, it did make that breakout. What we want to see is that breakout now fail below the red trendline. PCLN could be a very good trade below that trendline as it would be one of the first major breaks in a very popular stock in a long time. That means there's likely a lot of heavily margined longs and if they are at a loss below the trendline, margin calls will come in and PCLN could fall fast and hard. The price pattern (candlesticks) thus far today, show a confirmed reversal, but I wouldn't call it confirmed until that trendline is broken. It can be shorted here with a stop above yesterday's intraday highs or you can wait for the higher probability trade of the trendline breaks or blend the two strategies.

First Dallas, Today the Richmond Fed

If Dallas wasn't enough, Richmond comes in on a big slowdown in manufacturing. A few days ago I jokingly said there won't be any margins left soon, they say every joke has a little truth in it. The Richmond Fed confirms once again, prices going in are rising while prices going out are falling, that's a true margin squeeze and an EPS killer.

So the FOMC once again faces the Bernanke Chinese Finger Trap, raise rates to kill inflation and the consumer and small businesses? Or Leave them and kill small businesses and the consumer?

Commodities and Inflation

Day two and still acting strangely. Yesterday morning I mentioned this and although the dollar gave us an excuse, I said I didn't believe it was the dollar.

Today commodities are down again and so is the dollar so there is no dollar excuse today. Something is seemingly creating an inflation scare, as I mentioned yesterday, despite what analysts think about Bernanke's Q&A and the FOMC decision (essentially keep rates where they are now and say that inflation is transient) something doesn't feel right with commodity action and that in my opinion s largely centered on inflation and the FOMC meeting.

Market Update, No Surprises Here

As per yesterday's post , we didn't see the downward price pressure from the negative divergence. The lack of downward price pressure meant the lateral trend was most likely going to make a move to establish a new local high since we were so close, the entire explanation is in the linked post above. In any case, what we have today is exactly that.

Wall Street always seems to set up cycles like a world champion chess player, thinking weeks or more ahead. IF there were concern about the upcoming FOMC meeting, in the past you'd expect the market to move down to discount that concern, not anymore. Now it's more likely that the market will move up as it presents a way for Wall Street to short strength on concerns of an upcoming event. The coordination is uncanny, especially given the monkey wrench thrown in by the S&P ratings over a week ago that threw this cycle off track by several days, but it was made up in a day.

So it looks very much like we'll see the move I talked about yesterday, I have a feeling I know what the outcome will be, but it will be important to watch the market above the local highs, which it's above now.

Silver Pullback part 2

Yesterday in this post, I mentioned the likelihood of a pullback in SLV with a target.  


Later yesterday after the pullback post, we also found out that the CME lifted silver margins by 9% as well.

So far we have a pretty decent pullback, but I'm starting to think it may be a bit deeper and hit the blue moving average.

PCLN and AAPL

These are two stocks that we talked about yesterday that were breaking out to the upside out of consolidation triangles, I mentioned several times on AAPL and a late day post on PCLN to watch these to break below the apex of the triangle completing a Crazy Ivan, both have done so this morning, AAPL still has the larger triangle from Thursday to contend with, but it's taken out this morning's. As we saw with AAPL yesterday, it's profitable for market makers and HFTs to chop price above and below the Apex, triggering orders and stops, but at some point those orders will dry up and a clearer trend will emerge. Whenever a stock can't hold a breakout, it's never good news. Keep an eye on these two.