Thursday, May 31, 2012

FB Close

I really can't believe I have a long trade in FacePlant, but this is the market for you, extremes, things that don't make sense and more than anything in the near term... manipulation. 

Sunday night I went in to some detail about the disaster that was FB's first trading day/week. You may recall Morgan Stanley made $70 mm as an IPO fee, then I'm sure the 15% Greenshoe options. 


When we look at the considerably larger bid volume in blue vs the ask in red, I think it becomes pretty clear (while MS probably wouldn't be the only underwriter defending FB on the first day of trade) MS lost $$ on the deal. I see roughly 170 mn shares bid just at the 3 major support levels. I can't see any way MS came out of that first day of trade at a profit, all they did was save face for 1 day. However, when you can move the market, you always have a second chance.


Here's how I see it, as of Tuesday there was some apparent accumulation, in retrospect it wasn't very big. We know that Wall Street/MS would be buying in to weakness and trying to get the best / lowest price possible. If they can drive FB up on a decent move, they can probably make back some of the money they surely lost.

This first chart reminds me of the 4 stages of a market cycle: 1) Base/Accumulation 2)Breakout/Mark-up (3C confirmation) 3) Top/Distribution 4) Decline. Although it would seem accumulation started earlier than this "U" shaped bottom looking pattern, let's just assume this is stage 1, the Base/accumulation. This is usually done quietly, note volume on the decline falls off at the lowest area and we see that typical tell tale flat trade where accumulation happens so often. The next move would be to send FB from stage 1 base to Stage 2 "Mark Up", this is where the momentum traders and everyone else who is late to the party chases prices higher. Because Technical Traders are still laboring under the myth that large volume=Smart money buying, we often see large volume on the breakout from the base moving price to mark-up; this is not accumulation, smart money doesn't chase prices higher, but they do what they can between the order book and whatever they need to do to make sure there's a big volume spike that catches everyone's attention. "Oh look at FB, the volume is huge, smart money is buying!" That's the game.

 Here we have the breakout of the base, enter momentum traders, stock chasers, Greedy gamblers and the "Revenge Traders", these are the people who say, "I lost my money in FB, I'm going to make it back in FB". If you have ever held a position that went against you with the intension of selling it if it will just come back to where you bought it, you are doing the same thing, "I lost my money here, I'm going to get it back here", when in reality, that stock may not be the best place to make back the money lost, but that's just human psychology, not wanting to be wrong.

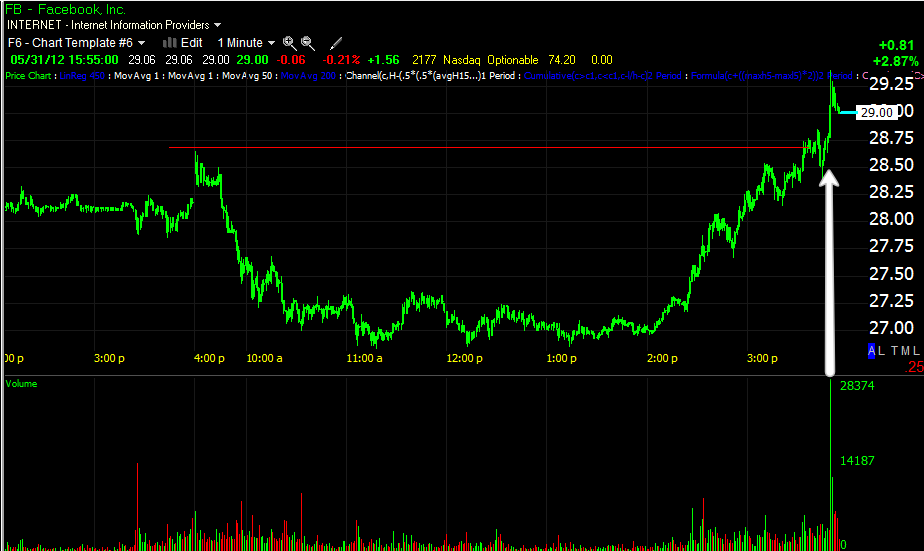
If there weren't the huge 3C divergences in place and if I had not already seen something going on in FB Tuesday, I'd be very suspicious of this move, but given the situation and 3C charts, I think it's a genuine move.

 This 1 min volume spike ( a teaser) is the largest 1 min volume since the morning of 5/22-almost 7 days and it's right where it should be, a technical breakout.

 I won't insult your intelligence or ruin these charts by drawing on them. FB 3 min

 FB 5 min

FB 30 min

Something seems to have drastically changed, maybe it was Zuckerberg falling off the biggest billionaire's list yesterday.

In any case, my calls are already up 36%. While this isn't the type of trade I would normally look for, I believe you take opportunities where you find them.


FB Cont.

I normally wouldn't chase something like FB, but in my opinion the stock needed to show us something in price as it is so new and we don't have much 3C data on it. That being said, maybe because it is so new, I haven't seen many positive divergences that were that strong.

It seems like accumulation was already in motion by the time I posted on May 29th (Tuesday), the additional accumulation in to lower prices looks very strong, maybe this is MS trying to make their money back?

In any case, I don't mind throwing 7.5% of portfolio money at it and see what happens on a divergence that amazingly strong.

FB with a little "Show me" action in price.

FB Follow up

On Tuesday May 29th I posted this, FB to Bounce?

 FB 1 min

 FB 2 min

 FB 3 min -pretty amazing

 5 min-also pretty amazing

 15 min

The scale is thrown off, but here's the 30 min, this should be good for a decent move up.

Opening a FB Long Spec Trade

June 27 Calls, you may remember a post earlier this week about a FB bounce, I'll follow up with charts

Credit Moving Again

Like I said earlier, I would have preferred to see a pullback and see how underlying trade responds, this consolidation in the EUR/USD held up or halted that process.

 The triangle consolidation in the currency pair.

 While I've been looking everywhere for some definitive signals, I came back to credit and although it's an intraday move, I don't like it. Earlier as I mentioned as the market bottomed out, High Yield Corp. Credit held at support from the 25th and didn't make that lower low with the SPX, which was a good sign, at least for confirming timing.

 As the EUR/USD has consolidated in a triangle, the SPX's intraday negative divergence that was leading to a pullback got caught up in the currency pair's price action and has formed a similar triangle at the yellow arrow, while HYC Credit has moved down.

High Yield was the other risk-on Credit I mentioned that rallied as the market slid in to the intraday lows, now as the SPX consolidates laterally, HY Credit is also slipping, when there aren't many definitive signals in the market (today is very slow for signals), this isn't what I'd like to see.

$USD is the tell?

Today is one of those days when you have to look everywhere to get an edge. The intermediate term direction is already strong on the charts, it now becomes a matter of timing and with head fakes going on, it would seem the timing is right upon us; I would like to see strong signals confirming that (but everything comes on Wall Street's schedule). Any way, I've been paying a lot of attention to the Euro, but the Euro is just a side effect, the real currency that moves the market is the $USD, the Euro is just easier to use. Luckily the $USD is showing some decent signals.


 $USD 1 min

 $USD 2 min-3C momentum is really picking up.

 $USD 3 min, not only is momentum in 3C picking up, but the migration from short to longer charts looks good.

 The 5 min

And what I called above, "The Intermediate term direction" and the strength of that signal.

The Hold Up With AAPL

As you know, I've been looking for an area to add some AAPL July Calls (I already have several) to replace the June Calls sold yesterday.

This is my problem and what I'm waiting on.

I don't like the relative negative divergence on the AAPL 5 min chart which is even worse today. I have July Calls in AAPL so it's not like I'd be missing out if I didn't add the new calls as intended, but at the same time I have to be realistic; SMART MONEY SELLS INTO STRENGTH and AAPL has had about 5 days of higher highs, so I suppose it's not realistic to expect accumulation in AAPL at this price level. That doesn't mean AAPL can't move higher, but it doe mean any accumulation for the AAPL move higher was already completed and now it's selling in to price strength, but that doesn't give me the high probability signal that I want to add to the position.

An alternative...
Since it's probably not realistic to expect that 5 min chart to shape up, a move through this resistance area around $580 WITH an unambiguous move up in the market, may be enough for me to add the position. I don't like chasing, but if AAPL moves in to a stronger short squeeze area and it has the market's support, that may be worth riding.

FX Trade is not helping

It's important to see how the market reacts during a pullback, that's a chance to see what the underlying trade is doing, unfortunately, as of this moment, it looks like the EUR/USD may interfere with the pullback, although this is early.

 This small triangle in the EUR/USD looks like it wants to break out to the upside which would interrupt the market pullback as the triangle itself already has.

You can see the pullback on a 5 min chart is interrupted by the presence of the triangle.


Market Update

All in all I'm happy with the way things are going, I'm not buying July AAPL calls yet as I'm not convinced we are done with this intraday volatility. I will say though, as you saw with the AAPL intraday reversal, the head fake has been one of our best timing tools as they almost always occur just before a reversal and there's a reason for that as I have explained, it all has to do with trapping shorts or longs and creating momentum for the reversal.

 SPY Pennant, note how the trendlines have really been respected (I think that has more to do with Wall Street than Main Street-they need to create a pattern technical traders identify with). So far we have a Crazy Ivan which we use to see a lot about a year ago. The name Crazy Ivan comes from the movie, "The Hunt for Red October" and describes a Russian submarine captain's tactics to clear their baffles. The one place a submarine cannot hear an enemy sub following it is in the sub's prop wash, so the Russians would pull a 180 degree turn and head straight toward any potential sub following in their prop wash. I call this type of shakeout in both directions a Crazy Ivan shakeout because everyone is taken out, longs, shorts, those who switched positions thinking a pattern failed only to be stopped out again, it really is a very useful tactic to generate volume and b generating volume you are generating profits.
 On a 5 min chart it seems the trendline is drawn just about right as volume picks up whenever price crosses the trendline.

 DIA has improved a lot from this morning's "in line" status, although there's a small negative divergence, so maybe another test of support, maybe another shakeout? I just feel the intraday volatility isn't done yet.

 DIA 2 min with a big improvement, but also the same small negative divergence, but enough to turn price intraday.

 ES 1 min, there were several earlier positive and leading positive divergences, now it's pretty much in line with price.

 The IWM was one of the stronger of the lot, the 5 min chart is leading positive, I'm waiting to see this kind of activity in all of the averages.

 QQQ 1 min keeps marching higher.

 The 2 min reveals the same intraday neg. divergence as the DIA

 QQQ 3 min shows the same strong positive and an intraday reversal.

 The SPY has improved significantly from that early positive divergence in the small white box.

SPY 3 min.

So I'm going to see what happens on the intraday negative , a test of support, another shakeout?

Credit Markets

I just took a quick peak, High Yield is moving up, High Yield Corp Credit held up well on the dip, it didn't break to regional lows, but held support from the 25th. Both forms of risk on credit are looking supportive of the market.


FX Update

I like how the market is responding, a head fake move below the pennant in early morning trade is just perfect and now the SPX is back inside the pennant. FX (EUR/USD) look good too, the longer term charts never changed and have stayed consistient.

 It almost looks as if news is out or coming out in Europe.


 Euro bouncing off  long term trend line.

 Euro intraday 3 min


 Euro positive leading 30 min

 $USD intraday 3 min

$USD negative leading 30 min.

It sure seems like some one knows something.

Market Update

I like what I see thus far considering where we are in relation to the pennant.

 SPY intraday crosses above the lower pennant resistance line, volume surges.

 SPY 1 min continuing to build a positive divergence, much stronger than the original update.

 That strength is bleeding through to a leading positive on the 2 min and 3 min


 DIA didn't look very special, it's now leading positive.

 IWM 1 min

 IWM 2 min

 IWM 3 min

 QQQ 1 min looks excellent

 QQQ 2 min also excellent

3 min looks excellent, the positive divergences are migrating through the timeframes at an area in which retail traders would be shorting on any move near the lower pennant trend line, it seems to be providing liquidity or cheap shares.