Thursday, November 15, 2012

RIMM Follow Up

I've written about RIMM a couple of times this week and this is one we've been following for a while, both long and short.

There aren't many stocks out there that have longer term signals that suggest something more than a manipulated push higher, it suggests there's some real underlying interest in the stock.

You may recall shortly after the September 13th QE3 announcement I said the high flyers look horrible and the stocks that have been beaten up look good, almost as if people were out bargain shopping. Take a look at AAPL vs something even like RIMM, that's my point!.

Any way, lets follow up on RIMM, I'm still trying to identify the best set up and how that might come about, but this is another one that I wouldn't obsess over getting in at the exact bottom, you may very well miss a great opportunity trying to get too fancy.

 RIMM is showin the signs of the classic price cycle, you see these short term, long term, in stocks, in market averages, etc. It is the nature of human emotion that drives these cycles and maybe the business cycle a bit too (read that as F_E_D policy). Stage 4 is decline, stage 1 is a base and accumulation, stage 2 is mark up when we see a breakout from the base and the asset starts trending up, this is where the easy money is to be made and probably close to 80% of the move. The secret to making the money is understanding the trend and not getting shaken out on natural/healthy pullbacks.

 Here's a closer look at the base or stage 1, this is where we should see accumulation.  Remember how I talk about, "The kids being too quiet"? Usually when that happens they are up to something, it's the same with stocks, when price is flat like this nobody is paying attention to RIMM, it allows smart money to accumulate shares without the scrutiny of every momentum trader out there, it also gives them a stable price; my guess is the process of filling the order has a large part in creating that flat range and stable price (think VWAP).

 This is the exact spot we see the range above, there's a clear 60 min positive divergence, this would confirm our base.

 Since the move above the base, we haven't seen the huge volume spike that will pull in momentum traders on a breakout move yet, I expect it's coming, if we aren't already in RIMM, we want to be in it (if you like the trade) well before stage 2 begins. We have a visible triangle in place right now, I'd think the probabilities are highest that there's a break below the triangle before a breakout to the upside, but that also depends on the broad market. This is the type of situation in which I would ease in to or phase in to the position, maybe 1/3 or 1/4 at a time, this way we can get a decent average price and we can make sure things are going the way we want before we establish too much risk.

 The short term charts suggest there's a breakout on the upside coming, whether we get a downside break first or not is hard to say, usually I'd expect it and the closer we are to the apex of the triangle, the smaller the downside move needs to be to break below the triangle. In any case, whatever the tactical situation is, the strategic looks good for a move higher from here as we see a number of short term positive divergences in addition to the longer term ones in place.

5 min chart

 At the same triangle, the 3 min chart is in a clear positive trend

And while it looks a little different, at the same place (the triangle) we have another positive 3C trend considering price is moving laterally in the triangle and 3C is clearly moving up.

RIMM may be one of only a few stocks I consider to be a long term core "long" position, like UNG.

Closing Tick and Core Positions

For a day that was rather tame by recent standards, the NYSE TICK was interesting to watch, this is a good way to get a quick idea of market breadth without breaking out all of the indicators which I may do any way.

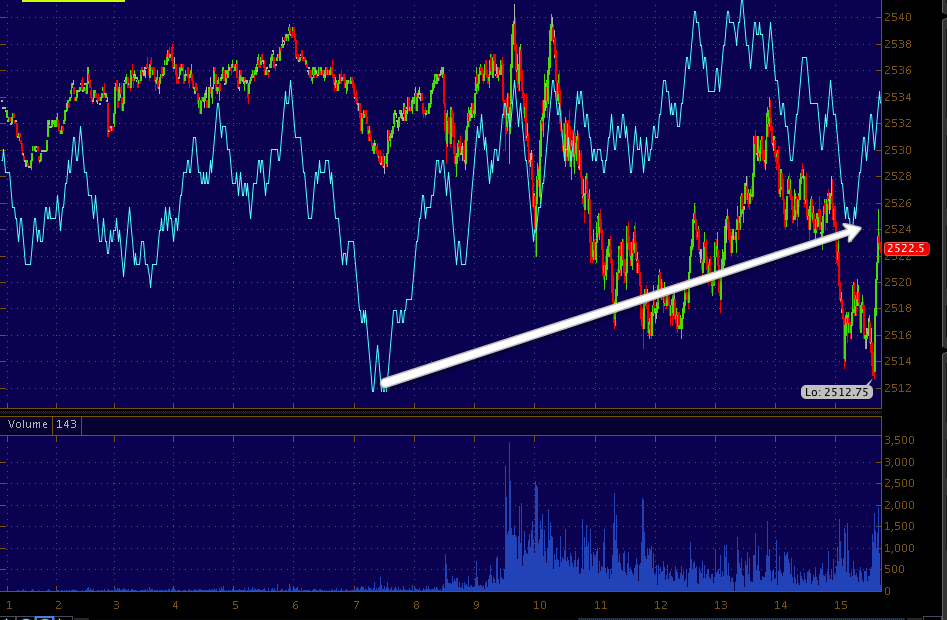
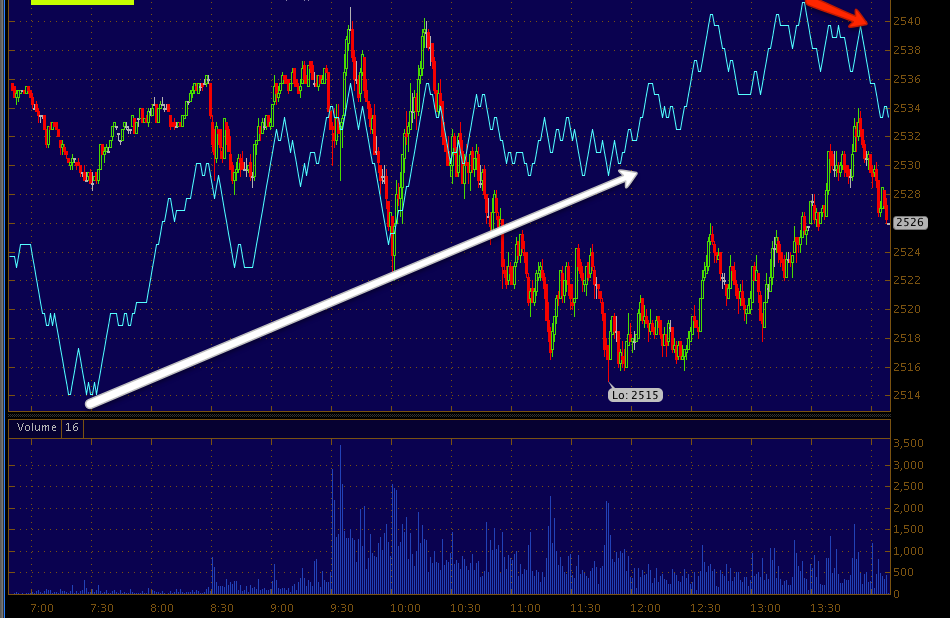
 Today's price/volume trade was something like a rounding bottom. The first TICK that hit in the +1500 area was basically the SPY hitting flat point of 0% move on the day, it went a bit higher than that. The second was not quite at the break-even point and it wasn't in a particularly interesting area, not a huge solid price candle, bot a blow off top at the high of the move, just in the move at +1400.  That's 1400 more stocks moving up that minute than what were moving down, anything above 1000 is strong, above +1250 or -1250 is in the extreme area, +1400/+1500 is generally about as high as you go even in the most bullish of bull rallies, you don't see it often and interestingly not usually on a day that's down -0.19%.

This is the TICK (1 min.) for the last 3 days which have all had interesting moments, but today is clearly trending higher and away from the downside extremes. In blue I created a quick custom cumulative price indicator, it adds or subtracts each bar whether it is positive or negative and I smoothed it a bit so you can see the trend.

I have a lot to look at, scan and update now. If you have ZNGA long, congratulations, that was a decent position and as I said I still think it has quite a bit of upside, in my opinion today was just a teaser.

UNG is not bothersome to me, there's a decent gap from the +5% move up on 11/13, the last time UNG did the exact same thing in filling the gap back on the 9/11 gap up and filled the next week before heading higher.

AMZN I think is decent here as a short term long trade, it put in a indecision day which means the downside momentum is fading out and it did it right under a bearish descending triangle, it's in the perfect spot for a bear trap and saw good 3C positive divergences today.

FB really didn't go anywhere since the exit yesterday and has short term negative divergences, one thing I like about FB is it trades completely independent of the market's magnetism, that may not be a good thing for FB in the near term when the market lifts as it won't automatically draft the market. In my opinion it's becoming risk without an edge and opportunity cost; it still has great longer term prospects.

BIDU-my opinion hasn't changed, I'd much rather be short BIDU than long, but the market has its cycles.

As far as Core Short Positions still open (NO LEVERAGE), IOC is the biggest winner at +19% and I'm not especially worried about it, the speculative ERX long should easily hedge IOC. As with all of the core shorts, hopefully we'll get a really great opportunity to enter these at much higher prices.

IBM is the next open core short at +12%, this is more of a substitute for a Dow Short, we've had 2 really nice shorts in IBM this year. IBM does have some positive divergences, on the whole they aren't as positive as the average or the averages. IBM is hedged with a speculative size long in UDOW.

TJX is up +7%, this is a stock that has a ton of potential on the short side, we got an awesome entry when you look at the bigger picture and this is why I'm hesitant to close positions like this, in fact I'd like to see a chance to add to TJX, I can see this one getting cut in half easily and if we pyramid up short positions' profits, we should be able to make that an even bigger gain.

BEAV is up 6%, this one came out of a top breakdown volatility shakeout from Feb-April this year, this is one that should have had partial profits taken as it was up about 17%, but the countertrend move to the upside is ending now, there's probably a good chance to open a new position if you like the idea or to add to an existing one. This has enormous potential on the downside and that's why I didn't want to get too fancy trying to trade around it.

XOM is another core short, I think ERX is enough to hedge it, XOM is currently at break-even and as such is the worst performer of the core short positions-should have added to XOM above $92.

The GOOG short is the last of the core short positions although I'll be looking to add back some that were closed like BIDU and PCLN which gave us about a +26% profit and thankfully we closed it when we did or else we'd have 10% drawdown on that one. As for GOOG, it's really a partial position as a phased entry was always the plan there, but to bring it up to full size, just waiting for the opportunity with a pop in price, I'd like to see GOOG at $700+ for an add to.

Note that all of the core positions are short except UNG, that's because that's the path of least resistance and highest probabilities, that doesn't mean we can't make money on an upside move.

If all goes according to plan, we should make some good money on spec. leveraged longs while they hedge core shorts, at some point the longs are sold for a profit, the shorts are added to or initiated (BIDU/PCLN, etc.) and we see the next leg down.

Of course if anything changes as we move up then we'll adjust to the market.


GOOG Dec. $640

For the reasons just outlined in the last post, because there are some positive signals in GOOG and because of the size of the positive signals put in today on a pretty mellow day, I went ahead with the GOOG Calls.

For me it's worth it here.

Market Update

I should have known with the last several posts the move in the market was currency oriented, specifically the Euro, this partly explains why the averages and stocks I'm following as Bellwethers stayed positive and didn't turn negative.

As a quick example, the NASDAQ and SPX Futures...
 ES stays positive

NASDAQ Futures stay positive, there are many more averages and timeframes that stayed positive, this is just a small look.

As for the Euro, remember how tight the correlation with the market is, this is actually more because of the $USD, but the Euro is 50% of the $US Dollar Index and as such the Euro becomes an excellent proxy for FX/Equity correlations.

 The Euro is down intraday lower when the market hits about the same level just before 2 p.m., but the Euro continues down, not a big move, just some backing and filling.

 The larger view of the Euro/SPY

 This is an intraday 1 min chart showing a small negative divergence in the Euro near the open, it drifted lower most of the day and then the 1 min chart, which is only for intraday signals, starts to go positive. Thus the Euro should recover from this pullback soon.


The 2 min, next timeframe in the Euro/FXE only had a slight negative, but went positive in to most all of that pullback, again suggesting the Euro makes a new leg higher from here.

Seriously Thinking of Adding to GOOG Calls

The GOOG short position is still in place and at a profit, I wanted to hedge it though with Dec. $650 calls, about half the position size is there.

The market is moving with the Euro, but it looks like an insignificant move that is about done. I'll post that next.

Staying Positive

With the market moving down on that last drop around 3 pm, we actually managed to stay positive almost everywhere.

The F_E_D's Fisher

When it comes to the $USD anything F_E_D_ related is of interest. It seems about the time he said this the market took a dip south...

FISHER SAYS U.S. LAWMAKERS HAVE BECOME `PARASITIC WASTRELS'

A Good Day For ZNGA

On October 25th ZNGA was first introduced as a long idea, I didn't think ZNGA was quite ready yet, but it was showing signs. In that original post I even mentioned the gap would probably need to be filled (Oct. 25)

"ZNGA is a stock I had a mental association with, DOG. However I looked at it last night and liked what I saw, it's not in a great entry place right now, but it's definitely worth keeping on the radar, setting some alerts and looking for that entry as it has a lot more upside to go."

ZNGA has been updated several times, but it's been looking very attractive lately as expressed in a number of updates. I personally think ZNGA is a hold here, I think the way it has set up hints at a strong probability of a much larger upside move.

 The yellow arrow is where we first started looking at it for a pullback.

 The 60 min chart suggests a strong a large base that should be capable of supporting a move of some time and upside.

 The 30 min chart has been right on track and very positive at these areas where ZNGA hits stops and creates a lot of supply that can be accumulated easily.

 The 10 min chart has also been very accurate and has a very positive signal currently.

Only the 3 min intraday is pulling back a bit, but I personally would keep this one open, there's too much going on there for a 1-day 5-7% move.

The Fulcrum

Usually when we have a major reversal there's something that is acting as a fulcrum, I believe in many cases when obvious cycles are put together (The Aug-Oct 2011 period, the March-May 1 2012 period, the late May early June 2012 period, even the Sept-mid October when this cycle started as the last one ended) there's a catalyst: Earnings, the F_E_D,  an EU meeting or idea to fix the union, sometimes a specific stock like AAPL.

This time it's starting to become clear what the fulcrum is in this cycle, what moves it is a mystery, but I believe it is the $US Dollar. We know the dollar has an inverse relationship and therefore moves with the market or causes the market to move, but this looks like something very specific that will move the dollar down and that appears to be the fulcrum.

Here's what I saw and why I suspect this as I have been hinting at the last couple of days.

 Here's the relationship that normally exists, the SPX in green, the Euro in yellow and the $USD in red, note how the Euro and $USD move opposite each other and the Euro and SPX move together.

 Remember me saying that the Euro isn't a great leading indicator (because it's not a popular carry trade currency), but it's an excellent confirmation indicator, in red you can see areas where the Euro diverged with the SPX and either brought the market down or lifted it up and now we have another one of those divergences, not only in direction, but it's also in a leading position.

 However as the Euro turns up and the market is just starting to follow, the $USD hasn't made a turn down yet, it's lost a little ground, but doesn't show the normal inverse relationship. I think there's a reason, some event that is Dollar negative.

 The Volume in the intraday $USD /UUP has been large intraday and many of the spikes have been at highs.

 Then there's the 3C negative divergences, this a 5 min leading, but I noticed (as I also remarked that we have seen some very positive signals Tuesday and Wednesday), here in the $USD the negative downside picked up at the same time, the 13, 14th (the 2 days I mentioned some strong positive signs) and today the 15th which we have obviously seen strong positive signs.

 Here's a leading negative on a 10 min chart of the $USD.

 And a 15 min chart leading negative, but specifically at the 3 days I've mentioned so many times yesterday; also right at the $USD gap up high.

 On a 30 min chart, we had not seen very long divergences, the same 3 days are leading negative

The Euro/FXE
 2 min intraday leading strongly.

 15 min, note where it went negative, at the end of the last cycle -October 18th, and where it has gone positive.

Also the 60 min chart negative to October 18, then leading positive.

I'm almost sure there's something coming that is the catalyst for the market that has a lot to do with the $USD.

INTRADAY PULLBACK

No special or worrisome intraday negative divergences, in fact very few at all, the TICK chart is interesting though.

 DIA 1 min

 This was as close as it got for a negative divergence in the futures, NASDAQ 1 min

 QQQ barely anything there

 SPY nothing there

The TICK
Not only has the trend in the TICK changed over the last few days/today as prices are next to flat, but we have a move to the +1500 area which is extreme on the upside, especially when the market is essentially flat!

Major Market Update

The signals today look amazingly good, they are rising in huge leading positive divergences as price either falls or is in a range.

I'm going to show the Q's and then try to give you an idea on different charts without putting 100 charts up, also some interesting developments in AAPL.

 QQQ 3 min is now in  a huge leading positive divergence, but pay attention to where it is leading positive and what price was doing, this is the essence of a divergence, contradicting price.

 The 5 min chart again with a huge relative positive and leading positive and look how much was today alone, it seems like a dull day, but underlying trade looks very busy.

 On an intraday basis, I was surprised to see this 15 min chart leading positive today as it is.

 And here it is in scale from the start of the cycle. This suggests a VERY strong move to the upside, not anything like what the financial press might say.

 On an intraday basis, the 2 min has slowed to a consolidation on this chart, but now it is back leading positive and price followed it higher as an intraday timeframe should.


 DIA 3 min today

 3 min DIA trend, so a lot of these charts are even more positive than you might realize.

 DIA 1 min intraday.


 IWM 10 min leading at a new high, this is the entire cycle timeframe.

 IWM intraday 2 min today, leading positive on a big way like all the others.

 SPY 3 min leading positive through today, these price formations like this that seem dull/boring are where we often see the biggest moves in underlying trade.

 SPY 1 min

 ES at a new leading positive high


NASDAQ Futures doing the same

 As for AAPL, here's that 3 min chart I wanted to see break above the local highs, it's pretty awesome right now, the white boxes being the areas I believe we have the heaviest accumulation.


The AAPL 30 min chart is now really moving, it may hit that new high today, this is a long timeframe and represents large underlying movement.