Wednesday, November 28, 2012

Something Fishy About Today's Trade

After running through some charts here are a few things that stood out, but the whole day was strange before I found any of this.

As mentioned earlier, today is the last day for hedge funds and others to make trades and still have them settle before the end of the month for next month's numbers or prospectuses.  It seemed to be algo based trading meant to hit stops on the downside and the upside, 
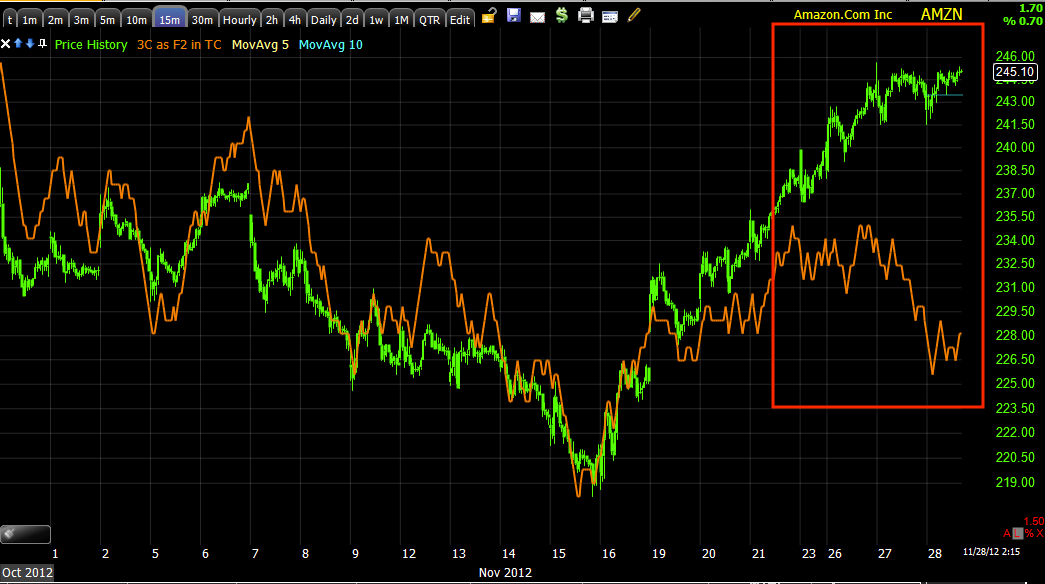
you may recall this post in which I wondered if this was where they were taking the market....

Sure enough, that clear resistance zone where a bunch of short stops would be was exactly where they were going with the market is a very parabolic way, that's not natural trade, that's parabolic/manipulated trade to reach an outcome which was to trigger shorts' stops and maybe trigger a few buy orders, check out the volume as price crossed the area (this is why I never put stops in obvious places, yo are just asking to be stopped out). You can also see by the light blue bid/ask marks next to price the SPY is down in AH trade right now.

Risk assets in general weren't following stocks, which makes sense considering what was going on today, thus it's hard to confirm today as a true risk on day when other risk assets didn't participate.
Context can show us this broadly...
 As you can see both the SPY arbitrage model and the ES model were not as enthusiastic as ES and the SPY, that's because the risk assets that go in to making the model were not rallying with stocks, this is a form of divergence and a big question mark looking over today's trade rather than confirming it as a true strong day.

While CONTEXT is good for the broad strokes, our leading indicators are more specific...
 This is yields in green vs the SPX in red, I often tell you yields are like a magnet for the market, the averages tend to gravitate toward yields, so at the far left they are in sync, then they move up, but the SPY overdoes it and comes back down, by this time yields are leading and the SPY makes another move higher, by the time it reaches its high, Yields are once again negative and the SPY follows them down until they meet up in the green box at the far right. Now the SPY is up and Yields are down, once again disconected with the highest probability being the SPY moves down toward yields.

 Here they are again except the SPX is green and Yields are red, note the recent trend and recently yields have been moving down in line with our 3C divergences calling for the same move lower in the market.

 Intraday as the SPX rallied, Yields wanted nothing to do with it and went the opposite direction.

Currency
 As pointed out Monday BEFORE it happened, as the triangle formed in the orange box I said it was likely we'd see a head fake move up above the important EUR $1.30 level which we did at the red arrow, this set up the head fake and 3C showed the EUR/USD as being negatively divergence and likely to fall and they did. Below the apex of the triangle at the orange line some stops would have been hit (longs), note the bounce today stayed under that level.

 Here's the EURO ETF in orange and the SPX in red, at the white area the Euro is stronger than the SPX and pulls the SPX up (arbitrage), then in the red box the Euro falls which puts pressure on the SPX which also falls until they meet up at the lows, from there today the SPX took off trying to hit those stops after taking out the earlier stops in the morning on the move down, however the Euro just couldn't keep pace, leaving the SPX open to more arbitrage downside.

 I can't figure out why the market needed High Yield Corporate Credit to rally with the SPX today, but as soon as the stops in the market were hit, High Yield Credit sold off HARD (light blue line).

 In fact applying 3C to HY Corp. Credit we see a similar "pullback" negative divergence in credit.

 The actual selling in the last minute in HY corp. Credit was HUGE, this is over 1.5 million shares in 1 minute, that's about half the normal 200 day average daily volume so you get a feel for how big the selling was in credit.

Junk Credit also saw huge volume selling off in the last minute of the day.

 Using the Clear Method (slightly adapted) we see a few reversal candles on higher volume making them more reliable, we also see each trend reversed with a noise candle in yellow, even though we had a bullish engulfing candle today, it was also a noise candle, each of the last 3 trends on this chart have reversed on the same candle as today.

 Here's S&P futures in after hours as they turn negatively divergent (leading negative).

 The larger trend and more reliable 30 min ES is also in a very clear leading negative divergence.

 This is NASDAQ futures also going negative in after hours/overnight trade thus far.

And the longer term trend is clearly negative and leading, just like all of the averages on important timeframes. I really don't see how this market goes higher without pulling back and repairing the damage first.

For now I'm not changing any positions or revising any trend table expectations, I still think the weight of the probabilities is with a strong pullback move.

Futures and FX

The 3C charts of ES and NQ are both deteriorating for the first time this afternoon, at the same time the EUR/USD is falling. Today's dip and then rip would have knocked out a lot of stops, but was that all there was to it with today forming a bullish engulfing day? Had I not seen other things and known other things I might take that bullish engulfing daily candle for just that, but as I said  earlier, "I'm not buying it" and there's one tiny little detail I forgot about today, it's the 28th of the month which means it's the last day for trades to be executed and settled for the month; typically more important at quarter's end, but window dressing is always there, even on a monthly basis.

In any case, there's more going on than meets the eye, Credit sold off right in to the close after hanging with the SPX all day, something is definitely fishy.

I'm still looking in to charts and scans, etc., but make no mistake, 3C for NASDAQ and S&P futures is deteriorating significantly compared to the normal session.

AAPL is the odd one

Now that the normal market hours are over, it will be interesting to see what the EUR/USD does and what else happens with futures, algos can easily manipulate the low volume environment, but do they need to.

Why the work of algos? Look at AAPL. AAPL is the stock of choice when they usually want to move the market higher because it's weight is the same as 50% of other NASDAQ 100 stocks combined, move 50 stock or 1? 

However AAPL didn't lead this move, in fact it didn't even keep pace and I think I see why....
 The 1 min intraday chart is the easiest to move, often in the past before HFTs were so dominant in the market, a market maker or specialist could and usually did move this timeframe, which made it very suitable for day trading trends intraday. No movement there, not even confirmation.

Why? AAPL is a LARGE Cap, it's also an expensive one at that, algos can move the market pretty cheaply if they hit the right areas where they get help from retail, but I'm not sure if that happened or not, I'd ned to look closer at the breadth and internals.

The real problem with moving AAPL is this...

 I'm not even drawing in the trend lines to highlight the divergences because they are so obvious, just look at the timeframe and dates, this is a 5 min over 3 days

 This is a 10 min over about 3.5 days, this is a pretty heavy timeframe.


And this is the 15 min which is superior at calling swing moves, it's a serious timeframe and that's a serious divergence, I think there's too much flow out of AAPL over the last 3 days to make up for it enough to get it to move and thus move the market.

Churning?

This is usually a dead give-away
Lots of bag-holders usually on a move like that with no gain after it

Market Update

Nah, I'm not biting. The move is too parabolic and there's too much damage. Parabolic moves generally end badly.

 There's too much damage in the DIA, it needs to be repaired on a pullback and the move above local resistance is to obvious a bait.

In yellow is the last little parabolic move, they don't last.

 The Q's even out to 60 min are flashing trouble ahead.

 The SPY and look how parabolic today's move is.

The TICK is at +250 to +650 on a new daily high?

Not biting.

Now most averages are there

 Yields are totally divergent -they act like a magnet for equities...


 The Euro is now out of sync so it's no longer arbitrage, it's likely algos.

Here since the move the Euro is even more out of sync.

Beyond the intraday arbitrage, here's where the Euro really is compared to the SPX..

And HY Credit just turned down, Interesting. I need to pay attention, this may move very fast.

Could this be?

Just looking over some leading indicators and seeing the TICK fall out with the market trend as the day wears on it gets worse, Yields are way out and now even the Euro is disconnected, so I'm looking at this really ugly chart of the SPY and wondering, are they going for this? Even if they were it doesn't change any positioning, just timing.

That's a 10 min leading negative divergence, that gets answered, but that zone of clear resistance, is that where they're heading first?

As I write this I'm watching a more parabolic move in the SPY and that's exactly where they are going. Lets see what happens when they get there, that 10 min chart is fixing itself.

GOOG Battle Plan

We can say the same for AAPL, we have a plan for AAPL and if you aren't familiar with 3C analysis and multiple timeframes, I would direct you to this post from last night. A few members who have known me to be very bearish on the market (long term) wonder if I changed my mind when I talk about accumulation, buying, etc here and there; I didn't change my analysis of the market, but whether I'm bullish or bearish entirely depends on the timeframe and the signal given. I believe in taking whatever you can from the market, not just trading it in one direction when you have good evidence for an interim move in the other.

Now for the short term and larger term picture and general plan for GOOG (unless the market gives us a different message, which thus far it hasn't)...

 The daily chart is a great example of how traders' refusal to adapt makes them easy targets and makes Wall St. a bit more predictable. If you are a Technical trader and going by the textbook as most do, you see a bearish continuation pattern called a bear flag in GOOG, you expect the bear flag to break down through the lower support of the flag (the parallelogram), which it does and since most traders only enter on confirmation, Wall St. makes sure it does so the shorts will enter, what ever is left of the longs will sell and there's plenty of supply that Wall St. can accumulate without raising ANY suspicions because everyone knows that someone has to take the other side of the trade. If you are a Institutional firm, your orders are huge and to get them filled at good prices you need supply and lower prices if possible, this head fake move of a common bear flag provides both.

If the flag met its measuring implications GOOG would be trading somewhere around $590 right about now, instead we have a candlestick reversal (Star) on increasing volume and an upside reversal, this is causing some shorts to cover which will lift GOOG's price even more which will cause more shorts to cover and lift price more.

 Long term I'm bearish GOOG, this is why (daily chart), the recent leading negative divergence is the worst we have seen in GOOG ever so I think a year or so from now GOOG is significantly lower and I want to position for that at some point.

 In the very near term the 3 min chart above...

 And the 5 min chart suggest GOOG pulls back a bit in the next several days, the GOOG short that is open now at a -1.17% position loss and about a 1/100th portfolio loss needs to be covered, hopefully this near term signal for a pullback in GOOG will help do that and maybe at a little profit.

 The longer trend and more important than a small pullback is this 15 min chart's positive divergence, it was positive in to the bear flag o that entire ordeal was a set up from the start so they could accumulate shares, push GOOG higher and probably do the same thing I'd like to do, SELL SHORT IN TO STRENGTH AND DEMAND.

Again, this is the big, or ultimate picture, if a rally in GOOG over the medium term gets us in to a good position to enter with minimal risk and high probabilities, that's exactly what i want to do and I think that's exactly what smart money is trying to do.

Quick Market Update

The market has been nice and flat since about noon, remember "We don't see many V shaped reversals, they are usually U shaped"? well it's time that creates that "U" shape and it's flat markets/ranges where distribution and accumulation are seen the most often, right about the same time most traders are bored to death and not paying much attention, this is why I always warn to be careful in dull markets.

In any case the flat range I think has more to do with VWAP and institutional money's use of it, most likely it is their tweaking that creates the flat range as they (market makers and specialists) try to fill orders at VWAP (if they want to get future business).

GOOG Update and plan coming next...

AAPL starting to get a bit ugly

UNG

Thursday as usual we do have the EIA Nat Gas report, at least with that one they give you consensus. Nat Gas has been getting knocked around by talking head on TV lately, "A warm winter" blah, blah, blah. They don't get it, UNG's huge change in character which is when we first started following UNG and then the huge change in trend (some of you are up 20% to 45% and it hasn't even broken out of the base to stage 2 mark up) has nothing to do with winter forecasts and everything to do with US energy independence and the new law signed this year on power-plant emissions which makes building a new power plant in the US a two proposition scenario, nuclear or natural gas; clean coal can't pass those emission laws.

Don't forget all of the strange stuff like the congressman pumping Nat Gas during Bernie's semi-annual Congressional testimony, as if Bernie was an energy expert! However the congressman knew that every investor out there would be watching, it was like a super bowl ad for nat gas.

 Why do we like UNG other than the huge change in character?
 For starters the 2 hour chart's leading positive divergence through the entire base.

 UNG is a longer term position, not a trading one and it should provide a great gain for those who can stick with it, it needs to break out of resistance with a big volume spike, this is what traders believe is a sign of smart money buying, but as we know, smart money was in long ago. That move up and spike in volume are a billboard that tell traders, "Look at me!" and that's when UNG moves to stage 2 mark up or where we see trends.

 It's not uncommon for an equity to back off a major resistance area and gather a head of steam before going for the breakout so this trade is pretty normal.

 On the 30 min chart locally there was no negative divergence in UNG, it doesn't look like anyone is letting go of shares, instead it seems they talked it down.

 On a 15 min chart in yellow, no neg. divergence.

 15 min chart zoomed in shows some recent accumulation in the area.

 Even a 5 min chart shows almost no distribution which they usually need a little to get  pullback moving, there's a nice leading positive today.

The 1 min chart shows a bit of distribution, but this is tiny, we have a decent intraday move here, I think it's probably a good area to continue to build on.

If you like UNG and want to add a bit or initiate, now's the time

Remember we have EIA Nat Gas report tomorrow a.m. so that could cause volatility.

Charts coming.

AMZN-

Ooops, I had to close an AMZN long first,

At the fill it would be a 5.4% gain.

Switched around and opened anEquity short in AMZN.

 With a 30 min negative divergence AMZN has a bit of a worse negative tone than the overall market so that is one reason I'd chose AMZN as a short to play some downdraft in the market, who knows if we get some snowball momentum.

"IF" AMZN shows strong accumulation in to a pullback (because this run looks a lot like short covering as there are no pullbacks), then I'd consider AMZN long again, but it has to show something above and beyond what the average is.

 The 15 min chart, I'm not putting all of the negative charts, just enough to give you an idea.

On a 1 min chart the trend is clear as AMZN is more or less in a flat range, which is exactly where we look for institutional activity. The only thing missing is a head fake breakout above resistance, but that's really only 2 days of resistance, it may not be that obvious to make it worthwhile.

AMZN-Short

If you have time to watch it and cover it on notice that may be over a half day or so, AMZN looks like a decent short for a decent size PULLBACK right here. I think I might open an equity short there and I'll post some charts.

It's in a good position right here.

AAPL is going negative

It's a bellwether, the market shouldn't be far behind. Just about all intraday charts in AAPL are negative.

RIMM Update

RIMM is one of the few long positions that I like, that I think can stand on its own feet without needing to draft the market. There are only a handful of these stocks and as I suspected way back when and as has developed since the announcement of QE3 (and I'm pretty sure I know why we are seeing this-but that's a longer story) it has been the high fliers getting knocked around and the beaten up stocks seeing money sniffing around. Here's a hint, if you were a fund manager would you rather the F_E_D told you straight out, "We will maintain ZIRP rates until June of 2015" or would you prefer, "We want to tie our quantitative easing and open market purchases to the incoming economic data and adjust as needed"?

I think most would go for the first because it is certainty, lacking certainty as the F_E_D discusses this new yard-stick for policy, I think many managers feel more comfortable in stocks that are around a 10 P/E on average rather than a 15 or 20 in case the F_E_D all of the sudden changes policy on a Non-Farm Payrolls report.

OK, why do we like RIMM?
 The change in 3C's character on a daily chart is pretty self-explanatory as to why we like RIMM, major shift in sentiment toward RIMM and they are putting their money where their mouths (well they probably aren't talking too much about it yet).

 The 60 min chart in RIMM is fine, it's in confirmation of the trend so no trouble there.

 A 30 min chart is about as far out as we can go to see a hint of a negative divergence in RIMM, this is along the lines of the overall market so again it's not a problem, more like an opportunity.

 A 15 min chart makes the divergence clear, but it's small, it's just enough to send RIMM in to a pullback, it's not serious distribution like we were seeing in AAPL where funds REALLY wanted out.

 We want to buy RIMM in to a pullback, let it come to us, but we want to see accumulation of the pullback to know when its time, we aren't there yet.


 The Clear method shows RIMM with two reversal candles, both on rising volume, that was your cue that a near term reversal was coming, the clear method so far on the daily also shows there's nothing standing in the way of ore downside in a pullback. If you didn't get in when we were watching the base (you'd be at a 50-75% profit right now) then the next best thing is on a pullback at lower prices/less risk.

As for stops, I'm inclined to give 3C a strong voice in any potential stop, but just using the Trend Channel, the tighter is at $9.60 and the wider is at $9. Again though, I'd look at 3C before deciding whether to stop out and I'd use the wider channel, in fact I'd prefer $8.85 on a pullback.

Patience, this will come to you.