Wednesday, May 7, 2014

EOD Market Update

I'll be working out of a different city tomorrow and have quite a long drive ahead of me tonight, but I'll be obviously checking back in with futures.

Here's a quick look at how we ended the day and a few other concepts of interest.

The first concept of interest is the use of Technical concepts against technical traders, I mentioned this earlier this afternoon when I saw a symmetrical (bearish) triangle form, I said they use these against technical traders because TA traders are so predictable.

The expected move or break from the triangle is down since it's a consolidation / continuation pattern and the preceding trend was down.

 There's the triangle and expected break to the downside, but as usual, they run a common price pattern the exact opposite of what's expected, most traders will see the price pattern as failed and TA teaches to reverse your position on a failed pattern so that would mean they'd be going long this move. Because it's such a small triangle it may amount to nothing, but it wouldn't take much to move price back below it and knock out all of the longs that took the breakout long.


 IWM 1 min at EOD leading positive.

Even if USD/JPY fails at $102 on this run, it has all night to try to get it together and try again, so the concept of 3C picking up where it left off the next day and a leading positive 1 min divegrence could very well make perfect sense for a higher open tomorrow a.m.

 The 2 and 3 min charts are nearly perfectly in line, I'm actually surprised they don't look better, but this 5 min leading positive developed pretty quickly, this tends to make me lean toward a dead cat bounce looking move, which is fine, it will work as well.

 QQQ 1 min also looks like the IWM at the EOD.

And the 2 min chart is leading positive, there's nothing beyond the 2 min chart, nothing on the 3 min.

 The SPY is lagging a bit,  on the 1 min, but remember the amount of relative performance we had earlier between the Dow and Russell, so it may be a little rotation coming the SPY's way.

 This is what the 2-3 min in line charts mentioned above look like, really no edge there at all.

And the 5 min is like a lot of leading indicators, a positive at a.m. lows, not much beyond that though.

 This is ES as of a few minutes ago, again I suspect distribution as USD/JPY nears $102

 NQ is in line

And TF is in a slight leading negative position, but moving in line intraday on this leg.

As for USD/JPY, there seems to be more distribution the closer it gets to $102/resistance

The Yen 1 min is starting a positive divgerence so that would not be helpful for pushing above $102.

The 5 min $USDX is putting in a negative, also not helpful for pushing through $102.

However, as far as the probabilities go, this 15 min Yen negative (and that's as far as it goes), does suggest at some point $102 will be broken, I doubt for long though.
 Yen 15 min leading negative.


 This is the VERY latest of USD/JPY, it's losing 3C and price momentum near $102.
I'll check back in as soon as I get to where I'm going.

Leading Indicators

This is more or less the same as yesterday, these aren't screaming signals, but several are positive enough to be worth capturing and positing.

Again, it doesn't matter to me if we get a dead cat bounce and if USD/JPY take out $102 on the upside, the market is likely to move in a way that looks like a dead cat bounce, that's still higher prices, it's still shortable.

If USD/JPY needs one more shot at $102 before trying to break through, so be it. That's what we have in front of us immediately.

If there's a failure at $102 or there's just too much selling and sends USD/JPY back down, then it's back to whether this market can put in a reversal process with enough gas in the tank to make a bounce. The bottom line is this market looks like "Horse manure" and any chance to short in to higher prices (with a good set up of course) is a gift.

 HYG as a lever to manipulate the market , I mentioned a positive dislocation leading the SPX yesterday, today it's much more clear.

High Yield Credit, this is interesting because it looks like they were willing to buy at the lows this a.m., but not willing to go any further. I can't divine what the thinking is, but I'd suspect it means it's a speculative/small position because they expect any upside to be short lived and want to have a position small enough that they can get out of the way quickly when the time comes.

As far as sentiment (pro), the first of out indicators looked better yesterday, it added some today, so again the feeling I get is the same as described above.

Our second sentiment (pro) leading indicator has the same kind of look, willing to sniff around at the lows, but not much after that.

 VXX vs SPX (with SPX prices inverted to show the correlation), there's a little underperformance in VXX, not the monkey hammering we saw Monday.

Yields are one of my favorite leading indicators and interesting here because they are negatively dislocated, I'd really like to know what they'll look like tomorrow, if they continue heading lower, they will act like a magnet on equity prices and pull them lower to reversion to the mean with yields.

Keep an eye on USD/JPY $102

The Yen weakness 3C was signaling has started and USD/JPY is climbing, now at 101.83, heading for $102 resistance.

If it breaks through, we'll have a dead cat bounce look to the market, if not, then we'll see if it continues to try to build out its base. There are some signs in ES that there's some distribution, likely because traders figure $102 will hold as resistance at least 1 more time.

Either outcome would be fine with me, since we don't have strong enough probabilities for a short duration long position I'm only interested in shorting in to higher prices, if that comes by way of a dead cat bounce, so be it, if it comes by way of a base being built out a bit stronger to support a stronger move, then so be it.

But, $102 (USD/JPY) is KEY for the market
 USD/JPY with a minor negative as it moves closer to $102...

ES with an intraday negative as USD/JPY moves closer to $102, exactly where USD/JPY failed earlier today.

The 5 min USD/JPY base looks better, but it still could come down and look even better, which if the market did the same, then we might have some hitch-hiking long trades possible. MCP was not one of these, this was based on charts and earnings.
5 min USD/JPY

MCP Update/ Possible Trade

MCP is a long time favorite (long) that looks to have been basing, I have some reason to believe GS has been buying MCP as well, but that's neither here nor there.

In any case, they report tonight after the bell.

In the last update for MCP, MCP Follow Up / Trade Set up

Here are the excerpts so you know what happened...

"Last week on April 22nd MCP broke out of a large triangle base on a strong price move of  at least +5.68% when I wrote about it, but something didn't look right and I exited the trading long position that day, here are the posts from last Tuesday and excerpts.

MCP (long) Position Follow Up... 1:33 p.m. April 22nd

"I'm not sure yet if today's move is the start of mark-up or a transition form the stage 1 base to stage 2 mark up, I'd like it to be, but so far we have a parabolic move (granted there's nice volume) and very little in the way of intraday confirmation so far, that can change in a hurry.

For now I am keeping the MCP long open, but if I don't see some improvement or I see deterioration, I may close out the trading position on today's move of +5.68% thus far...

A breakout of a triangle like this at its apex is a clear technical trading buy signal, what bothers me is there was no head fake/ stop run on a very obvious support level, first. Thus, if I feel this is going to end up being a false start, I'd likely try to book the gains, get out and wait for what would more likely than not, be a head fake move below support, that's where I'd want to re-enter, but lets give this a little time and see how things pan out."


Here's what we have now, this isn't quite the head fake move I had imagined, but if there's a leak in MCP's earnings, this would be exactly what I'd imagine...
 The longer term 60 min chart and the very strong upside probabilities as MCP looks to be in a clear stage 1 base any way.

Here's the triangle mentioned above from the last update, the breakout above it is what I didn't trust, there was no confirmation so we took our gains and exited MCP, I put out the set up of what I was looking for which included a head fake move below VERY obvious support, that's one of the things that bothered me about the breakout, no head fake move first.

Now we have that move below support, one of the things I was looking for to establish a new trading long position.

The 15 min chart shows distribution at the failed breakout and a positive divegrence on what I suspect is a head fake move.

 10 min chart with distribution at the head fake Failed breakout where we exited at a gain, and a nice positive on the move below the triangle.

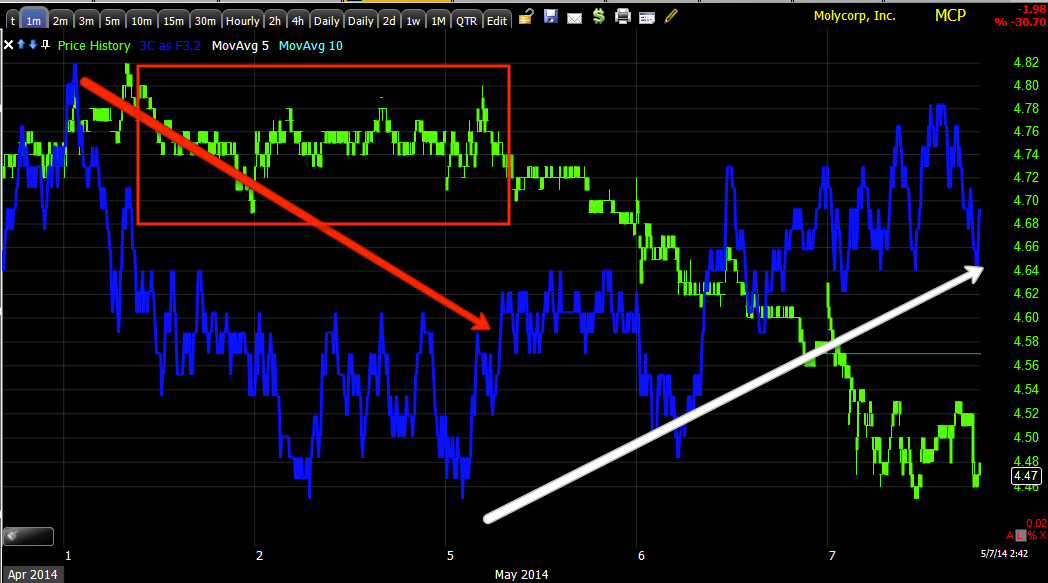
 Intraday the 1 min chart sending MCP lower right before earnings and a positive divegrence in to that move.

And the 3 min chart.

The problem is, a reversal process of a head fake move would look like this, but I'm going to go ahead and take a chance and open a Half Size trading position in front of earnings (equity long), as there's just too much there that looks out of place or, lets just say, "manipulated".

Quick Look at IWM

 This symmetrical triangle in the IWM would normally be taken as a consolidation/continuation pattern, meaning a break below would set up the next leg lower which is usually about the same size as the previous leg that preceded the triangle.

These tend to make for good head fake moves because traders' reaction to them are predictable, a break below and they short and a break above they tend to buy as a failed price pattern usually means you should reverse your position , at least in Technical Analysis dogma.

The 1 min chart looks pretty decent intraday in the area of the triangle...

As does the 2 min chart.

However there's not too much after that, I'm not taking any trade based on a 2 min chart, but I suspect it's there for a reason , likely to further the cause (building this base out larger) or a less likely (because of the FX situation in USD/JPY), it could be a dead cat bounce and that's it.

FX Update

The USD/JPY and the divergences in the single currency futures are probably one of the best reasons to suspect an bounce we can short in to. Right now there are divergences (positive ) in the USd/JPY, however I get better information looking at each currency individually, it's not so much $USD strength as it is short term Yen weakness, which would also fit with a "bounce" in the market as the 3C weakness in the Yen is "short term".

 THis is the correlation between the USD/JPY (red and green candlesticks) and ES / SPX Futures (
purple line).

Thus wherever the USD/JPY go, Es is sure to follow or something close to that.

 This is the 1 min USD/JPY with a sharp negative divegrence , I see this as distribution as the pair moved higher because everyone in FX knows $102 is the key level, look at the highs this morning where USD/JPY pulled back, EXACTLY at $102.

A breakout however above $102 would send the pair higher and drag index futures with it, but remember it still looks like it would be a short term move because the Yen negative divergence only extends so far.

This is the larger 5 min USD/JPY 3C chart and it looks like it's putting a small base together.

This is the $USD, it had a negative divegrence in to early trade, but that has resolved with 3C making a higher high, but as I said, "it's not so much about $USD strength as Yen weakness".
 
The 1 min chart of the Yen shows a slight negative divegrence forming, but this is only really important for timing, the signals that would move the Yen lower and the USD/JPY higher are on longer charts.

Like this 5 min that's leading negative and especially...

This leading negative 15 min, it's not a huge negative divergence and at 30 mins the Yen is in line, but this would be enough to send the Yen lower, the USD/JPY higher and break $102 and pull index futures up with it, I think that is why we are seeing the positive divergences (although still pretty weak) in the market averages.

Market Update

As volatile as the market is (interesting relative performance too today between the averages, DIA +.67% / QQQ -.93%) today, I do believe there is a reversal process that was first imagined yesterday, then we saw some hard data in 3C, TICK, Leading Indicators, etc. However I think to those just watching price, it's pretty difficult to make anything of this mess and that may be how they want it so they can get retail to chase price.

 First today's NYSE Tick data, for as bad as the market looks, intraday breadth has been leaning toward the more bullish as we see top side breadth readings of +1250-+1500, that's a lot of stocks moving up per bar. On the downside the extreme is about -1000, but not spending a lot of time down there. Notice there's no trend except a lateral mess, but the intraday breadth being on the positive side I believe is a hint we should pay attention to.

SPY 1 min looks like it's coming down a bit intraday soon, but I wonder if it puts in accumulation on the way.

There's a 5 min relative positive in the SPY, if a pullback intraday accumulated we'd start seeing stronger charts and migration.

The 1 min IWM has a positive divegrence and even though it's down about -.80%, note how the trend is turning sideways (green arrows above price).

 IWM 2 min is also seeing a larger positive divegrence being carved out. I'd expect continued volatile chop here, but more to the side than down.


QQQ 1 min is pretty much in line, I suspect it comes down to a.m. lows, what it does there will be very interesting to me as this is a very new, very immature divergence.

The QQQ 2 min however is leading positive so a pullback toward the a.m. lows may send this divergence to a new leading high which would be interesting and I may move a position like SQQQ around, I'm not sure yet.

You can see easily why the DIa is outperforming, this is the 1 min intraday with a positive at the dip on the 5th and at the lows today, but the next chart is more interesting.

Look at this 3 min chart, leading positive.

The DIA may even be a trade using a 3x leveraged long like UDOW, I wouldn't say we are anywhere near the confirmation needed to enter such a position, but as a hitch-hiking trade, if we get to that point, it may be worthy of consideration for short term traders.