Wednesday, July 16, 2014

AAPL is Another

In this case any kind of a bounce would be nice, but it looks like something just broke very suddenly, kind of like the last time too many people tried to fit out of the same small door all at once.

Another high on tomorrow's WL.

AMZN is Another That is Very Close

Again, depending on whether the IWM can get off its back and whether Wall St. just decided, "Better to end the cycle now than get caught", AMZN looks to be right in the area, it will be high on my list in the morning.

I believe BIDU is Going to be a Short right in this area

It may be give or take a day or so, depending on the IWM, but I wouldn't have a problem with BIDU short in this area.

Quick Update

Serious deterioration continues, if not accelerating, especially in the SPY and it looks like Financials may be the reason. I'm sticking with the IWM calls for now, but there has been deterioration there too.

I believe the number of F_E_D comments has shocked the market in to realizing rates will rise much sooner and faster than expected.

Ooops, the F_E_D Did it Again

We picked up on the changing F_E_D tone at 2:26 p.m. on September 13th of 2012, when Bernanke gave the first hint during a press conference on the day the F_E_D announced QE 3 of all days, that the F_E_D was changing metrics that would allow them to create an exit (although he didn't say it, it was clear) from accommodative policy which sent the market down for the rest of the year -8% from the F_O_M_C meeting's high at 2:26 p.m. September 13th, when Bernanke was asked a question about inflation and the market DID NOT like his new "tone".

If you didn't get the message when the F_E_D changed guidance from quantitative to the arbitrary and easy to manipulate, "Qualitative, you can be forgiven, although we did point this out at the time that the only reason to do such a thing was to allow the F_E_D to find an exit from their $4 trillion plus expansion of their balance sheet.

However, if you didn't get the message when St. Louis F_E_D president James Bullard said , "The Markets are Wrong, the market doesn't appreciate how close we are to our goals" which should be read as tightening rates, then you didn't want to get it.

However if you missed Yellen's 180 degree turn yesterday, chronicled last night in the Daily Wrap.. Don't Want to Miss post, you just weren't paying attention. The F_E_D is SCREAMING exactly what I thought the day before the last F_O_M_C meeting, 

"THEIR HANDS ARE TIED BECAUSE OF INFLATION AND REAL FALLING WAGES, THEY HAVE TO HIKE RATES WHETHER THEY WANT TO OR NOT. "

NOW, in addition to Bullard, Yellen, Kocherlakota and several others, Dallas F_E_D president, Richard Fisher said today,


  • DALLAS FED PRESIDENT FISHER SAYS 'MARKETS ARE OVERSHOOTING'
  • FISHER CONCERNED FED MAY 'BE STAYING TOO LOOSE TOO LONG'
  • FISHER: I DON'T THINK YOU SHOULD 'POP' A BUBBLE, BUT SHOULD LET SOME SPECULATIVE STEAM OUT OF MARKETS
Lets just take out the "Greenspeak".... Markets are "Frothy and overvalued, the F_E_D's "Reach for Yield" has created a monster and if you think for one second that valuations as the talking heads are rampaging on about are not high enough to warrant a crash, just know that almost every previous crash did not have exceedingly high valuations except in 2000, but they certainly are high considering the economic situation in the US and world economy.

He's telling us that markets (like every other F_E_D president) are not accurately pricing in the F_E_D's "NEW" rate guidance which says, they'll hike sooner and faster than the market has ever considered, this is EXACTLY what the Bank for International Settlements (BIS) which is the central banks' bank,  said in their annual report urging "Leading" central banks not to hike rates too late or too slowly and also telling them that they opted for the short term sugar rush policy which has left them with nothing in the end, a clear reference to 6 years of accommodative policy that bought the F_E_D the worst quarterly GDP print of -2.9% in 5 years!

Finally, we have heard over and over from Yellen that the market is NOT a bubble, until yesterday when she singled out Social Media stocks and biotechs, the stocks that move the market.

If there's no bubble, why is Fisher saying what Yellen said about a week and a half ago, that it's not the F_E_D's job to "pop" bubbles? Fisher clearly alluded to a bubble.

Think about the SKEW, the 3C charts and most recently last night's breadth charts that I've only seen look like they did twice in probably 15+ years of using them. Smart money gets it, that's why SKEW is elevated, that's why market breadth has dropped in many cases by more than half in less than a month as more stocks are selling off despite the averages printing "record highs", remember the top of the 2007 market was a record high for the SPX.

THE F_E_D HAS GONE IN TO MASSIVE DAMAGE CONTROL, TRYING TO GET THE WORD OUT QUICKLY IN RECENT WEEKS THAT THEY WILL BE RAISING RATES MUCH SOONER THAN ANYONE ANTICIPATES AS THE MARKET AND ECONOMY ARE IN REAL TROUBLE, FACING STAG-FLATION.

IF YOU ARE NOT GETTING THE MESSAGE BY NOW, YOU SIMPLY DON'T WANT TO HEAR IT.

Here's typically what happens when THE F_E_D HIKES RATES WHICH WILL SLOW OUR ECONOMY MORE THAN IT ALREADY IS....Higher interest rates is the main effect.

 Some of these declines don't look very large so to give some perspective, at 1 to the far left when the F_E_D started hiking rates, the market fell -45%, at 2 when the first rate hikes hit, the market fell -45% at the more recognizable tech bubble in 2000, there was at least a -38% SPX decline, the NASDAQ was worse. And at B in 2007 after a series of hikes failed to cool the housing market , they finally took hold and there was at least a -56% decline. *Note the effect of ZERO Interest Rate Policy (ZIRP) on the market to the far right.


The effects of QE which will end for good in October...

Here are past QE episodes and their effect of the SPX.

Any questions where this rally really came from and what happens when QE stops and the F_E_D hikes?

Just from a 3C point of view...
 Dow Jones 30 at the market top of 1929, 1-day chart. 

Did you know the F_E_D had engaged in QE in the 1920's, but this time it worked for a while leading to the roaring 20's, a time of economic expansion, but it seems the market ultimately paid the price for QE even back then. Note the year long 3C negative divegrence. 


Now the same 1-day 3C chart on the Dow 30 now...
 A significant difference hugh? Any questions as to why I say that "Whoever figures out the new market dynamics first, will see an opportunity that no one alive has seen"?

Now, as usual, the longer 3C charts show heavier underlying flow, it seems in 1929 it wasn't as heavy and had not made it to the 4-day chart very much (3C migration)
 However there was a quick, but sharp 3C decline and negative divegrence as it made a lower low as price made a higher high in to the 1929 top just before the crash.

For reference, here's the same 4 day chart, notice it was similar in 2007 to 1929, but not quite as sharp, but did make a lower low in to a higher high. Now contrast that with the QE/ZIRP fueled Sugar rush rally even the BIS said was a band aide that has made no appreciable results.
 
I think we are well positioned to be among the first to understand and work out the new market dynamics.

SLW Follow Up

Yesterday I out out, Trade Idea / Set-up (Intermediate term Position/Longer Term Trend) SLW, this is one that I like as a short for an intermediate term trade, but was not going to chase as it was down  -3.61% yesterday, but as we could see yesterday and as commented in yesterday's post,

"Here are some charts of SLW, this is a trade I suspect you could enter right now short and be fine, but I don't like chasing anything, I'd rather let the trade come to us to give us a much better entry and risk profile....today's higher volume sell-off creates a probability of a short term oversold event starting to play out and that's where this becomes a high probability/low risk position."

And today, bounce it did. This is not the ideal bounce I'd like to see for an entry, but I think if you like the trade these kinds of bounces (this is why setting price alerts to remind you are so important) are useful for entering in staggered positions, you can get a little on today's bounce, maybe 25% or 1/3rd and add to it on any further bounces which  is NOT Dollar cost averaging which is an attempt to lower your average cost to get out of a bad trade, this all is part of your risk management before you ever enter the first share.

Looking at SLW, this seems to be an ideal place to add, but considering the GLD/GDX posts and the silver/miner connection, I suspect we will see some higher prices to add in to. Make sure you check out yesterday's post, Trade Idea / Set-up (Intermediate term Position/Longer Term Trend) SLW,  for the larger picture as this is only an update.


 This concept that was mentioned yesterday is directly the opposite of what Technical Analysis teaches. Any technical trader seeing a -3.65% day donw on heavy volume "thinks" that is smart money selling, IT'S NOT, they call them smart money for a reason and they don't let you see anything they are doing unless they want you too, 3C is our only real window in to what they are doing.

Most T.A. traders would have stayed short SLW yesterday expecting more downside today, this is the concept I have pressed numerous times lately, these larger volume days are often short term oversold in this case or overbought volume events.

Note the Bullish Harami upside reversal pair of candlesticks created yesterday and today (if it holds on the close), that's the upside bounce I'd want to short in to as there's terrible deterioration in SLW on the important charts (see yesterday's post).

 Here's the bounce today, it's not that much, it could be used for a ophased in entry or you can just wait and see if the trade comes to you,  it's important to be able to say, "this trade didn't offer me the set-up I wanted, I'm moving on". There are a lot of busses out there, one every 15 minutes so there's no need to take a sub-optimal set-up.

Remember, your assets should always be deployed in the best trade scenario/set-up with the best risk/reward profile always keeping in mind not to have too much exposure to any one group or highly correlated group.

The 2 min SLW intraday chart looks like it could gather some more steam for the bounce we are looking for to short in to, I see a possible scenario unfolding...

This is the 1 min intraday with a negative divegrence that has correctly forecasted the intraday decline, but the stronger 2 min chart still looks pretty good.

Note the VERY tight correlation between SLW and SLV (red), this is an example of two positions you would not want together in your portfolio as they are likely to move the same and effectively act as 1 trade with no diversification. However, it also tells us that we can look at SLV for additional hints and confirmation.

SLV, like SLW has a horrible looking longer term chart, 60 min. that suggests both are going to see significant, tradable downside, this could be in line with the broader GLD/GDX pullback, but whatever it is, it's probably worth trading if you are looking for a precious metals short play. Shorting SLW gives you advantages regarding use of margin that would not be available to you by using an inverse ETF like DUST for example as it is a short on gold miners with leverage, but in reality it is a long trade you buy.

For more information and an article I wrote some time ago defeating the age-old scare tactic against short selling which says, "You can't make more than 100% in a short as a stock can only go to zero", however with most brokers that's not true, here's the article, Making More Than 100% on a Short

Because the way short profits are treated in a margin account, you can use a portion of the profits without having to sell like a long position, this allows you to pyramid up a position as it works in your favor and it is possible to make more than 100% in a short. This is why I prefer leveraged ETFs for the initial move in the market until I see what sectors look the worst and then prefer to move to straight equity shorts.

In any case, the point here being the correlation between SLW and SLV and the same very strong negative divegrence suggesting a move quite a bit lower.

 SLV has an intraday positive divegrence so the possible scenario I see in SLW if it's not just a straight Harami upside reversal, would be ...

SLW pulling back and forming a broader base, still not very big and good for a bounce only. It would likely see a head fake move to run stops before moving higher. This is not the trade I'm interested, long SLW, the trade I'm interested in is Short SLW in to some price strength to give a better entry and lower risk profile.

The alerts I will be setting for SLW are ABOVE $26.75, 26.90. 27.00 and 27.25. At each of those levels I'll check SLW for short term distribution on a bounce as an entry area as the longer term, more important charts are already very negative, strategically SLW is a short, tactically I'm looking for the best entry.

Later, SLW will likely become a strong long candidate, but that's in the future, 1 bridge at a time.

UNG Position Update

The UNG Aug. 22 calls added on Monday, July 14, Trade Idea (Short Term/Options) UNG Call at a August (standard) expiration, $22 strike are down a little under -12% which sounds horrible if it were an equity position, but for an options position it's a drop in the bucket that can quickly turn in to a double digit gain in minutes.

I still like the UNG call position VERY much, I would consider a UNG long equity position or perhaps the leveraged long UGAZ.

Here are the most recent charts, developments and possible add-to areas or new position entry areas.

 This is a longer term range, I drew it as a rectangle, but it's a bit more like a large triangle, either way, as we say in the south, "Same difference".

The yellow rounding area is a typical reversal process that I always look for as "V" shaped reversals are very rare, this has a lot to do with the size of institutional positions and the time it takes them to set-up their position as well as the cycle that is really under their control.

I've actually been watching UNG for this break down and like a H&S top that just breaks below the neckline, it is not uncommon for new shorts who entered on the break of the range to be shaken out in a reversal to the upside which mist move above the range's bottom trendline support as that's where you'll find the new short sellers' stops and that's the ultimate goal, to kick them out of the trade.

Here's a closer look on a 60 min chart, even the downside reversal has a process, although top reversals are often much broader than upside reversals, I don't know why, I've just noticed it over and over again.

Interestingly, yesterday looks like a head fake stop run was carried out, volume spiked just as support was breached, this is often a good timing marker for the start of a move as we see these head fakes (this one a stop run) 80% of the time before a reversal and this works on any timeframe from weekly charts to intraday charts (like the IWM move I'm watching for intraday today).

To give a brief overview, the 60 min chart where the strongest underlying flow of funds is found (other than longer timeframes like 2 & 4 hour or daily/weekly charts) shows distribution at a recent reaction high and that's where we saw the move below support take hold as well as a positive divegrence which is much smaller in scope, meaning I expect a shakeout bounce, not an upside breakout of the range.

 I love these charts like 10 min as they show perfect confirmation as 3C makes lower lows with price, there are small divergences you can see in the trend, but the main theme is confirmation of the downtrend turning in to accumulation. I find these charts to be very reliable.

The 3 min chart is going to have a stronger looking divergence, but in actuality the weaker looking 60 min chart's positive divergence is much stronger as the timeframe is indicative of much larger underlying funds moving around.

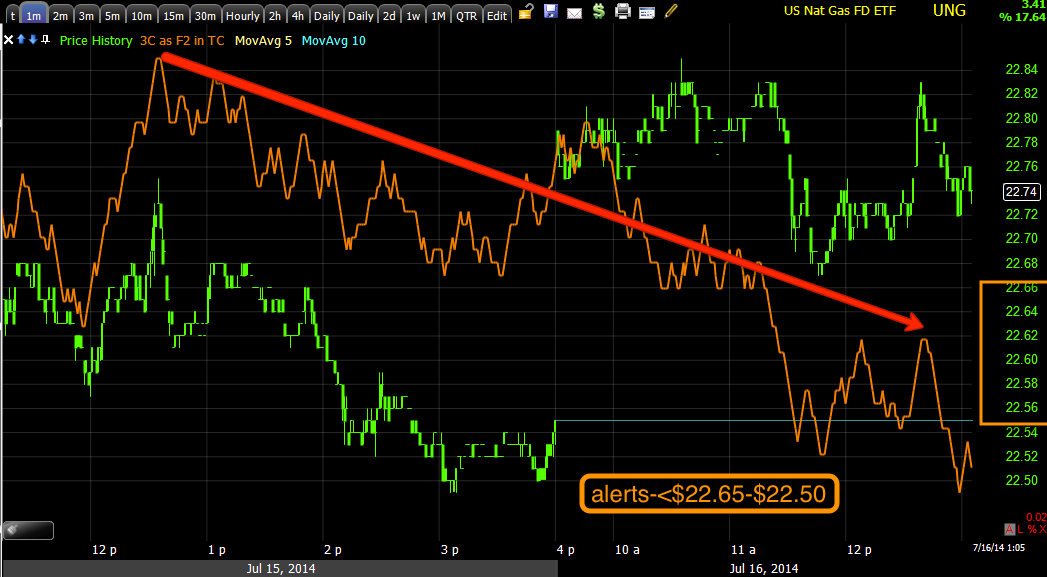
Intraday on the 1 min, we saw a gap up today right after yesterday's stop run, however there's a light negative divegrence. I'm not moving the UNG calls in place, but if this negative intraday leads to a gap fill before continuing higher, I would consider this an add-to area or area for new long positions in UNG or UGAZ so if you are interested, I would set price alerts from below $22.65 to below $22.50. If the alerts are triggered, I'll double check a pullback in to the gap for accumulation, if it is there as I suspect it would be, I'll let you know as this would make for a nice add-to or new entry.

GDX / NUGT / GLD Update

Uless there are really strong signals in GDX and GLD like the head fake at the bottom with huge accumulation that started the last major run up or the strong pullback signals that we got, confirming the GDX breakout was indeed a false breakout or what technical traders see as a "Failed breakout"; the bottom line is the day to day shorter term moves take a LOT of analysis using not only multiple timeframes, but multiple assets. For instance I need to look at 6 different timeframes for each of the following to put together a composite picture, GDX, NUGT, DUST, GDXJ, JNUG, JDST and GLD, that's 7 assets times 6 timeframes for each so it's a little time intensive, but I think I have a handle on what to expect, where the next trade will be and maybe where we can expect the larger pullback buy to occur.

I try to put the best chart for each timeframe that most represents the composite picture of each asset, but there are quite a few.

 This is GDXJ (Junior Gold Miners) 60 min 3C chart with a negative divegrence at the breakout area and a very large positive divegrence (where we initially bought NUGT) at the head fake move/base.

This is something VERY important to consider in understanding the markets. I've often considered writing a book to address the "Random Walk Theory" vs. the "efficient Market Theory" that traders have argued about over decades, my book would debunk both. The market is neither random nor is it efficient as we are seeing in prices while the economy is in shambles.

I often say, "Wall Street doesn't do anything without a reason" and they are very forward thinking with their inside information. 

In any other market over the last 400 years, the breakout in GDX would have been valid until things started to change with the internet and advancement of Technical Analysis, around 2000 everything started changing.

While we have our tools to give us signals, one of the best uses of them has been understanding how Wall St. works. HOW COULD WE HAVE PREDICTED IN ADVANCE THAT GDX WOULD NOT ONLY BREAKOUT, BUT THAT IT WOULD BE A FAILED BREAKOUT?

Don't get me wrong, I love GDX/NUGT and can't wait to buy them again at the right time, but this is the way in which you must start to come to understand Wall Street, nothing is random, nothing is efficient, almost everything is controlled to some degree.

The 60 min chart above is a good example of the breakout seeing distribution as new buyers buy the breakout, they create the demand Wall St. needs to sell their supply for a pullback, obviously not all of their supply as they spent a year accumulating it, but enough to load up again at lower prices.

JNUG is Junior Gold miners 3x long, this is a 15 min chart, it also shows an excellent signal of the breakout seeing distribution and a head fake move just before the reversal in the yellow box, this is a concept you can count on seeing nearly 80% of the time, it is what I'm waiting for in IWM right now to possibly add calls.

 GDX (Gold Miners) 5 min saw a larger volume event at the lows yesterday, often a short term reversal signal just like our Dominant Price/Volume relationship's, Close Down/Volume Up, tends to lead to a short term bounce the next day.

I suspect GDX will break out above the base neckline again and possibly create another head fake move or bull trap.
 DUST is the 3x leveraged Short GDX ETF, the opposite so this 5 min chart with a leading negative divergence from the mirror opposite of yesterday's GDX lows, DUST's intraday highs, is confirmation of the GDX chart above, which means expect DUSt to pullback. Ironically, this may set up the next DUST trade I said I'd entertain if there's a set-up, even though it's not the main trade, but a piggy back to the main trade, NUGT long on a pullback.


 GDXJ (Junior Gold Miners) 2 min shows the accumulation again of yesterday's lows, confirming all charts above (and below).

This is the GDX 60 min chart with the important base neckline, I suspect a head fake/false breakout there, but just looking at the size of the reversal process, I DO NOT THINK THERE IS ANYTHING APPROACHING A REASONABLY SIZED REVERSAL PROCESS TO CREATE A REAL BREAKOUT, IT'S TOO SMALL, NOT ENOUGH TIME FOR ACCUMULATION.

 As I reminded you yesterday, my Trend Channel which is the first custom indicator I won an award for, later copied or ironically coded exactly the same (3 years later) by Price Headley, this moves according to recent asset behavior unlike envelope channels at presets or the wild swings of Bollinger Bands, when it detects a significant change in character it produces stops or buy signals, however,  this is one of the best ways I have found to stay in the trade based on objective data and not opinion as to how far is far enough.

However as I reminded yesterday as well, the initial stop which was triggered in red, often does not give a clean "U" shaped/rounding reversal, there's often volatility that is not worth sticking around for after the main trend has been stopped out. I suspect we are going to see some of that typical volatility that proceeds a signal in the channel like the recent stop from the previous uptrend.

 I looked at GLD as gold has a strong correlation to gold miners as shown yesterday, GLD also stopped out of the recent uptrend and has significant gaps below that will likely be filled.

However there's a gap above that looks as if it could be filled first.

This is an excellent chart for GLD showing the distribution/downside reversal/pullback and the short term accumulation yesterday as well as the upside gap that can be filled. GDX would likely move in tandem with GLD after GLD just had 2 of the worst days in a long time on the downside.

I suspect GDX will target the gap below, but the market is never "reasonable", traders would expect a gap fill and for that reason I suspect the accumulation and reversal process for GDX/NUGT (where I want to buy them again), will take place just below the gap as a head fake move as many traders consider the gap as support so broken gap support would create retail stops and short selling that provides Wall St. with the supply needed to accumulate in size.

Adding to IWM Calls

Yesterday I took out what was pretty close to a full size position for option positions in IWM calls because I refuse to close my longer term trend position, SRTY (3x short IWM) as it is aligned with the larger play/probabilities. The calls are aligned with the shorter play/probability and not only hedge SRTY, but should end up at a significant gain as well.

Thus far we have not seen the head fake move as IWM support is becoming very pronounced, meaning a head fake move is more probable as more stops pile up below support, still looking for a move under $113.75, but there has been enough intraday improvement that I will add 25% to the position opened yesterday, If we get the head fake move, I'll add another 25%.

Here's what's prompting me to add right now. These will still be August (standard ) $114 calls.
 1 min leading at the lows intraday as they look to have clearly been accumulated.

2 min leading at the same spot.

And even 5 min leading at the same area in addition to the already large divergence in place.


Market Update, possible IWM Call Add-to

This is a strange looking market as most averages usually move together directionally if not pretty close on a percentage change basis, that hasn't been the case for some time and usually that's healthy rotation, but not in this market.

From the look of intraday futures as well as the market averages, it appears as if QQQ and SPY are set to start underperforming and IWM is set to way out perform, still no where near enough for me to cancel core short SRTY even for a quick URTY trade, but on strictly a trading basis I would consider URTY long here or IWM calls, I may even add to the IWM calls  which should be enough to not only hedge the SRTY position, but do so at a gain as well.

Here are the charts, this is a continuation of what we have seen all week in everything but the IWM which looks like it is still sitting in the cradle, getting ready for its move. I really don't want to call out Trade Ideas or add to trades in FB, TWTR, PCLN, NFLX, P, etc. until the IWM makes a move.
 SPY 1 min intraday no confirmation on the gap

2 min showing the volume event yesterday that often acts as a short term oversold situation, the opposite of what many technical traders think is happening, they think it is smart money selling, it's actually smart money buying, but in such small quantity, it's not more than a bounce and it's used as a part of a larger strategy to sell/short in larger size in to demand created by headline new highs, etc.

 3 min chart shows the obvious damage since the bounce started this week as we forecasted all of last week from Tuesday on for this week and specifically in Friday's the Week Ahead post.

The 5 min chart confirms this is the kind of bounce we expected, the kind that would be sold/shorted in to as both selling and shorting come across the tape as a sale. This is why we want to use it for the same reason, follow in the footsteps of the elephants that move the market.


 And just a reminder of SPY's overall larger perspective, or resolution of highest probabilities, another reason to use price strength to sell in to. Remember the 2007 top was also at all time new highs for the SPX.

 QQQ 1 min non confirmation, meaning the gap up is being sold in to.

2 min non confirmation, just meaning the selling is heavier.

3 min meaning the same and showing a trend of it since last week's accumulation area on Thursday primarily, although the first hints came through last Tuesday.

 QQQ 5 min leading negative, I don't even have to draw in the distribution trend, it's obvious and confirmed in other averages as well as ETFs/ inverse ETFs.

 IWM has a different tone, this is the 1 min chart leading positive, it's sitting in a reversal process cradle. Remember it was hit the hardest, down 4% last week so it has the biggest dead cat bounce or should have.

IWM 2 min, the same positive leading trend, very much unlike the Q's and SPY, but the IWM has offered nothing to sell in to yet.

IWM 5 min looks very strong for an excellent bounce, this is why I may add to calls, but at this stage of the market with breadth falling off as I showed last night which I have only seen twice in more than a decade of watching the indicators, there's no way I'm letting go of shorts/core shorts.

And a reminder of IWMs 15 min chart, the dominant theme is distribution and the current area is little more than in line, so accumulation for a bounce is there, but not so heavy that it's anything more than that, but as I warned last week in trying to anchor expectations so you would not be fearful of shorting market strength, these moves HAVE to look convincing, even if you know they are coming they will still look very strong and cause you doubt, that is what they are designed to do, that's how they get bullish sentiment high so they can move inventory to weak hands and scare shorts out. This is a zero sum game, someone has to lose for someone to win.

The IWM cradle. There's support that is getting obvious, I'd look for a move below IWM support as a head fake move as a timing indicator to start an upside bounce, say under $113.75 area.

On a larger scale and showing how volume events often are part of reversals rather than what technical traders often assume.


Other than the open at +1250, the TICK has been very mellow. If you can draw trendlines and then look for breaks of those on TICK, it can be an early warning indicator of intraday moves.

If I add to IWM calls I'll let you know, soon we'll be adding to shorts, but I think the momos and IWM/small caps have to move first.