Monday, October 27, 2014

Daily Wrap

Honestly, today almost felt like a waste of time watching the market. We saw another early Reuters "rumor", un-sourced again (like the one they had to retract last week) that the ECB "may" be forced in to buying government bonds which is no small rumor as it's against the ECB and European Union's charter, it would require in essence , a constitutional amendment and one Germany would not be very likely to permit.

Overnight action failed pretty badly as the ECB's Bank Stress tests came out, it's not immediately clear if it was the results in which Italy's banks performed horribly with their 3rd largest bank, Monte dei Paschi being halted numerous times as well as seeing another short selling ban. Or... or perhaps "And/Or", it's a matter of distrust in the ECB's stress test which was meant to settle the market over European Financial institutions, the problem is the stress test didn't include the most obvious and most likely scenario, a deflationary environment so every question about the health of European banks should they come under heavier stress due to deflation is a total unknown after this year long exercise, in other words, the market doesn't trust the ECB's stress test results which makes them practically worthless.

Not helping the situation...Credibility  was strained with glaring inconsistencies and missing information such as the Polish Financial sector who apparently failed to submit data on time, but it gets better... Italy's worst performer, Monte dei Paschi's results were taken down from the ECB's website shortly after going up (today) and had certain results "retouched" with no explanation as to what the issues were, what was changed and why, this of course after the bank was hammered in European trade as mentioned above, limit down numerous times/halted and a short selling ban.

Deutsche Bank who has had numerous legal and regulatory charges and has been watched for the dollar amount was expected by the European Banking Authority to have $470 million Euros in legal fees as reported by the bank itself for the first 6 months of the year, yet the ECB came up with nearly 3 times that amount at $1.4 bn, none of which effected their capital ratio, with the glaring inconsistency between the EBA's number and the ECB's number being the real problem as the ECB says they got their data from DB, while the EBA said they got their data from the ECB!?!?!? Obviously the stress test didn't let the market rest easy, especially since the most likely stress scenario wasn't even part of the test.

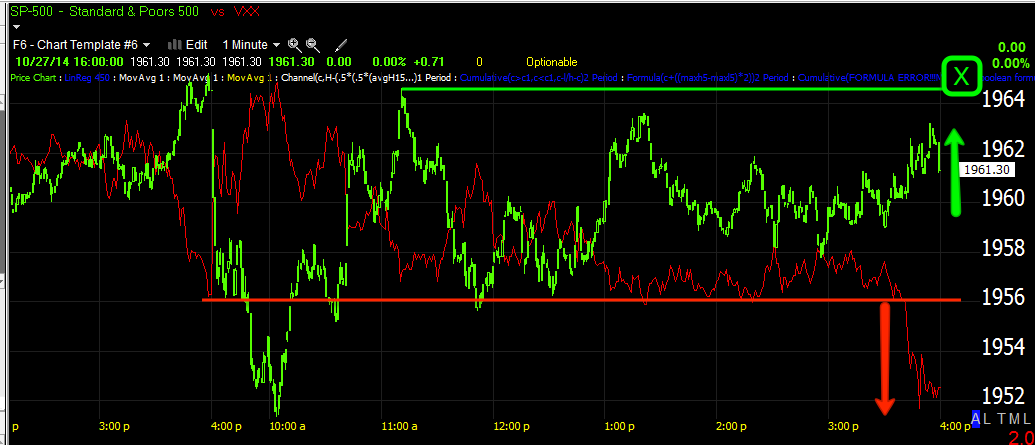
Here we see the ECB/Reuter's Government bonds rumor lows and after effects at the lows of the day.
 SPY 5 min negative closing Friday suggesting a lower open today as we saw with the morning lows rescued by the Reuters/ECB rumor which sent stocks initially higher with other asset classes ignoring the initial move, but then joining in around noon time, for instance...

The USD/JPY (candlesticks) vs ES/SPX Futures (purple) weren't trading together until after the ECB rumor and the noon pullback...

 Here's what the USD/JPY looked like vs ES after the rumor around noon, yields traded with the market as normal as well at the same time.

 Even though Yields (one of my favorite leading indicators) are showing a significant negative divegrence suggesting the SPX (green) move lower, intraday...

The two traded together around noon with the USD/JPY as mentioned above.

It doesn't appear that POMO today, what is likely the last POMO as QE is expected to be phased out Wednesday at the F_O_M_C policy announcement, had any effect on the market with approx. $1 bn in long dated treasuries.


As for the USD/JPY, the current 3C chart looks as if its about to lose ground shortly and that appears to be due to some strengthening or accumulation in the Yen.

Yen 5 min leading positive divegrence.

For its part, VIX continues to ignore the market altogether, it seems as if protection is being bid, whether because of the F_E_D Wednesday or the expected decline from the mid-October rally or both, I suspect they are one in the same to some degree.

 Spot VIX ignoring the SPX (red)

And even though we saw a VIX futures/VXX slam today, it didn't have the desired effect which I think could have been the SPX over its 100-day or 50-day or perhaps, the NASDAQ Green for October?

 So close, but no dice. Note the Ultimate Oscillator's positive and now negative divegrence on this 60 min chart.

VIX futures seem to be under even heavier accumulation as they jumped from a 1 5 min leading positive to a 30 min leading positive and right at the area in which they've been ignoring the market as they "should" be lower.
30 min VIX futures.

As for HYG today, it was being accumulated on a short term basis as shown earlier...
 HYG leading the SPX lower, and intraday...

 despite intraday accumulation, it didn't pop, thus  I suspect the VXX was slammed lower to try to push the market higher.

I think this tells us something about the current condition of the market if it can't make these gains itself after the last 2 trading week's phenomenal gains, but recent negative divergences and it can't get HYG or VIX to do it for it either...

 As for the short term SPX/RUT Ratio, it was pretty close to inline today at #1, but bigger picture leading lower at #2 and its worse than this and this indicator hasn't been wrong since we started using it.

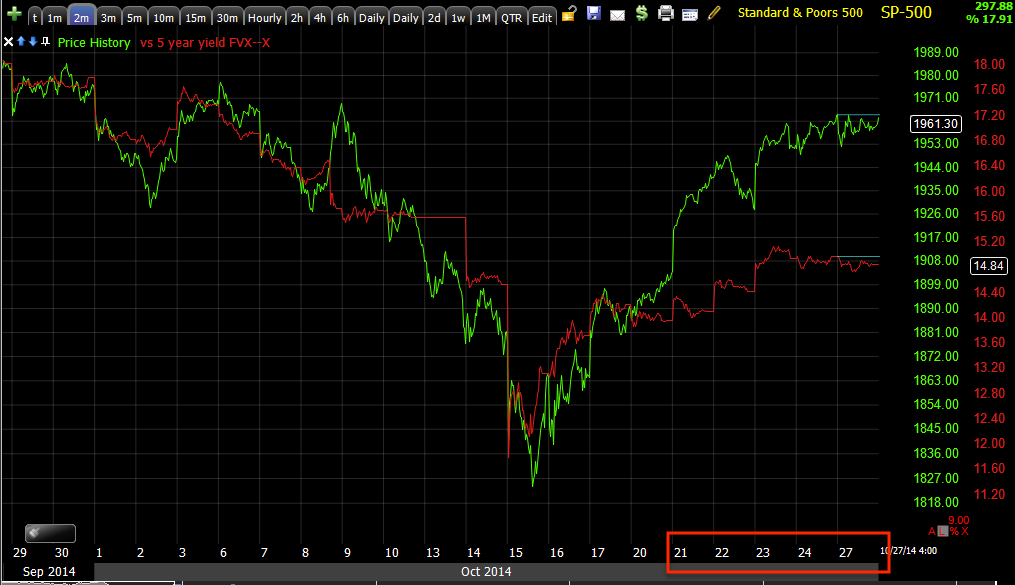
Some are suggesting the F_E_D is helping the market along or intervening, for instance when the market was getting a bit too hot Bullard makes hawkish comments, when the market is in decline in such a way people can't imagine it rallying, he makes dovish comments and I can see how someone might think this by looking at the chart below...

"Bullard comments and market reaction"

 the problem...
 We already saw these divergences in advance, in fact this one we had predicted based on the parabolic move alone hours earlier it would fails and had the divegrences to show it , you can see at this link from 10/9, Quick Update

And as far as the low, we tracked this for well over a week with this timing divegrence right at the bottom BEFORE any Bullard comments, in fact Friday I published excerpts from October 13, 14 and 15 showing what we were expecting and exactly what we got well in advance of any Bullard comments, you can read the excerpts here...Anchoring Expectations

THIS Raises a much larger question, "Is smart money preparing these cycles and when ready, getting help from the PPT (Plunge Protection Team) as a catalyst?" That would suggest a new level of market manipulation using the Plunge Protection Team in a way never envisioned, although we already know QE was a stealth bailout for the banks so is it that much more of a leap to believe they continue to support the floundering banks with antics like this?

I say floundering because as of the last window dressing, the very last day of the quarter, the F_E_D's 1-day reverse repo facility saw over $400 bn in use meaning there's approximately a half trillion dollar shortfall in at least 94 US banks!

I'll keep this in mind and keep an eye on it in the future, although 3C would still be giving us advance notice before any such comments from F_E_D officials if they are in fact moving the market as  CORRELATION IS NOT CAUSATION.

In any case, today's dull day continued in internals with light volume and extremely low liquidity which has been a market positive over the last month with high volume days seeing sharp declines, another sign of the times for the market.

In internals, there was NO Dominant Price/Volume theme whatsoever, not even close. As for the S&P and Morningstar sectors, NOTHING interesting there either, 5 of 9 were green in the S&P and 108 of 238 in Morningstar groups, dull, bland...

There's really not much more I can add about today, very dull, very bland.

We do have the F_O_M_C Wednesday,  this time there's no press conference so the focus (unless they surprise which few expect, like extend QE) will be on the "DOTS" or the median forecast of where the F_E_D Funds rate will be at different times over the next year or two.

Since there's no presser after, if the F_E_D ends QE as all indications have pointed to, they haven't even delayed a single taper since starting the taper, then expect they'll throw the market some kind of bone and expect the "Considerable Period" language to remain, if it doesn't and there's no other surprises, the market could react VERY badly. As always, beware the F_O_M_C knee jerk reaction, it's almost always wrong.

With smaller budge deficits due to infighting between the parties on Capital Hill, there's less Treasury issuance so I suspect the F_E_D will end QE, however the flip side of that coin is with smaller deficits there's less deficit spending which has been a boost for the economy, that has recently been a drag with less deficit spending.

We'll see what tomorrow brings as the F_O_M_C kicks off and I'll check on futures later tonight, as of now, I still expect the theme of the week to be down as Index futures are pointing to...
ES worsening since last Friday's The Week Ahead post...


Failed VIX Ramp Attempt In To The Close

I suspect we know what the HYG divergence is all about after seeing the closing action in which VIX futures were monkey hammered in an attempt to ramp the market and SPX is particular, however it failed, which tells us something about the shape of the market being their trying to move HYG, resorting to a VIX slam at the close when HYG won't move and STILL FAILED...
 VXX/ VIX Short Term Futures (red) are monkey hammered in to the close, making a new low on the day. The SPX (green) "should" have seen a new high on the day, but failed to respond to the VIX Whack-a-mole. The same is true for all of the other major averages, none made a new intraday high on the VIX slam which smacks of desperation. Why?

The 100 day (yellow) and 50-day (blue) moving averages are tight there, less than a point above for the 100-day SPX.

The daily closing candle for the SPX ends up being a bearish Harami or "Inside Day", inside Friday and otherwise, a Doji star , also a bearish closing daily candle here.

Transports Trade Set-up

We already have placed in several short orders in IYT/Dj-20 Transports as a long term trend trade.

The current position which is 2 separate areas in a purposefully phased in entry leaves our current position at a pretty decent average entry...

The average entry is $151.50 (IYT Short) which is a pretty decent entry all things considered in a choppy top.

First I'll recap the big picture and then we'll move on to specific additional or new entry area.

 This daily chart of DJ-20 (Transports) or IYT, shows a VERY clear trend from 2013, very stable and predictable. At the orange arrow there's a clear change in character and in the market, changes in character almost always lead to changes in trends, this being a primary trend (large, long term), it looks like this is a stage 3 top with the preceding trend stage 2 mark up.

 I often note that we see an acceleration in the rate of change (ROC) of price just before a stage change, in this case late stage mark-up (stage 2) usually has an increased rate of change to the upside that is "seemingly" bullish, however this is almost always a red flag that a change in direction is coming (sorry, the indicator I constructed to shows the lift away from the trend line wasn't long enough).

If you can see the trendlines , then you can see not only has the 2013 uptrend been broken, but the lateral range of 2014 has seen support broken, these are the initial breaks of support in top patterns that retail technical traders are taught to short which I ALWAYS stay away from as Wall St. knows exactly what retail will do and they use it against them every time just like we see in this shakeout as new shorts on the break below support will almost always put their stops right at former support  or just above, so the volatility shakeout that moves above the range stops out the new shorts. Incidentally, this is the last place I'll short a price pattern like this or a H&S which has broken it's neckline and rallied back above it, after that, you are essentially chasing prices lower and don't have the same excellent entry and lower risk profile.


 This 3 day long term 3C chart shows the trend of 3C distribution without the noise, this is the main take-away, no matter how strong transports have been, they are under massive distribution and a significant change in trend is coming on a long term primary trend basis as the distribution is significantly higher than the 2009 accumulation.

The 4 hour chart "was" in line confirming the upside trend at stage 2, you can see it starts to lead negative just as price breaks away on an increased upside ROC and since, it has just gotten worse.

Really I don't think we need to go much further in showing what the long term underlying flow is in transports and how it has changed, but I'll show a few more.

 Again, this 60 min chart confirms the uptrend as 3C makes higher highs with price until the change in the trend/trendline. The red trendline above is our average entry at $151.50, so as you can see, we've averaged out right near the very top , in fact only 3.5% from the very top.

 Now specifically for the next entry, the October run was accumulated just like everything else and is showing strong distribution, this is the rough area we want to get short transports/IYT.

 From here I look at the timing timeframes like the 1 min chart and migration to longer charts like 2 , 3 and 5 min.

You can see intraday the highs have been distributed twice. I'm looking for this chart to go more negative and migrate to the 2, 3 and 5 min charts as the 10 min is negative.

 You may recall the post on Friday looking back to what we were seeing and saying on October 13, 14 and 15, you can also see that's about as bottom as you get. There's signs of leading negative 3C signals here, distribution so there's migration here as well.


As mentioned the 10 min is already negative.

I can't say there will be higher prices in IYT,it could just float in this general area as many times distribution occurs in to a range, but even if not for higher prices, I'd like to wait another day or so until the 5 min chart is clearly negative just from a risk and opportunity cost perspective (timing),  although if you are looking at this as a longer term 6-12 month short, I think when you look back you'll see you can't get much closer to the top than what we have done and therefore this area makes just as much sense as any.

This is another one of my favorites that I think will see very large gains, ultimately below the 2009 lows.

Market Update-Stall

Looking around at the market intraday it seems like it's trying to be held here at almost a stall or what could look a lot more like a traditional reversal process, rather than the very rare "V" shaped move / bottom that got this entire move going.

I don't have any doubts about short positions here and will continue to hold them, but there seems to be a very obvious effort to stall price right at this area intraday.

for instance, intraday...

 on a 1 min or 2 min (or 3 min) chart, the intraday chart is nearly perfectly in line, this is normally confirmation of price movement, but there's very little, the point is, other than the 10 a.m. low positive intraday divegrence, nothing much has happened since, while the higher probability and much stronger underlying flow of funds is showing a clear negative divegrence which is the highest near term probability and why I'm not concerned about short positions and would enter them here if I didn't have them...

SPY 10 min (and you saw the other charts this morning both ETFs of the averages and Index futures.

One of the places this apparent effort to stall prices in the area , almost as if it were an op-ex pin is in HYG.

 It's not the 3C divergences in HYG that move price, it's HYG's price itself that leads price (in blue vs SPX in green), in this case it's leading price negative and many other leading indicators look the same...

For example, 5 year yields which we have used as a leading indicator as they tend to pull prices toward them like HYG and it looks very similar to HYG, there are many others.

HYG intraday is leading negative as well as it lost ground on the open as the 3C divergences from last week suggested, it didn't see the 10 a.m. accumulation/gap fill that most of the other averages saw and thus is still in an intraday leading negative position, but it looks like someone is trying to lift it here short term... if I had to guess I'd say in to Wednesday's F_O_M_C, but that's just a guess as it's the largest catalytic event for the week.


 HYG's 1 min intraday 3C chart today leading positive as if someone's trying to lift HYG.

This goes out to 3 min charts, then HYG falls off sharply.

For instance at a 5 min chart both leading negative on this move since mid-October and a larger relative negative since the early October area.

 Or the leading negative 15 min chart, similar to many of the averages and as you saw this morning, Index futures.

Even indicators like the NYSE TICK are almost totally random, there's no trend here at all, as if price is just stalled here and by the looks of intraday HYG charts, it looks like that's the way someone is trying to keep it, I won't speculate as to why.

The one intraday chart that is not showing this kind of behavior as others are like QQQ and IWM as well
 QQQ intraday2 min almost perfectly in line

IWM intraday 2 min perfectly in line.

However the large caps look a lot different.

DIA 2 min intraday.

My first thought would be a reversal process as is the norm...
The normal reversal process, rounding top / Igloo with Chimney, however that too is just a guess at this point as it may be F_O_M_C related or any number of other things or just random, although the HYG intraday divergence doesn't seem random.

In any case, this doesn't change any of my positioning, just explains the flat, stalled trade for now.

NFLX Update / Trade Management

As many of you know, NFLX has been a favorite short position and a member favorite that I probably get more emails about 99.9% of assets out there.  I know a lot of you cashed out on earnings at a nice gain, but I suspect NFLX has a lot more downside.

The recent lows that were first pumped as a buying opportunity by CNBC and then with the news of Mark Cuban buying NFLX isn't all that convincing to me. Wall St. types tell you what they want you to know for their own advantage, otherwise they spend hundreds of millions a year trying to disguise what they are doing, take the advent of Dark Pools as an example.

I'm still holding the NFLX short positions we have opened and will continue to do so unless I have a good reason not to, which I'll try to show you and in that case it would still only be a temporary closure of the position with every intention of re-opening it.

 This 3-day chart of NFLX shows a healthy price/volume trend at "A", then as NFLX progresses through the 4 stages and ends with stage 4 decline in 2011, there's a capitulation event (selling climax) right where the gap down (yellow arrow) on high volume occurs. As I have always said, a capitulation event doesn't mean the lows are in, just that the momentum of the stage 4 decline is broken, stage 4 is for all intents and purposes over and the asset has a chance to form a new stage 1 base, but it will usually drift lower before that happens.

At "B" we start to see a new primary cycle start to form with stage 1 accumulation/base followed by a break-away gap at "C" (yellow arrow) in to stage 2 and what looks to me to be a monster long term Broadening Top (sometimes called a megaphone top). I think this is NFLX's swan song, I think this is the top that changes everything for NFLX. Note the very unhealthy price/volume trend at "C" (above volume) in to the Broadening Top.

On a weekly chart, just to get a larger perspective of underlying money flow, NFLX is very strong through 2011. The base at 2012 is the first sign that NFLX is losing something and the leading negative divegrence which is infinitely stronger than the 2011 top/stage 3, that we see right now is a  major red flag for NFLX in the primary trend sense.

On a daily chart, you can see the Broadening top a bit more clearly. There are a lot of cherry picked examples of technical price patterns in books like Technical Analysis of Stock Trends and others, they do a disservice in teaching people to identify a price pattern rather than the underlying emotional and supply/demand issues (which flow from emotional patterns) which create these price patterns.

If you understand the emotional dynamics which are what create the supply/demand dynamics, you can identify these price patterns that are very useful, but otherwise don't look "exactly" like the cherry picked textbook examples that you rarely see in real life.

Typically there are 5 points of contact in a Broadening top with the last rally attempt to the upper trend line falling short, many times only about half way to the upper trendline before they fail and break below the lower support trendline.

There are more specifics as far as the initial break of the support trendline like volatility shakeouts "if" technical traders identify the price pattern and react to the break below support, such as the volatility shakeout of new shorts who enter on the break of a H&S tops's neckline, which is why of 3 areas I'll short a H&S top, one is NEVER the break below the neckline as it's just asking to be shaken out.


As far as the recent earnings related gap down and subsequent CNBC pump and MArk Cuban buying, I haven't felt like its a threat to the core short NFLX position I am still keeping active.  The fact is, there's just not enough time to accumulate a position that can do much upside damage that quickly. 

NFLX's 5 min chart shows a strong negative divegrence and I think it's coming down, probably in line with the broader market. There's a chance that there's additional accumulation near the $330 level and even on the decline toward that level. If there's a support trendline established with 3C accumulation, a break below that or head fake move/stop run would be highly likely and if that happens, I might close the NFLX core shorts for a short period as that would give NFLX more of a basing process that could support a stronger move like a gap fill, although bigger picture, I think the top is in so I'd be looking for new opportunities to re-enter at better prices and lower risk rather than sit through unnecessary drawdown and opportunity cost.

However, at this point, I don't have any evidence that will happen, it's a scenario I'm looking out for, but no more than a new lower low and eventual break of the top pattern and a primary trend lower, but in a much larger secular sense.

 NFLX's 10 min chart alone is enough to tell me the highest near term probability is a move lower, at least to the $330-$340 area.

15 min NFLX also leading negative.

The current price action has created a rounding top-like price pattern, so if we do see a "Igloo/Chimney" with a head fake move above the recent rounding over, I'd consider that for a put position in NFLX, otherwise I don't plan on taking any additional action for the positions already in place (short) that are at double digit (20+% ) gains.

If you're interested in a possible put/option position, I'd set some price alerts for a move above the $388-$390 area, if that happens I'll check the 3C charts and I'd assume we'd see distribution in to that move, but I want to verify and then enter a put position.