Monday, November 11, 2013

Monday Daily Wrap

What can you honestly say about a day like today? With no Bond market open as a counter-balance it could have been the most ridiculous low volume melt-up for quite a while, but instead we got this a flat range with the biggest gainers were the Dow-30 and R2K @ +0.14%, both spinning tops. On the other end the NDX down -0.11% with what I had envisioned as the mini-cycles look, a 4 bar candlestick pattern called "Falling 3 Methods"...
After the big day down (last Thursday) the next 3 days bounce, but within the real body of Thursday's candle which is what the NDX so far has done. In fact when I posted, "What is a Mini Cycle", Nov. 8th, I described it as...

"A mini bounce or cycle is obviously subjective, but I would consider the 10/9 lows and bounce from there to be a full cycle, a mini cycle might look something like a falling 3 methods candlestick pattern, maybe even shorter. "

It seems that a lot of the signals in 3C and leading indicators actually came through today as last night I didn't feel we were completely done with the "Mini-Cycle", but winding down as indications went more negative.

I really can't say though whether the mini cycle was just for Friday's Max-Pain op-ex pin or if it was for something more, I suspected something more with the range of the last 2 weeks now becoming painfully obvious and attracting limit orders and stops, that can be tempting to hit. but on the other hand, as I said today, "There seems to be no organic demand at all"

The one thing I CAN'T get away from is a "Quiet Market", they're almost ALWAYS up to something, the problem is, most indications look bad, they don't look like that "something is the most obvious move from here, a head fake/failed breakout above the 2 week old, well defined range.

The VIX was banged at the close, but to no effect.
The SPX is inverted so you can see VXX/UVXY's underperformance. Even VIX futures didn't seem to show ANYTHING remarkable. 

At first glance from last night's post and expectations, it would seem we got what we expected, with the Dominant Price/Volume relationship and all, by the way, tonight's is not consistently dominant, but mostly Close Down / Volume Down which is the theme most often seen DURING a bear market, in this case it has no immediate bias or influence on next day trading, it is the closest to unbiased of the 4 combinations. However, once again I still can't get away from that VWAP hugging, low volatility day.

"Credit Leads, Stocks Follow" and Credit markets were decidedly unimpressed with equities or the prospect of risk taking.
 High Yield Corp. Credit was looking worse today than yesterday (all Leading indicators are compared to the SPX in green unless otherwise noted).

Junk Credit which is a risk asset also was way underperforming and not onboard with the equity markets at all, much like the $USD, gold and treasuries weren't Friday.

The longer term cycle off 10/9 lows shows JUNK Credit rolling over at a top after leading the SPX at the bottom and confirming the move up.


 Even the long term (large trend HYG 3C chart) is leading negative, that's a lot of distribution in a very smart market.

The same is true for Junk.

When we look at the sentiment indicators, they are at extremes we haven't ever seen before and they have called many a top and bottom.
 FCT leading negative on the last cycle with a clear top


FCT long term about as ugly as it gets.

The most shorted (Russell 3000) index didn't squeeze today and was nearly as flat as the market.

While my longer term or last cycle custom TICK Indicator is clearly negative, today the TICK didn't give away anything but a very dull looking market.

I could go on and on, but the fact is, the kids playing in the room next door were too quiet. I noticed this too by the close.


 As pointed out earlier, very short term (next day) sentiment in our sentiment indicator looks like something is moving to the upside out of today's range, I wouldn't trust or trade it, but that's what it looks like.

 Toward the close our second sentiment indicator that was staying away joined it.

I noticed a 1 min positive in HYG, despite all the larger damage, there's a1 min intraday positive there for some reason.

And even Junk credit had the same, so I do think we get something, as I have said since last Thursday when the mini cycle first became apparent, WALL STREET DOESN'T DO ANYTHING WITHOUT HAVING A REASON AND THE OP-EX JUST DIDN'T SELL ME.

SO looking at the EUR/JPY vs ES tonight, look what I find...
The carry pair gets a boost and guess who follows?
The carry pair is candlesticks, ES is purple, so this settles who came first, the chicken or the egg, the carry pair as usual led the Index futures.

And look at the other two carry pairs...
 AUD/JPPY

USD/JPY and why?

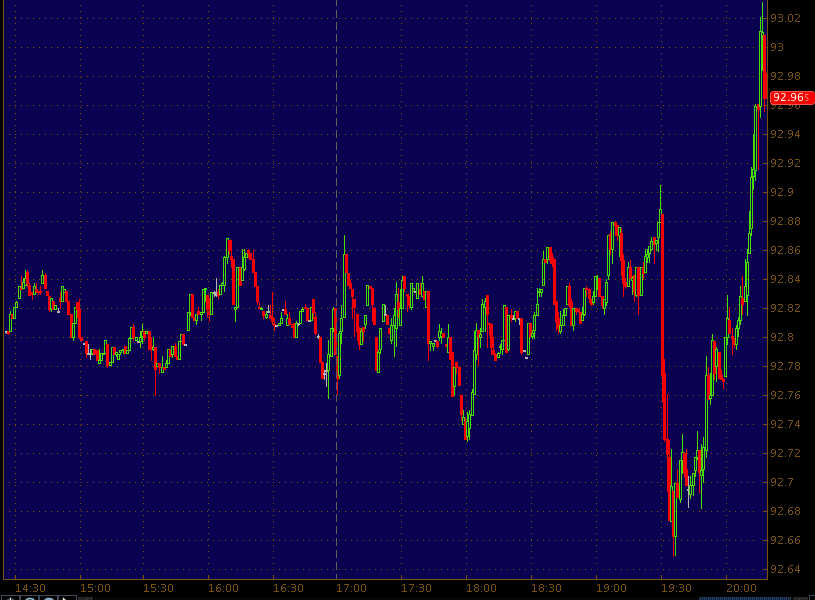
The Yen got rocked...
Remember last week we saw this happens around midnight with absolutely no news, just a crash in the Yen followed by carry trades lifting futures in the low overnight volume market? I even wrote this post...

A SAD DAY FOR THE MARKET...

" 10 point ramp in ES that sent the Nikkei up 1% almost immediately, is a disgrace and very sad to see.

The ONLY reason this happened was due to this...
 A ramp nearly straight up in all of the JPY carry trade crosses like EUR/JPY above.

And this was the ignition...
A smak down in the Yen.

There was no reason for this, no news whatsoever.

THIS IS MIDDLE OF THE NIGHT, LOW VOLUME MARKET MANIPULATION AT ITS WORST. "

I haven't seen any news yet, this looks like the same pathetic attempt to move a market that is otherwise out of gas and looking at credit, tricks too.

SO FAR THERE'S NO NEWS I CAN FIND FOR THIS MOVE SO IT LOOKS LIKE LAST WEEK'S, FIND A LOW VOLUME ENVIRONMENT, SMASH THE YEN AND PUMP THE FUTURES, THAT MEANS THEY CAN'T EVEN RELY ON POMO ANYMORE!

The only other thing I can add is it "looked" like someone in the market knew something as the action today hugging VWAP with bonds closed and 65% of normal futures volume, JUST WASN'T NORMAL.

I wouldn't chase it, as a matter of fact I'd be very cautious, but one asset I like if this holds overnight like the last one did last week (although it started later in the night), XLF-Financials short.

 XLF 60 min

XLF 15 min off the 10/9 cycle

XLF 5 min

XLF 3 min.


There should be a lot more, but first lets see if it holds over night and then we'll see what looks good.

Pretty pathetic though


GLD/GDX making good progress today

These are both open long December call positions and I like what I see.

It's not east to move a 60 min 3C chart in a single day, there has to be some strong activity, but there's good movement in both.

 GDX, what I'm most interested in is the leading positive divergence today alone.

And GLD, again the leading positive divegrence of the last day or two alone is quite significant.

I'm glad I added GLD calls Friday and will keep the GDX calls in place as well.

Still Love Financials Short

I still have the FAZ (3x short Financials) trading long position open, it's still green. If we were to get a move in the market with XLF >$21 and FAZ <$25, I'd be very interested in either XLF short or XLF puts depending on how it happened and/or FAZ long, my preference is really FAZ long as it has some leverage, but it's the kind of position that doesn't need as much maintenance as a put and I feel there's enough duration or profit potential to make it worthwhile.

I'll get some charts up and set some alerts, if we can get that small concession.

Maybe Some EUR/JPY Traction Left

This could be useful if they can get a bid under the pair, a bit longer term and things don't look so good for the pair, but they are controlling the SPX futures/
 ES in purple and EUR/JPY candlesticks, you can see they are attached at the hip.

Earlier the 1 min negative in the EUR/JPY was there, it has caused the apir to stay flat. There may be enough in the Euro as the Yen is still rolling in a base like "U" pattern to punch this carry pair higher.

I think the thing to note is how much it seemingly takes to move this market, again, no organic demand.

Quick Market Update

The SPY and DIA now have clear 1 min intraday positives, I'm guessing it will be a bang the close type of deal and the VIX will be what gets smashed, but it seems very clear they need something like a VIX smack down to make this happen, organic buying demand does not look like it's there at all, it's almost as if this flat range is a battle between distribution and trying to hold it up long enough to bang the close.

Overall I would not call that a healthy market by any stretch of the immagination, it's strange and I'm happy to have kept the trading shorts open.

I'm going to check currencies and see if they may try something there, but that's my best guess, bang the close/smash the VIX to do it.

Leading Indicators

I'm not even going to put charts of these up because I think things can change so fast that they may before I even get them up.

Credit is severely negatively dislocated from the SPX, not just the manipulated HYG (rather HYG used to manipulate the market), but the uncorrelated HY Junk credit is even worse. HY credit is flat an unchanged on the day. One sentiment indicator is deeply negative and dislocated from the SPX, worse than Friday, the other has a fast move intraday to the upside which is almost confirmation of what my intraday expectations are, however if you look at the same indicator scaled out just a bit, it's deeply negatively dislocated, in fact I'll show you this one because it's hard to picture, but may be the best representation of expectations.

 Note the very fast move to the upside as the day wears on, this is what I believe would be the upside break out. Our second sentiment indicator is broader, bigger picture and it is deeply negative, imagine the chart below this one as an intraday 1 min and that's what it looks like.

This is the larger view of the same sentiment indicator above and the same theme as 3C, larger, more important trends going or already very negative with only very short term, weaker trends hinting at a false upside breakout.

However as I started looking at the Index futures, I see they are starting to worsen as the day wears on as well.

TF (Russell 2000) 1 min worsening, but the surprising one is NQ (NASDAQ 100 futures, really sharp decline/decay in 3C and ES shows the same intraday.

The 5 min versions which were already getting weak late Friday are largely the same as last night, TF looks a bit worse.

This is a very strange day with liquidity, no volatility and the bond market closed so no checks or balances on stocks, they could have went wherever they wanted, it's strange, strange, strange.

I'm going to look at some industry groups and see what they are pointing to.

Quick Market Update

Quiet markets are like the kids in the room next door "playing", but they're too quiet, you know they're up to no good.

From a look at the charts and what I saw earlier (although I'm going to flip to Leading Indicators and check that out), I'd expect a fast move sometime soon, I'd expect it to break to the upside, but I'd also expect it to be a failed break to the upside and that may be an area where I might be interested in adding a position or two, but I have maintained all of the trading shorts (mostly leveraged inverse ETFs like SRTY and FAZ).

 DIA 5 min, considering we are working from the mini cycle set up Thursday, carried out Friday, I see a lot of important timeframes since then going deeply negative like the DIA 5 min above.

Ot this DIA 10 min, but look how flat price is, that is a magnet for a false breakout.

The intraday 1 min looks like it will be to the upside, but considering the damage on the 5 and 10 min charts, I say the probabilities are very high for a failed move which makes using that strength (price) to enter a short or selling a long in to strength a tactical advantage. I always want to confirm any move to be sure, but with longer, more important charts that negative that fast today, the probabilities are already very high before any move even starts that it is a false move that fails.

 The IWM 3 min leading negative

IWM 5 min leading negative

The 1 min is leading negative, but could still move positive enough intraday to get a pop above today's range.

QQQ 3 min leading negative

QQQ 5 min leading negative

The 1 min saw an early positive and has been in line since.

SPY 3 min leading negative

5 min leading deeply negative, and note how tight the range is.

The 1 min intraday though makes it look almost certain there will be an upside move. I'll be looking at it very closely and seeing what if anything I might want to add, but first I want to check leading indicators.

This market is way too quiet considering volume and the bond markets are closed.


MCP Long Position Update

MCP's last update was Friday after it had taken out all of the stop levels we were looking for, the update shows them all.

After MCP had taken out the last stop area expected (<$7.40) I added to the position that was intended from the start to be a phased in position and near or at a core long position (longer term long position).

Right now even with the phased in entry, MCP is in the green and looks good to me, it looks like it put in the head fake move under $4.70 and this is what we typically see about 80% of the time in all reversals just before the reversal starts and in every timeframe.

Here are today's charts characterized by a tight triangle, very similar to a bull pennant.

 A is where Goldman Sachs came out with a "sell Rec'd" so my guess is they were picking up shares on the cheap since MCP dropped below an obvious support level and volume ticked up hitting stops. B was a level I expected to be hit at $4.90 and C was the intraday yearly low which I figured would be hit and the one I was most paying attention to to see if it looked like accumulation (a head fake/shakeout) or if there was confirmation, it shows accumulation so I decided to add the rest of the position in MCP.

Note ATR has also picked up on this 30 min chart since moving back above that former support level.

In the reversal process I'm looking for something similar to an Igloo with a Chimney", the reversal process is the rounding as few reversals are a "V" like event and the "Chimney" severs as the head fake move or shakeout or in other cases a false breakout.

This is the shakeout level or head fake under $4.70 in yellow, the pattern that has formed since looks like a bullish bull pennant, I'd watch for a possible shakeout on the bottom side of the triangle before an upside move got going, but thus far MCP has done what we expected it to do days ago.

This is the hourly chart and the two main accumulation areas, one was what would have been support of a large ascending triangle and when that triangle broke lower and formed a large rectangle, we see a sharper leading positive divegrence as shares are easier to pick up with all the stops and at a much cheaper level, this is where we got in after our last trade of +38 and +58% after a lot of patience.

 The 30 min chart is hitting a new leading positive high today as it comes out of the entire rounding process and the move below $4.70 (head fake).

Closer on a 10 min chart, the positive divegrence I was looking for at that shakeout is clear, volume ticked up which is something else we are looking for and part of the reason for a head fake move.

The 5 min chart confirms

And note the Rate of Change in 3C after the GS sell rec'd at the red arrow, As I said back then, GS is more than likely a buyer of MCP and the ROC in 3C seems to make that pretty clear.

I think MCP is still in great position, a stop can be placed a but under the recent lows, I wouldn't put it right at them or any obvious place as it's just bad habit. Intraday a move below today's triangle with accumulation would make for a nice entry, but that's even a little myopic.

Market Update

There are a lot of things that go in to this analysis, I'm going to show you as much as I can in one post, but trying to fit too much in is difficult because things change so quickly intraday, however by and large considering the bond market is closed, the volatility today has been almost non-exisitinet, I think most would have expected quite a ramp by now so this may very well be in line with the weakness we saw developing Friday as posted Friday and over the weekend as well.

This isn't to say I don't think we won't see some upside volatility, intraday we have a lot of right triangles and they'll bust out one way or the other, I'm guessing up on a false breakout, which is a serious scenario I considered last night if Friday wasn't about an op[-ex pin which is my least likely probability.

HYG overall is looking ugly and it is a major supporting asset for the market, but intraday there seems to be some improvement and the Most Shorted Index for the R3K is also showing some improvement, VIX action is not worth commenting on, pretty dull.

First the Index Futures because they were showing 5 min positives on Thursday leading in to Friday's upside. There was some weakness developing in those as of late Friday and here's where we are right now.

 ES showing the positive on Thursday and Friday morning after the jobs report and the market knee jerk to the downside, but also a relative negative in SPX futures now.

 TF 5 min (Russell 2000 Futures) with the same 5 min positive Thursday in to Friday's lows after the jobs report and a leading negative divegrence so there's deterioration in one of the initial signals that told us Thursday a move up Friday was likely.

SPY 1 min intraday is a bit leading negative, but there's a small intraday positive developing, I suspect it has to do with the intraday triangle getting tight in to an apex.

 The longer 2 min chart just shows the leading negative for the day, no positive activity has been strong enough to migrate to the longer/stronger underlying chart. The triangle today is obvious and it's mature/tight.

SPY 3 min is also leading negative, The positive in to Friday's post jobs report lows are visible as accumulation, it seems that's being unwound.

IWM 1 min actually looks to be seeing some of the worst underlying trade just like R2K futures above

The 2 min chart is migrating the weakness to a leading negative divegrence as well.

And the 3 min chart showing the clear accumulation area for the move Friday and a clear leading negative divegrence seeming to unwind what I called on Thursday, "A Mini cycle". I thought it might look something like a Falling 3 Methods candlestick pattern in size and duration.


 Q's intraday have some of the better looking underlying charts as you see a positive, then in line/confirmation and only a small relative negative today.

QQQ 10 min gives a larger view of the "Mini cycle, I'd guess from the accumulation period, that the Q's could and should be able to move up a bit more, but don't get me wrong, this is still a very small accumulation period and thus "Mini-cycle" seems to be an appropriate term.

 NYSE TICK intraday on my custom indicator shows intraday breadth falling off as we are drifting laterally, again I don't think this can or will hold like this the rest of the day, any movement would be useful in determining what is happening, I suspect any upside movement will be distributed as the trends have been heading that way, but I want to see confirmation always.

 This is HYG which has been used extensively to support and manipulate the market higher, last week they started a new accumulation phase in white and the reversal process was about half done before it was abandoned with distribution killing the reversal process and sending HYG lower as seen in credit charts last night, there is a small intraday positive which fits with my view of intraday action, but the larger negative position also fits with the larger view of what we saw late Friday and over the weekend and thus far today.

 This is a close up of the HYG intraday positive, not too large, but enough for an intraday move.

And the larger, more important HYG trend on a 15 min chart clearly leading negative

The R3K Most Shorted Index has improved substantially over this morning, maybe a short squeeze to break this triangle?

 This is an intraday negative in the EUR/JPY, as you know ES has been tracking the carry trades so this would not be helpful for the market.


 This is ES in purple with the EUR/JPY, you can see how no movement in the carry is slowing down the market.

And...
It looks like the Yen is seeing an intraday positive divegrence, this would effect all the carry trades negatively if the Yen bounces from the positive divegrence and put downside pressure on the market.