Wednesday, November 21, 2012

As Simple as This

I could go through all the market averages, the Industry groups, key bellwether stocks, currency, futures, leading indicators, all of that, but I can also show you the same thing with 4 charts in 2 assets. For one asset, the "Risk On" asset, I could have chosen nearly anything that is a risk on asset and moves up with the market, the second is a common asset I use to confirm. The bottom line is NOTHING has changed since yesterday when my opinion was that we have a very strong market cycle to the upside set up and ready to go, in fact it did go this week as is being pointed out, "Biggest 4-Day Run in 4 Months", the truth is most of this move was accomplished in 2- 2.5 days. We had a couple of really nice trades for 115%, nearly 80% and several others.

Yesterday I said that from the looks of the charts we are going to see a pullback, this could be a simple corrective pullback, a fill the gap or even something that tests the recent lows and gets shorts to jump back in the market with both feet. However, the more important trend that has been developing for about a month and the most important of our charts that go with this trend are very strong and put the balance of evidence in the bullish trend on a move that could easily last through the end of the year, but it's not about time, it's about amplitude. So as I said yesterday and wish we had seen today, I welcome a pullback because we need that movement to set up new positions like the AAPL Calls from last Friday that were closed Monday for a 115% gain in less than a day or the GOOG calls closed at a nearly 80% gain.

I'm not going to post all of the charts, I'll just say among the leading indicators we follow Credit looks great, yields look great, FCT is in good shape, the behavior of the market this week with regard to breadth as we have been watching in the NYSE TICK has been great, the powerful positive divergences in almost every risk asset and the level of confirmation looks great, these are the kind of moments we only see a few times a year like when we were shorting around March of this year or when we saw the June 4th bottom coming, to a lesser extent the charts being right about the market when QE3 was announced in September and everyone expected the market to soar, but our charts said something different and they were right, well this is another one of those moments; it's not going to be easy, there will be moments, days, maybe even weeks that test your convictions, but this has shaped up to be one of those few moments.

As for the charts I mentioned above, I chose Financials just because that's what I had open and one of the common confirmation assets, Treasuries (TLT) which are the opposite of risk on, they are a flight to safety trade.

Financials (XLF)
 While there are even longer timeframe charts in Financials with 3C positive divergences, I chose the 15 min because it has a little better detail than some of the longer charts (the longer the timeframe and bigger the divergence, the more important the move that is being set up). The last cycle ended on October 17th/18th, that week I talked about how ironic it was that we started the week long FAS (3x long Financials) and switched in the middle of the week to end the week with FAZ (3x short Financials). We expected a range to develop after that, which it did in all of the averages (some cleaner than others), we always expect a head fake move before a reversal and even more so when we have a very obvious and definable level that traders will take action at, the bottom of the range provided that. We confirm a head fake move by seeing if 3C confirms it, in this case with a move down we wanted to see a 3C positive divergence to confirm the head fake move, we got that. Last week I commented on how the momentum had picked up in 3C and there were divergences in places I had never seen them like in multiple timeframes in the S&P E-mini Futures. After not having taken any long positions or even thought about them in AAPL for a long time, Friday I said I liked the calls, Monday we sold them on a 7+% move in AAPL on no news. So above, we'll let this 15 min positive divergence in Financials stand as our weight of the evidence for a bullish move with exceptionally high probabilities.


 Yesterday I expected a pullback in the market, we saw what happened today which looked like a low volume manipulation trade so we could have a headline like the one above going in to the Black Friday holiday shopping spree. 33 Liberty Street certainly didn't want to see a nasty day down today and we saw that in the futures overnight on the bad EU news, however, this 3 min XLF chart shows the probabilities of a pullback in the next couple of market days (maybe not Friday) to be very high.

 Treasuries or TLT move opposite the market, they are the flight to safety when the market is moving down and here on the 15 min chart you ca see the recent negative divergence sending TLT lower as money is moved from safety to "Risk on". This is simple confirmation of Financials or any other asset you want to choose, it's the exact opposite signal in the same timeframe at the same place.

 How about our market pullback? It stands to reason that if Financials are showing a negative divergence in near term trade then we should see a positive divergence in Treasuries in near term trade such as we see at the white arrow today on a positive divergence (5 min)-again, confirmation that the bigger trend is bullish, the near term will be a pullback.

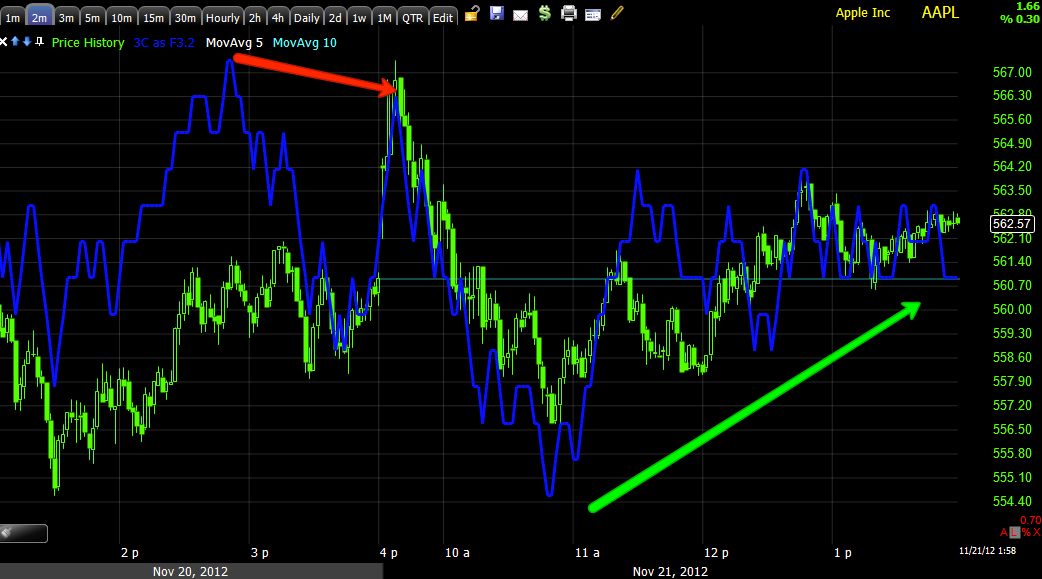
That brings me to 2 more charts, AAPL because this is one of the stocks that I think I might like to set up another call position on a pullback that is accumulated.

 AAPL's 30 min chart representing the longer term trend and the highest probabilities has a large leading positive divergence, just like Financials.

 However the near term 3 min chart over the last 2 days shows smart money getting ready for a pullback in AAPL, as AAPL pulls back (as well as other assets we are trading or considering) we'll watch for accumulation in to lower prices. I don't care where AAPL pulls back to, I only care that we see positive divergences telling us when AAPL is a buy again.

And it's as simple as that.

UNG-NAT GAS

Here's the EIA report from today


Released On 11/21/2012 12:00:00 PM For wk11/16, 2012
PriorActual
Weekly Change-18 bcf-38 bcf

A 38 BCF draw and UNG's reaction...


 That's the reaction on a 10 min chart, nice and our long there is doing very well, if you missed the chance to pick it up on the last pullback, just be patient.


 We are above the base range for the second day, we need a volume spike to move us to stage 2 as that is what retail traders thing institutional buying looks like. Obviously on a day like today when computers are running most of the market, it wasn't likely.

 The 15 min chart and positive at the last pullback as I showed back then, positive and in line since, so UNG looks good.

On a 2 min chart there's a little profit taking ahead of the weekend, not unusual.


Closing Trade Market Update

After watching today, I have little to no doubt that the trading desk at 33 Liberty Street was active today. Looking at the charts, they didn't do much other than keep the market from losing any ground, whether a pullback or something worse from the overnight action when the Futures were hit hard on the failure of the Euro-Group to come to an agreement with the IMF with regard to the Greek funding "Crisis" or "Norm"?

As I showed much earlier today the 1 min charts held together, this is not where you'd see any kind of big institutional movement, these are market makers and specialist, etc. So when you have prices rising and you look at the longer timeframes like 3, 5 or maybe 10 min charts today, if there wasn't accumulation that was commensurate with the price rise we'd see a negative divergence or a worsening one.

Since the only real trading today was very light as evidenced by the 1 min chart, it was likely the F_E_D buying whatever retail offers popped up just to hold prices in place and make today a non-issue in the news in front of Black Friday shopping. However since there wasn't any accumulation either (as evidenced by the slightly longer charts as they are waiting for a price pullback) it's only natural and only makes sense that the 3C divergences on the longer intraday timeframes would look worse and they do. I don't think this represents any real heavy distribution, it's just a function of how the indicator works, this is one of those days when you learn something new.

Here's what the charts look like in the Q's and I'll give a few examples from the other averages, bottom line though, it doesn't substantially effect anything that we expect or change anything in underlying trade, it was just a day in which any pullback was delayed.

Oh, lastly, it would be VERY strange not to see some downdraft in to the close as traders take off risk over a long weekend as many won't come in Friday.

 QQQ 1 min a little negative, but not much movement

 2 min seeing a little worsening development

 3 min is where we'd expect to see worse readings as any support would be small and wouldn't reach the longer charts.

 3 min trend is definitely worse, at  least looking.

 5 min definitely worse as there would be no buying showing up here because it would be way too small.

 DIA 1 min, nothing here.

 However to get a negative on the 15 min chart today is a lot of movement even though it looks small, it's a long chart and where bigger transactions show up.


 IWM 1 min nothing special

 IWM 5 min getting worse on a leading move

 The SPY is showing some late day 1 min negative action

 3 min trend is clearly worse

As is the 5 min.

Again though, most of this is a function of non-participation by institutional money with price moving up and without the institutional support on those timeframes.

GOOG Looking Interesting Now

As you probably know I have a core short in GOOG that is just in the green, I'd really like to exit that for the moment and re-enter at a higher price, however as the market moves further in to the bearish realm, such as this....
(Note each reaction top has a deeper and deeper lading negative divergence and way worse than the 2007 top. )

the market becomes more and more volatile and less predictable, at some point Wall Street loses control over the cycles and the market ends up looking something like this...
In spaces like the red area, I'm fairly convinced Wall Street has no control over the market beyond intraday or maybe very short cycles of less than a week. We don't know when that breaking point comes, we just know that the market is uglier now than it was back in 2007.

So back to my point, while I'd like to close some of the core shorts (all of which are at a profit) I have a rule that my portfolio reflect the highest probability primary trend. This is the reason I left the shorts opened and hedged them out with 3x leveraged longs which should work out well, making money on the longs, hedging the shorts and adding to the shorts at some point.

So one hedge I had for GOOG was 2 call positions, I closed both yesterday for a 12% and almost 80% profit on each, they weren't open for more than about a week and a half (trading days at most).

I'm very tempted to re-open the GOOG calls, I'm glad I closed them yesterday or else that profit would be smaller today, but there are some nice signals in GOOG that aren't in most other risk assets yet. The problem is time decay and the very long weekend coming up. If at all possible, I'd love to open them Monday if GOOG still looks like this.
 The daily bear flag in GOOG broke on what is almost certainly a head fake move, the pattern implied move would have GOOG heading to $575, instead....

 GOOG puts in a nice Clear Method Swing Trading reversal, the red arrows are days that count as downtrend, the green are a reversal to up and the yellow is a noise day.

 Longer term 30 min, leading positive

 15 min leading positive

 The 1 min leading positive, but to make sure it's not like some of the other's we saw today...


The 3 min as well as the 2 and 5 are all leading positive.

GOOG looks ready to make a move to the upside with or without the market. If I were looking at opening an equity only position, I might take it or start it here, but with options I think it best to wait until Monday.


MCP-Update

This is another to keep on the radar, I may add to this position on a pullback. This is not a primary bull trend trade, but there are very few out there (UNG, RIMM and FB maybe), but this does look like it is in line with the market cycle and can provide a good return with very low risk.

 First MCP has had a definitive change in character in the price and volume trend, if you don't see it you can throw a moving average or Rate of Change on it, changes in character lead to changes in trend.

About 80+% of the time when we have a reversal on any timeframe from 1 min to daily, we almost always see a head fake move or a failed move like in this case a break below clear support in the yellow box. There are reasons for this, they set up bear traps, shakeout longs, make it easy to accumulate or distribute larger positions as you can see volume jumped up nearly 300% on the break below support and when you get  reversal the bears caught add fuel to the upside momentum as they cover at a loss. There are many more reasons, but it's a trend we see so often we just assume we'll see a head fake move before a reversal and it has become part of our timing to tell when we move from accumulation to a reversal.

 The 30 min chart has a CLEAR change with a huge leading positive divergence and note where, right under support where large volume was triggered, someone has to take the other side of the trade and smart money can accumulate in bulk on the increased volume and not raise any suspicions as the stock is moving down and someone has to take the other side of the trade. This leading positive divergence isn't there for no reason.

 A 15 min leading positive...

 And a 5 min, but we also have a smaller negative suggesting a pullback, this is what we want, the trade to come to us at a lower price with less risk.

Even using a buy right here and a 60 min Trend Channel for a stop, the risk on the position is about 3%, I suspect we will get a pullback close to the $7 level so the risk would be even less -this is one to keep on the radar if you haven't already.

Futures Update

Here are ES and NQ, both making new intraday leading negative lows and I thought I'd tale a look at EUR/USD, also in a negative divergence here.

 ES

 Euro/USD

NASDAQ

If there's going to be a move down, this is going to be it, futures don't usually stay negative this long w/o a move

AAPL Example

AAPL may be one of the best examples of what I was talking about in the last post n which the 1 min chart "should" be the ugliest and then the longer charts like 2, 3 and 5 min in that order.

As we saw in the last update, the 1 min intraday charts which are normally pretty reliable for intraday moves, are almost totally unremarkable, meaning very little divergence, very little signal, not even worth a post by themselves.

I tried to explain what I think "could" be happening because of sentiment and Black Friday-the last thing anyone in government wants to hear is the market took a dive on the last day of trade before Black Friday shopping, in fact quite the opposite as was speculated here Sunday night.

AAPL is responsible for about 20% of the NASDAQ 100's weighting or roughly the same as the bottom 50 weighted stocks all combined, so AAPL alone can move the NASDAQ 100 and the averages tend to move together.

So I took another look at AAPL and it is an even better example of this freaky aberration on the charts today, which if they hold up, meaning no pullback, I'd have no problem calling out the F_E_D PPT as being busy-bodies in the market today.

 This is the longer term probability on a 30 min chart, has nothing to do with an intraday pullback and just tells us that the probabilities for the next several weeks is that AAPL is higher and probably significantly.


 On a 15 min timeframe we even have a slight negative divergence suggesting a pullback before we see the next serious leg up, this would have come from the faster charts and they would have stronger negative divergences.

 However the 1 min chart is actually in a leading positive position!

It's not that strong that it looks like real accumulation, it looks like intraday manipulation because the next timeframe, the 2 min is simply in line.

The AAPL 5 min negative looks exactly as it should considering the smaller divergence on the 15 min chart as the divergences flow from shortest timeframe to longest for a new move like a pullback, so we know the 5 and 15 min charts and a pullback are very high probability, but the 1 and 2 min charts should look the worst, they don't and that's where we could be seeing small support from the PPT to keep the market up-after all look what they did with the futures overnight.

Any way, I thought I'd point this out as it's something I haven't seen before, but makes sense with Black Friday Shopping, the day that most retailers go in to the black, the 1 day that makes their year.

As far as we are concerned from a trading standpoint, I see no trade on the long side with a 5 and 15 min chart like this, I'd wait for the pullback to look at a long, I wouldn't buy on what is most likely very small time manipulation in which they are just picking up retail's offers.


Intraday Market Update

I have to say the market is holding up well, the TICK is holding up well (which means market breadth is holding up well). On some short timeframes we are seeing some significant improvement which almost makes me wonder if we don't see more of a consolidation through time rather than price or less of a consolidation through price (pullback) and more toward time (trending laterally). There are some dichotomies though that make the short term a bit more challenging than usual, the long term charts and where I think the market will be a week or 2 weeks from now are much less ambiguous.

In any case I'll show you the charts that caused me to put out that last market update calling for a pullback soon.

 DIA 1 min intraday, this is such a small negative divergence (relative) that on its own, I wouldn't even mention it.

 Even the 3 min's chart is really not anything I'd trade on or probably even mention, but...

 This 5 min chart is a bit more difficult to ignore and it is moving lower as price is moving higher.


 ES futures 1 min are also negative, they are not seeing 3C move with price, but rather against it.

 The IWM had a strong positive signal earlier today and now the 1 min chart is starting to lead negative, but I will make note that 3C was in line with the IWM's trend intraday until just recently.


 The problem in the IWM, the 2 min chart is not confirming the price action and rather contradicting it.

 QQQ 1 min was in line until this most recent bump starting around noon. This of course suggests some profits are being taken in to the higher prices or there is some short selling, which can be market makers-both selling (profit taking) and short selling come across the tape as sales.

 QQQ 3 min also not confirming, but once again I must point out that these are NOT sharp negative divergences, they're rather mellow. I believe it's kind of like Technical Analysis use to be before Wall Street started using it against technical traders, in a bull market a bullish price pattern would work maybe 75% of the time, but in a bear market  that same price pattern may work 50% of the time or a toss up, I suspect 3C is similar in that when we have longer term positives underlying trade the short term charts aren't as negative as when we have bearish underlying long term trade.

 Again the SPY 1 min is barely remarkable and I wouldn't bring it up on its own, I'd wait for a stronger signal...

However at 2 min. we saw the positive divergence on yesterday's afternoon lows and now we are moving toward a leading negative  divergence today, this is why I bring it up.

Te last thing I'm also considering is the fact that the worst divergences are on the 2, 3 and 5 min charts while the 1 min charts are almost unremarkable. Early this week I said that I though t there was a good chance they'd try to move the market up, it would have to be enough to make the news and AAPL made such a move Monday as did most of the market, the reason I said this is because people have short memories and if the last thing they hear is the market was strong today, it may influence their sentiment in to Black Friday shopping.

When I see the 2, 3, and 5 min charts negative I feel confident we are going to get a pullback-nothing serious, a constructive pullback, but the 1 min chart should be leading these others, it should look the worst, the fact it doesn't makes me wonder if the market is getting a little help to put in a good showing today before BF.