Friday, February 10, 2012

Initial Internals

For the last 3 days there hasn't been a dominant Price/Volume relationship, its been evenly split between the 4 relationships, today that changed.

Although the SPY did make a late day attempt to move the market (my guess is to keep the bulls hopeful as we enter the weekend and thus keep them in the market and if possible, buying the dip), it was via some manipulation, the Euro didn't support it and it certainly has been a change in character of the trade we have seen over the last month and a half where gains aren't as important (you can tell by the +.12+.50% daily gains which a year ago would go unnoticed) as keeping the market closing green.

 Where's the late day rally that closes the market green by .20%?

Price Volume Relationships. The dominant relationship is price down/volume down, the hallmark of a bear market, but more interesting is just how many stocks advanced vs. declined in each average.


The Dow had 30 losers and not 1 winner


13% of the NASDAQ 100 closed green, as far as bullish closes, only 3% of the NASDAQ 100 closed on increasing volume, not one of the 3 posted a gain of more then .90%


The Russell 200 saw about 15% of the components close green, of that, about 5% closed bullishly.


The S&P saw about the same proportion close green, an 20 out of 500 stocks close bullishly.


The Market's Go To Hail Mary is Hitting a Brick Wall

It may not be immediately apparent at first glance, but AAPL looks like it's hitting a brick wall.
 Yesterday we got our first glimpse of what may be churning in AAPL, although it was a strong day, Smart Money would have been looking to buy a pullback, not to chase AAPL after it's already moved higher starting with After hours on their earnings. The heavy volume and the upper wick on the candlestick suggested the possibility of churning, strong hands selling to weak hands or smart money selling to dumb money which can also be smart money shorting to fill dumb money's orders. Today as AAPL barely moved and saw the same upper range resistance on heavy volume, the churning argument just got stronger.

 The 5 min chart suggests that's exactly what has been happening.

As does the 15 min chart which moved to a leading negative divergence in a rather flat range over the last day and a half.

It may be that smart money has no more use for juicing the market with AAPL.

Speaking of Financials

That's a huge 1.5 day leading divergence in XLF and on a 60 min chart. Rarely do these develop that deep, that fast

This may be why financials performed poorly yesterday

You'd think with a deal on the robo-signing scandal done, the banks would rally, they didn't. This may be why...

"a fully authorized, legally binding deal has not been inked yet."


Essentially, there's still no signed, legal binding deal.


XOM on a Trend Swing basis

This is a 5 day swing chart...
The short trade is already open, the current stop is at $87.13


JPM on a Swing Trade Basis

$38.50 would be the stop here on today's swing short signal, however that is a very obvious stop, I'd use something like $38.63. You may also want to keep the stop tight, in that case, maybe yesterday's lows. Sometimes it takes a couple of shots to get the position you want. Amateurs take 1 shot at a trade and walk away, pros will keep their losses small and 3 or 4 shots until they get the position they want.

3:30-Big Boys Time

 The Euro still hasn't hit that support zone I mentioned earlier.

 If the gap is not filled, on a nearly 1% down day, it won't be good.

How's this for a change of character as far as intraday trade?

Ironic Timing:LTRO

While I was writing the last post, 2 minutes ago Zero Hedge printed an article that proves conclusively that there is a stigma attached to borrowing from the LTRO as banks that did have underperformed banks that did not. I didn't read the article beyond the teaser, but here it is for anyone interested. 

This means if you have an idea of who participated in the LTRO, as conditions worsen in the EU, those are the short targets.


The S&P Said It Was Coming

After the S&P rating's agency stripped several Euro zone countries of their AAa ratings, most notably and predictably, France, they said they'd be focusing on the financial sector; true to their word, they downgraded 34 of 37 Italian banks today. This is not just information for information's sake, but bond holders in corporate debt as well as some equity investment companies have rules they must follow in what grade investment they hold and if that investment sees its credit rating lowered, it is likely to see its corporate bonds and equity shares sold as well.

Furthermore this does nothing to help their liquidity and access to money in the intrabank lending system, not that the system works; the fact the ECB has to provide LTROs to the banking system is evidence that the financial markets are frozen up, just like in 2008 here in the US.

This is just the first round, the S&P will release downgrade after downgrade as they make their way through each country's financial system. The LTRO (one is coming up and huge demand was expected), may very well produce the same stigma that borrowing from the F_E_D's discount window created, which told the shorts which banks to go after. So the next LTRO this month should be interesting as a half a dozen bank in the EU have already made a point to let everyone know that they  DID NOT participate in the LTRO, more or less saying, "it wasn't us, we're ok"

Depending on how many more banks the S&P downgrades and locks out of the liquidity market, the LTRO take up may change dramatically from earlier estimates of over a trillion dollars.

Market Update

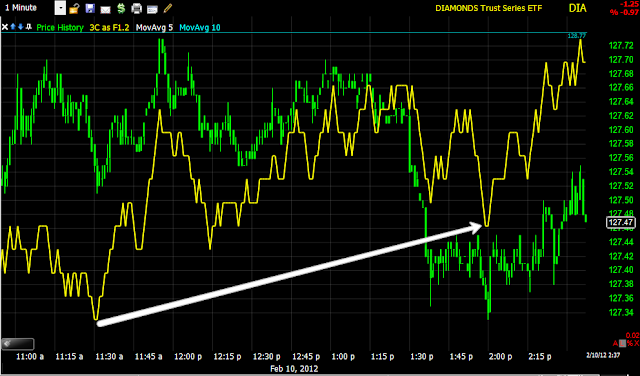
 In the afternoon, intraday, the DIA has a small 1 min positive divergence, maybe it tries to fill some of the gap from today.

 The IWM shows the same small positive divergence.

 The Q's look like they had their best chance early today, there is a positive, but not like the early one.

And a slight positive in the SPY.

It will be interesting if they do move to see whether they move in correlation with the EUR/USD or against it and how far they can get if they do make a move here. Remember a break away gap left unfilled is bad news for the market.

If the Euro can find support at it's intraday lows, it may help the market, if not and slices through to the downside, the market will be trying to swim upstream. One thing is clear, there's no strong underlying support, at best maybe enough to get a gap fill attempt started, maybe.

Market Update

Yesterday's leading negative divergences were a clear warning...

 Yesterday's leading negative divergence in the DIA, a recent relative negative divergence today.

 The leader of risk on trades has looked the worst, this entire divergence has been leading negative while the Russell 2k has been range bound. We often find heavy distribution or accumulation in flat ranges.

 The QQQ's leading negative divergence yesterday.


 Intraday ES has been in a relative negative divergence all day, just like yesterday and now it is leading toward afternoon trade, just like yesterday.

The 4 hour 3C ES chart is now in the worst leading negative divergence and at the same area I have considered to be a sucker's/bear market rally. Note the volume as well in to the rally, the exact opposite of a healthy rally.


 The SPY's leading negative divergence yesterday and a recent negative divergence today.

"IF" this gap remains left unfilled, which is very rare, I'd say only 5% of gaps are left unfilled recently, this will signal a bearish breakaway gap and will be of great consequence.

Breadth

I wanted to show you this last night, but it was after midnight so I decided to wait until today. These are breadth indicators and they are useful in determining whether a trend is healthy (has good breadth) or not.

 The indicator is in green, the comparison symbol which is the SPX is in red unless otherwise specified. This is the % of stocks that are 1 standard deviation above their 200 day moving average. Good market breadth should see this number rise accordingly with the market. However as you can see, while the SPX is near the 2011 highs, the % of stocks indicator is at 44%, whereas it was last seen with good breadth at 71% in 2010, even though the SPX is 116 points higher now, the indicator is nearly 40% lower. Meaning about 40% less stocks are 1 standard deviation above their 200 day moving average, even though the market itself is higher.


 Along the same lines, this is just an indicator that represents the % of stocks 2 standard deviation above their 200 day moving average. From the same period mentioned above, the indicator is 50% lower. It stands to reason that a strong rally should see more stocks participating in it, not 50% less.

 This is % of stocks 2 standard deviations above their 40 day moving average, compared with the October highs, the indicator has failed to make a new high with price and has in fact fallen to 27% from around 48% in October. Think about that, this seemingly strong rally only has 27% of all stocks trading 2 standard deviations above their 40 day average.


 This is % of stocks just trading above their 40 day average, from the October highs, the SPX has advanced , yet the % of stocks has remained the same, rather then advance with the SPX.

 The MCO has pointed out positive divergences at October lows and mid November lows, but in now lower then the October price highs and recently in the last week or so, has turned down in a negative divergence, both long term and short.

 This is the NASDAQ Composite's Advance / Decline line vs the NASDAQ Composite in red, the A/D line is lower now then it was at the September 2010 price lows even though the index is at new recovery highs. This means far, far fewer stocks are participating in this rally, so how do they get the average higher? Stocks in the averages are not equally weighted, buying the heaviest weighted stocks such as AAPL can cause the index to rally. Before the last weighting adjustment about 6 months ago, AAPL was weighted around 20% of the NASDAQ 100, this is the same as the bottom 50 NASDAQ stocks combined. Therefore, if we had those bottom 50 stocks and AAPL and called it the NASDAQ 51, all of those bottom 50 stocks could decline 2% on average and if AAPL was up 4% on the day, the NASDAQ 51 would close up +2% on the day, despite the fact that 50 of 51 stocks lost 2%.


 Several weeks ago I noticed the Rate of change in the SKEW Index was increasing, even before the SKEW Index made a move, I mentioned it on a Sunday night and the next week the SKEW moved to within 1 point of it's all time highs since introduced.

 Once again, the rate of change is moving up, to new highs in fact as the SKEW Index moves up. The SKEW runs historically (according to CBOE data, between 100 and 140. Where as the VIX tries to measure the probability of a likely outcome, the SKEW tries to measure the probability of an unlikely outcome such as a black swan even or market crash. At 100 the SKEW tells us there is virtually no chance of a market crash. It's average reading is 115, when it advances above that, the chances of a black swan event rise. It's interesting to note that after posting close to a all time (since introduction ) high, it is back on the move again, this time with even a stronger rate of change. In the past, high readings (according to the CBOE) have preceded market crashes, sometimes the crash comes a couple of days after the high reading, sometimes a week.

As you may have heard, the VIX futures yesterday put in a 2-day 2 month new high with a 5% jump. It is worth mentioning they are up 9.61% today.

De leveraging in Risk Assets

I introduced this new layout several months ago, because as mentioned earlier, that which everyone knows is not worth knowing. The concept is very simple, these are all risk assets and as such, should rally in a risk on environment, when we see dislocations or divergences, especially in Credit, which is a bigger market then equities and leads equities, then we know something isn't right.

No matter how impressive a rally, there's always a reversion to the mean and usually and overshoot, but when we have multiple indications that the rally is thin and hollow and not a true smart money risk on rally, but more like a puppet show to get longs feeling emotional extremes and jumping in the market with no questions asked other then looking at a simple price chart, then the reversion to the mean is a much more dangerous event. That is the spirit in which these indicators have been introduced.

 Yesterday commodities didn't participate in even the weakest risk move, that divergence led to a reversion to the mean in the short term trade, Commodities are slightly diverging again right now.

 Longer term, Commodities vs the SPX in late October diverged and the market made a sharp, though brief drop. Since the late December move up Commodities have underperformed badly. This has a lot to do with China and in the coming months you will here more and more bad news out of China. I believe as far as I have seen, WOWS first pointed out the problems in commodities and speculated there were problems in China. We were proven right over the next two weeks when China's Services and Manufacturing PMI both came in at a level of contraction, that is why demand for commodities has fallen off, the Chinese manufacturing sector is falling off.

 As pointed out yesterday, they extremely risk on trade of high yield credit hasn't made a higher high in 5 days, despite the SPX doing so, it appears credit has been de-leveraging as it is a much bigger market. In the short term, the SPX made a 1 day move, reverting to the Credit mean. When you see a 1 day correction like this catch up to a 5-day trend, you realize how much faster and further markets fall the they rise, which should be of concern to longs when looking at the severity of the long term dislocations in risk assets vs the SPX.

 Yields have been called a "Magnet for equities", her you can see they called the 2011 top and the late July meltdown in the SPX, they are at an even deeper, longer dislocation now as I not only suspect, but am nearly 100% convinced that the strength in the market has been nothing but a sucker's rally or a bear market rally. Such a rally needs time to be convincing to lead dumb money back in to the market.

 Longer term going back to the 2007 top, Yields also called that top and the first bear market rally in the decline as well as the March 2009 bottom, the late 2009 H&S after QE1 ended and have been on the decline ever since as QE2 was responsible for lifting the market, not underlying fundamentals such as improving unemployment or improving economic activity, just pure manipulation of QE2.

 Even longer term, the 2000 to 2007 top is called here and the current environment is worse then ever.

 In fact yields have reached an all time low not seen since the data series began in 1962.

 If you think the Euro/SPX correlation is dead, just look at the intraday chart of the last couple of days, the Euro called the SPX bottom, yesterday it called a top and SPX reverted to the short term mean as the Euro continues to underperform the SPX even today.

 Longer term , since QE2 ended and the correlation came back, the Euro called the 2011 top as well as the late July market decline, the first October rally top that corrected and now is at a deep dislocation from the area I consider to be the bear market or sucker's rally.

 the SPX has reverted to the mean short term with High Yield Corporate Credit.

 Over the last several days, High Yield Corp. Credit has also refused to make a higher high with the SPX, a warning that has corrected in the short term and did so in 1 day as Credit makes a lower low.

 Last night in this post, I pointed out the weakness in financials, even though they got a sweetheart deal yesterday in the Robo-signing scandal. Financial momentum fell off yesterday as I showed you and the SPX has reverted to the Financial short term mean.

 In last night's post I also showed you JPM's first Engulfing bearish candle since December 6, 2010, today it is confirmed thus far with lower prices.

Sector rotation today...

Sector rotation is clearly in a risk off mood in most of the major industry groups: Financials, Energy, Industrials, Basic Materials. There's a sense of some safe haven rotation as well in improving rotation in Utilities, Healthcare and Staples. The only Industry group that is a risk on group still holding up is Tech, however this is on a relative basis vs the SPX. XLK is at a loss of -.60% right now.


USO Update

Yesterday as USO was up, I posted, "It's probably a decent time to fade the rally here", sure enough, if you faded the strength at any point yesterday, you were and are in the money today.

Remember, we watch for changes in the character of stocks and as I remind you often, they are usually subtle and fleeting glimpses. If it is something everyone knows, it's not worth knowing. Even small incremental changes in volume are important, rather then looking for huge volume spikes that everyone sees.

Here was the change in USO, although I have maintained my bearish stance on it a lot longer then this because of long term 3C charts.

 Since the new year started, it has been a good idea to fade USO strength, whether on an intraday basis or on a daily basis, look at the number of opportunities to fade strength and make a profit.

 Around the same time, USO's long term range bound trade started trending down, but I doubt few noticed this, take a look without the trendlines.

Most traders probably haven't noticed or given USO a thought thinking it is rangebound still.

 Note, just when the "Fade the Strength" phase started and just when USO started trending down, my custom indicator gave a daily sell signal.

 Even my X-over system called out a false cross-over in red and the real one in white with confirmation.

 The daily 3C chart and 4 stage cycle, we are just entering stage 4 decline.

Here's a pop from earlier in the week, worth fading and yesterday's move, again worth fading as 3C remains negative.

I have a longer term perspective on USO, but I am willing to change my stance if the market tells me so, for now, I'm holding longer term shorts in the MP.