Wednesday, September 5, 2012

DULL

Other than a couple of stories in German papers and some verbal jousting before the ECB's announcement tomorrow, I'm shocked and saddened to see what appears to be the "Summer Doldrums" upon us. I think the last time I remember the summer doldrums was believe it or not, 2008.

I hope they haven't returned because they are actually quit depressing for a trader.

I think more realistically is a wait and see approach ahead of the ECB tomorrow, but even for such a big event, the news flow and sewing circle was even dull today.

The market sums it up the best.

 Don't even mind the bearish triangle, I have a feeling it's more waiting than anything.

 Today's triangle appears to be the same, no one wants to do anything in front of the ECB decision.

 Even 3C charts were extremely boring today, not many good signals anywhere which tells me the charts are probably right, the signals are so weak or not even there simply because institutional money wasn't doing anything big today.
1-min

 SPY 2 min-nothing worth reporting...

 SPY 3 min, we did have yesterday's late a.m. positive divergence, we do have a negative, but I wouldn't make any moves based on that.

 Same on the 5 min

 To see any real movement we have to get away from this week on a 60 min chart and that to me is an exciting chart.

 ES was flat, it looked like it might do something for a bit and then gave it up.

 NASDAQ futures overnight were nearly perfectly in line with price, no plotting or scheming.

 During the day, pretty close to the same.

 The 5 min chart is a bit more exciting...

As is the 60 min, but beyond that, just DULL.

Commodities were not performing well for the second day in a row, but on an intraday basis they didn't move much from the SPX. HYG Credit was boring as well, a little bit of a sell-off late day, but not worth capturing the chart. Junk Credit didn't do anything, the Euro  was around resistance, but it looked a lot like the legacy arbitrage algos were turned on again; yields were flat as well.

Sector rotation was moot and averaging the averages, we didn't see much more than a tenth of a percent in any direction.

This isn't the time to get lazy, it's actually the time to look for anything that stood out and I'll be running some scans to save myself the agony of flipping through 1 boring chart after the next. The Good news though, tomorrow should heat up with the ECB.


CAT Follow Up

I knew when I shorted CAT it wasn't going to zero, there's value in the company, it's one of the biggest Dow component stocks, but there was an opportunity to make some money and I'm a believer in taking what the market gives rather than forcing my expectations of what the market should give in a trade, things are way too dynamic.

This also means that I don't try to (as Jimmy Buffet would say), "Reason with Hurricane Season". There are people, institutions, hedge funds, insiders and those with inside information (yes it's illegal but it happens every day) that know more than I will ever know, so I want to watch the signals and the behavior of the asset and make my decisions based on hard data rather than what I think should happen.

CAT is a cyclical stock, I'd think that it's a safe short, but when I get signals that tell me something that doesn't fit with the trade, I don't argue with them. It all comes down to your edge and probabilities.

I'm happy for the CAT profit, a nice stable, easy trade that required almost no attention, but I don't fell like I would short CAT here so I have no reason to hold a short position in CAT here; maybe that changes in the future.

The charts...
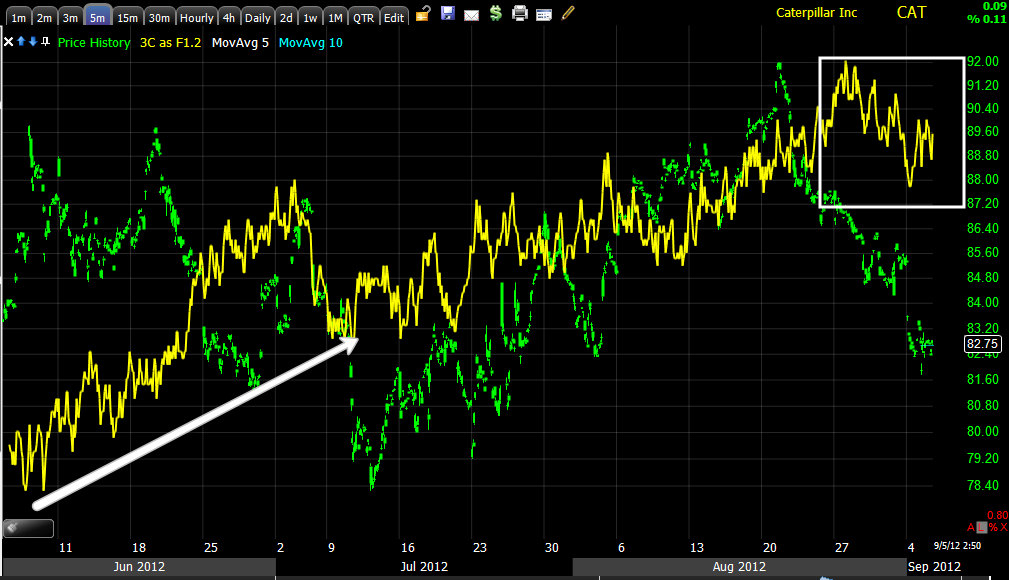
 This is around the area and price level CAT was shorted as a core short, non-leveraged. There's been a great trend in a very choppy market since so although the entry could have been better, the selection was a good choice which was based not on my feelings or thoughts, but signals.

 This is an area that has caught my attention, a high volume move and a small Doji (almost hammer) daily candle, this has a short term bullish implication to it for increased probabilities of an upside reversal-remember though there's no target, it could be a day or a year.

 Using my Trend Channel (my first proprietary indicator which I won an award for) which was inspired by the Turtle Trading Trending system, CAT gave a cover signal at the red arrow. This Channel tracks the individual characteristics of each stock it is applied to unlike an envelope channel or other channels that are dialed in to a particular setting. The Trend Channel tracks what is normal for the stock and then creates a channel around that invisible median of a formula that uses standard deviations away from "normal". When a short breaks above the lowest point of the top channel on a closing basis, something has changed; changes in character precede changes in trend. I was able to wait a bit with CAT and get out at a better price, but I don't like what I've seen.

 The 60 min 3C chart gave several reasons to short CAT and at the time multiple other timeframes were used to confirm the trade, however again we have a positive divergence with many other stocks at the July lows, this didn't present a problem, the fact there's no serious negative divergence at the top in CAT did. The fact this chart has a leading positive component now is a problem for me.


 The more detailed 30 min chart shows the July lows positive divergence which are fine, although a bit bigger than I'd expect to see, the lack of a strong negative divergence at the August highs again is a problem as is the current leading positive position of 3C.

 The 15 min chart with more detail shows no negative divergence at the August highs and a leading positive now just like the 30 and 60 min, I always take these charts (15, 30 and 60 min) serious, especially when they confirm each other.

 The 5 min chart confirms as well, 4 timeframes, not good probabilities for remaining short.

 CAT also broke below support on increased volume, that means those shares are there for smart money to pick up on the cheap without arousing any suspicion as someone has to take the other side of the trade, in effect, it becomes a had fake, but bullish and allows accumulation which 3C seems to be telling us is happening.

Looking at a shorter term chart to confirm the last 2 days action (yesterday and today)...
 The 1 min chart did exactly what I'd expect to see, it went from a relative positive divergence at support to a leading positive divergence below support as stops were hit and supply became plentiful at cheap prices. This may just be taking advantage of that supply, it may be something in the works for CAT we don't now about or it may be flat out wrong, but we have our edge and probabilities, I'm not arguing with either. I wouldn't short it here, thus I have no reason to hold the short here.

I will set alerts and keep an eye on CAT...
 If CAT breaks above resistance (as it hasn't made a lower low), then longs will step in on a higher high and the break of the downtrend, I'll look at what happens then and if there is distribution in to that move, I may re-enter CAT short at better prices with probabilities back on my side.

For now, it's been a good trade and I'll leave it at that.

Market Update

Most of the averages are pretty hum-drum today, I see a little intraday strength in the futures and I'm guessing we'll probably see some of that in to the close. Probably more than anything right now, the market is in a holding pattern to see what the ECB really does tomorrow.

Think about the trades out there like BIDU that you can take advantage of if we do get some quick upside.


CAT-

This is a first, since starting the core short positions in March-May 1, I haven't traded around any, I haven't covered any, I just added to BIDU, but I am going to cover CAT here. I'll bring you the charts, reason and plan moving forward.

Here's the gain in CAT.

A 23+% profit as CAT was shorted at $107.67 and will be covered here around $82.72.

BIDU May Still Offer an Opportunity

I can't be happier with the BIDU core short positioning, the multiple reversals and head fake moves in BIDU are textbook, except you won't find them in any textbook, this is the market and how it operates now. BIDU has offered so many opportunities and I still think there's another opportunity that is pretty good odds.

As a Core short BIDU is up 25% and it hasn't even really broken down yet, with the profits from the short I added to BIDU recently on this counter-trend rally BIDU just finished, that makes the trade worth even more as it is now paying for more shares, this is the real advantage of being short a stock rather than using an inverse/short/ultrashort or bear ETF/ETN. I explain it all right here at www.Trade-Guild.net under "Resources and Concepts" in the article, "Making More Than 100% In A Short".

I intend to keep pyramiding BIDU as the opportunities become available. However right now I'm looking for the next Put position as the last one was closed for a nice profit, I believe 102% which was entered on price strength (a breakout through resistance) on 8/16 while BIDU was up 2.74% on the day, making the Puts even cheaper, giving me a head fake move with good probabilities and lower risk.

 The price level I'm looking for hasn't changed, we need at least a higher high to get any kind of buying interest-the yellow area is where I need to see price at or above. There's a long legged candlestick on heavy volume providing support, if that support doesn't break, this trade can still happen.

 The short term intraday charts still have enough positive divergences to push to that level and maybe some, the longer term charts make shorting strength the highest probability trade for me.

 The initial core short position which has never been covered even for a day, was entered at the yellow box, actually I believe this position was built in several trades all in that area around $150, we already knew they were selling strength before entering, we just needed a price move up to make the entry low risk.

 We also had a long trade as we expected a counter trend  rally in BIDU at the July lows. The add to the core short was in the second yellow box and the 102% Put was at the yellow arrow, all shorting strength in price, weakness in 3C.

 The 4 hour chart shows all the moves from bearish to bullish to bearish again and leading negative here.

The daily chart shows the 2009 accumulation at the low to mid teens level, then the distribution of those accumulated shares over the 2011-2012 period, BIDU HASN'T EVEN TRULY BROKEN THE TOP, THERE'S INSANE DOWNSIDE POTENTIAL HERE.

So put BIDU on your radar as well for a possible put or maybe a short position with a price alert above the $121.50 level.

FB Update

As broad weakness is filtering through right now, there may be an opportunity for those interested in FB. VERY short term we may be able to get a bit of backing and filling in to the gap, I feel fine if that happens because it offers a solid entry point as the underlying trade continues to develop well today.

I can't say for sure we'll get the chance, but there is a gap and a 1 min divergence so the chances are decent to let this trade come to you.

 The 1 min chart is the only one with some weakness, this is an intraday timeframe so a pullback would make some sense as something to look for. We have to then decide if we want to buy the pullback, I don't have any problem with it, I actually see an opportunity there based on how other more important charts have progressed just today alone, not to mention the bigger picture.

 2 min is in line which is fine.

 3 min is leading positive

 5 min leading positive and most of this was added today!

 10 min leading positive

And a sharp leading positive divergence on a 15 min chart this quickly.

I'd set price alerts and consider FB if you can pick it up around the gap, there's no guarantee, but it's worth keeping on the radar for consideration.

Tech, Financials, Energy

Tech and Financials look like they continue to lose support, Energy however, while not giving a strong buy signal, is holding up a little better than "in line".

I'll have to take a closer look at individual components, but my guess is there may be some fear of inflation in Energy ahead of the ECB tomorrow. USO looks similar.

 Energy is pretty much in line -2 min


 3 min is a bit better than in line, but not a high probability signal

 5 min is close to in line. Perhaps the sector is waiting to see the fine print tomorrow with all of the inflationary talk today and I believe gas hit a new historical high today.

 Financials look much different, there's clear deterioration here.

 The same here as there has been in the past on this chart.

 3 min showing even more, this is not something new, more of a trend.

 The 5 min leaking off badly.

 Tech is seeing weakness today as well in underlying trade.

Tech 3 min
 I think I already showed you this chart today

FB is holding up pretty well thus far considering the sector's looks, +5% now

Risk Assets

 Commodities are coming undone the last couple of days, but the next chart is really scary.

 Right now the Central banks sort of have their hands tied because of food and energy inflation, the ISM for the US showed that companies have fewer orders and are paying more for input costs, a margin squeeze and look at how displaced commodities are right now vs the SPX, in white this is what happens when easing like QE2 comes in to the market, if we are this bad with manufacturing and gas/food inflation, can you imagine if commodities took off on another tear like 2010? This is why in my opinion, Bernie at Jackson Hole last week kicked it back to Congress, their hands are ties, another round of QE could send inflation through the roof and if we are seeing 80% of the world's manufacturing in contraction now, just imagine what easing would do. This is why I pointed out the German remarks today on bond buying causing inflation, it's very sensitive.

 Yields again, more dislocated than ever, note the last divergence and the reversion to the mean.

 The $AUD today not doing much...

 Over the last couple of months, a recent collapse in the leading indicator currency.

 Again if you didn't look at price trends and only indicators, this looks like a bear market rally, the broader, but less sharp divergence in the $AUD at the top to the left and the sharper, deeper dislocation now of a bear market rally which reverse much more quickly.

 The Euro and SPX today...

 The EUR/USD since this week's open and last Friday, we are at a level of resistance.

 As mentioned yesterday, HY Corp. Credit has made had fake moves before that reversed sharply to the downside, just several months ago we saw that, this looks very similar with a bear flag type formation in credit.

The same in High Yield Junk Credit.