Thursday, June 27, 2013

After Market Wrap

I'll post several charts from the averages and from the Index futures to try to give you some flavor of what we're dealing with, don't worry if all the timeframes aren't exactly the same or signal, the point is the general theme is there and it's really not a question of the move up we expected (and so far have started) giving out early, I think it's pretty clear it has more upside to go, in fact I think it has barely started.

First those charts.

 Most of the averages as reported this morning did not confirm the opening gap as you can see in the SPY 1 min on the open.

OK, I know I've pointed this out several times already, but the degree to which this prediction was accurate is amazing and in my view it tells us a lot about how rigged the game really is.

Going back 1 more time to my email from Saturday with a member...

The question or discussion was about "potential catalysts" that would send the market higher, a number of ideas were rattled off and my response was the following:

"That's the obvious stuff, but I wouldn't be surprised if the F_E_D let a rumor slip, picked up by the WSJ that helps, remember they have a lot closer relationship than they disclose as evidenced by the minutes being emailed to 154 trading firms over a day early. They'd rather see them make money in the market than have to bail them out."

It seems even I lacked imagination, but was darn close. Instead of Hilsenrath rumors in the WSJ, we had 3 F_E_D Hawks come out and speak as of yesterday all calming the market and hinting that QE tapering is not as close as people think, short term rates aren't going to rise that fast (all of this is the opposite of what was actually said by the F_O_M_C). 

Then today at 10 a.m. we had the F_E_D's Dudley saying the same thing, hinting that QE tapering is not that close because the economy is still soft and rate hikes are a long way off.

At 10:30 this morning the F_E_D's (and F_O_M_C voting member) Jerome Powell, who says 2014 is the end date, but current data is mixed so QE tapering is still up in the air and no imminent, keep in mind none came right out and said it (they can't really), but they hinted enough that we got the message, but still left a lot of room for plausible deniability.

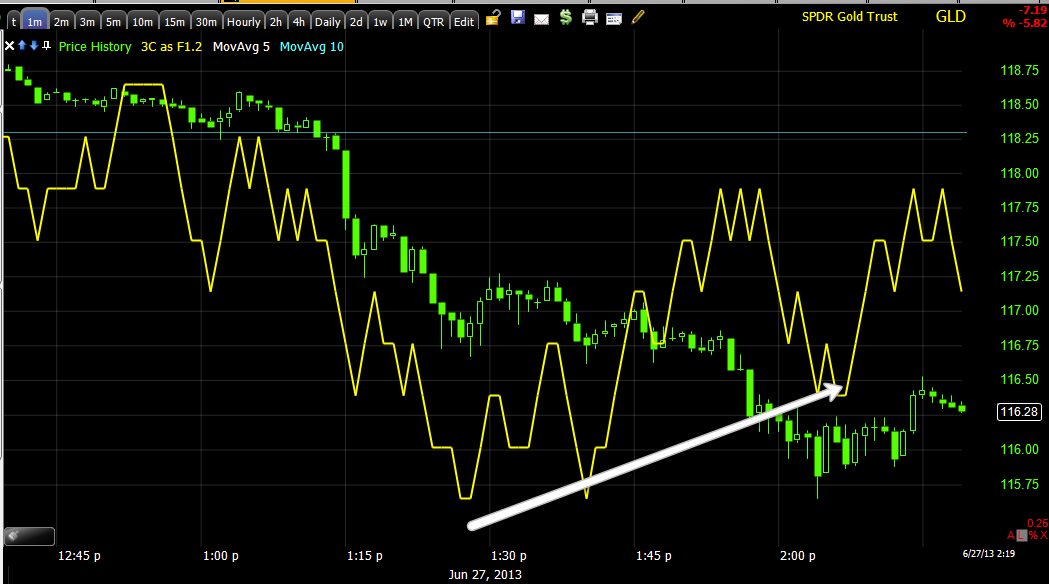
Then Lochhart at 12:30 was a bit more neutral, but still said that QE tapering was economic dependent, by that time as you can see above, 3C improved on the 1 min chart or intraday charts and jumped in to line with the gap up (seen to the right in the green box).


 The 5 min chart suggests that the distribution I talked about last night in the short term is there and it's probably enough to create a pullback or correction which would actually help our case as retail is clearly bearish and already shorting the market today, if you give them some price confirmation they'll be all over the market short. This is helpful because it gives us a better short squeeze at higher prices (like the "Slow boiling the frog " concept from yesterday).

 The 15 min SPY is showing what is clearly in my view, distribution in to higher prices including institutional short selling, but I do not think this the end of the move.

The SPY 30 min is leading, it's still strong, it suggests to me if we do get a pullback that it will just be noise (we can probably open some decent trades on the movement), but this strong 30 min chart tells me the real move, the real pendulum effect, the real emotional movement the market seeks to create hasn't even started as we are barely even out of the base, much less the mark-up area.


Although I didn't think the market would need it because I thought a short squeeze was more important, I estimated the basing area to need about 4 days, well the market figured out a way to keep the shorts involved and the basing period was exactly 4-days. How did I know this? An indicator? A lucky guess? No, simply looking at the character of price action, the size of the preceding move, historical price action and basically a sense of symmetry or scale (Neither are really the right word), "Proportionate" is a better adjective.


This isn't the best "artist's rendering", but imagine if the base was shorter like this, does that have a look of symmetry to it, does it have a look of the normal SPX character? Does it appear to be a big enough base to support a strong move to the upside? To me it looks more "V" or event than "U or W" for the basing process. This would be about as tight as the last pullback and base which was a much smaller pullback (between the two trendlines)  and a smaller run. The size of the base is directly proportional to the size of the move it can support.

Here's the actual base and today's breakout, for bears, this is the perfect area of overhead resistance that they'd assume the market would not be able to overcome, but for me, it's barely even the start of the 4 stages of any trend (base, mark-up, distribution, decline). 

The price pattern's measured move/ target implication based on what's there now without accounting for increased volatility is around $1660, which would be a break out and traders would turn bullish (they are fickle) and start chasing this new Technical move.

If we assume the minimum measured move and then add volatility and perception shift to the bullish side, we could certainly have a move toward a new high, although the May 22 Key Reversal Day should be strong resistance. Wall Street rarely does anything without a reason and they aren't likely to bounce the market without really getting something or the effort.

The QQQ today
 The intraday chart is the same as the SPY, no confirmation on the open, around 11:30 or so 3C improved and the Q's too saw confirmation, it's clear that the 6  F_E_D speakers this week so far had an effect and specifically the three today changed market underlying action from negative to at least in line. 

The QQQ 15 min, like the SPY shows distribution in to the most recent area of the move today, distribution is something that is happening, it's expected, it's the reason for the move, but it's not a signal for the end of a move by itself.

Like the SPY, the 30 min chart holds the promise of a lot more upside, despite any pullback/correction which I believe will be fairly strong if we get it, maybe a -1.5 to -2% move because it needs to pull the shorts in and get them frenzied, but as I have maintained since last night, I believe it's no more than trend noise.

 IWM 1 min didn't confirm on the open, but improved after the 3 F_E_D speakers today.

 The 10 min chart showing distribution in to today's move which I think saw a short squeeze in the IWM, maybe not a historic one, but a squeeze.

IWM 15 min holds a lot more gas in the tank.

ES...
 Like the market averages, ES had difficulty confirming the early action, then saw strength come in as a result os the 3 speakers today, after it had already started deteriorating badly. We ended the day in line and since the close we have seen some negative momentum in 3C.

The 5 min Es chart is nearly perfectly in line, but like the averages, the 15 min above shows there has been some distribution in to the last several days of price strength.

Not only the ES 30 min chart, but the 60 min above and the 2 hour are all leading positive and very strong.

All of these charts share one thing for sure, they all have plenty of positive activity to take the market WAY higher. The next thing I'd say is they've all seen recent distribution, perhaps they had no problem with that because they expect a pullback and a move higher so if they can sell in to some strength, why not if you already know what's coming next?

As I said earlier, there is a chance a short squeeze just takes hold and there's no looking back, but that does not seem to be the optimal use of resources for Wall St. to get the most constructive move possible. It would be my opinion that if we didn't get a pullback and skipped right to a short squeeze, that it likely was not the intention or original plan.

*Furthermore, tomorrow an op-ex Friday so perhaps a pullback lines up and works perfectly with an op-ex max pain market pin???

As far as the TICK data goes, we had a 3rd (or was this the 4th?) very strange day of data, no trends, just lateral chop and I'd never expect this from a  market that gained +.95%, +.96% and +.65%.

No trend at all, but a bias to the upside as we see +1000-  to +1250 on the upside and mostly -500 to -750 on the lower end.

I mentioned some charts that look very much like shorts, but only after they finish a move higher. I'll be covering these as they get close to a decent range, (look at AMZN, we expected +4282.50, we waited patiently, we got the area we wanted and even with 3 days of market gains, AMZN is still a profitable short, it's all about getting in at the right area).

GS is one example...
 GS 15 min from in line downtrend to distribution on a bounce/rally to accumulation on the pullback. GS not only looks like it wants to move higher (which it would have a real hard time doing if the market were heading in a different direction), but with a chart like that open, I wouldn't short GS until that signal was resolved on the upside.

However the 3 min GS chart looks like it clearly wants to pullback near term doesn't it?

 IOC is one of my favorite shorts, I closed it earlier this week for more than a 20% gain and it hardly moved, but this 60 min chart looks like I'll be able to open a short at much better prices.

However on the 10 min it looks like it wants to pullback first.

There are dozens of these among my favorite shorts. 

Before I used 3C, I had a great way of forecasting the market, it took a lot of work, but similar to what we have above... I'd look at something around 500 charts a night, I can look at about two charts in 5 seconds, I just flipped right through them.

If I found there were a lot more short set ups I knew the market was coming down and vice-versa, this is sort of the same concept.

Take a look at VXX and UVXY which move opposite the market...
 VXX 1 min

UVXY 5 min.

Do you see why I closed the VXX put today and took decent profits from the UVXY short?


UVXY 10 min

VXX 10 min

And can you see now why I CLEARLY believe we are headed for a significant move to the upside?

Finally, because I don't think I can make the case any clearer with the data we have, HYG, High Yield Credit, Smart Money's risk asset of choice, if HYG is moving up, you can be nearly guaranteed the market is following because Credit and Bond traders are a lot better informed than equity traders just because it's such a huge market compared to even stocks.

 This is the HYG 5 min chart showing some distribution late today, if I posted the 1-3 min. charts they'd look exactly like the SPY, the same forces moved HYG intraday.

However no matter what kind of pullback, it almost doesn't matter to me if it made a new low below the base, with a 30 min. Leading positive HYG divergence, I feel more than assured that we will see such a strong upside market move that for our purposes of going short, I'll consider it a gift, but I can almost guarantee that some members will be frightened to short a market that looks as strong as this 30 min chart is telegraphing. Just remember I said that when the time comes.

It's always easy to make a plan when nothing has happened, but like I said last night, "Every boxer has a fight plan until the first punch is thrown".

My point is, EXPECT a monster strong move, but remember it's a gift, it's a means to an end.

I'll check back in on futures in a bit.


Sentiment

I want to thank so many of you for doing things I don't have time to do, monitoring retail sentiment through the groups and Twitter/StockTwits, give me a head's up to an interesting stock, etc.

One of the most active contributors of sentiment information is Sam for Canada (Eh?)  who has done an amazing job sending me the actual posts from mini-leaders i the twitter community and examples of the overwhelming tone.

The overwhelming tone today is not surprising, it is VERY bearish from retail's perspective. If I posted half of what Sam sent in, I'd have a 3 page post here. The point is, this is good, it's exactly what we expected. I expected certain moves by Wall Street to be facilitated by retail positioning and certain moves by retail to be facilitated by Wall Street's actions.

As to be a bit more clear, here are a couple of real life possibilities.

Retail has a lot of reasons to want to be short here. The truth is there's so much data in the market that anyone can justify any position they want to take, this is why objective analysis is so important and requires that you check yourself often to make sure you are not goal-seeking data, this is a good reason why I don't listen to CNBC, I never have it on, except when I want to hear the F_O_M_C statements.

If we stick with last night's analysis of a short term pullback or market correction, this facilitates retail entering short positions for 1 simple reason, they love price confirmation, they'd rather chase price lower and have that confirmation than enter closer to a reasonable stop. A short term market pullback gives shorts that opportunity to fill up short.

Wall St. needs retail to be short, why? If we are to get an unreasonably large move to the upside which Wall Street can use for exiting long exposure, entering short positions, etc. They'll need to see a short squeeze, otherwise they have to invest money in puts and stocks , etc to create an image that creates the same outcome, why pay for it when you  can have retail do it for you.

One other example is on a short squeeze, Wall St. moves tend to be very strong, emotional, convincing and can turn even the most level-headed trader with tons of objective data in to an emotional basket case making all decisions on an emotional, subjective basis. With this kind of strong move along with some other things that have happened this week (the very strong move up is not there yet, but started), Wall St. can change sentiment from bearish to bullish, retail is very fickle and will switch opinions in a day if the move is convincing enough. 

Now we have retail believing the market is going up because it has already made this spectacular move, everyone following objective data knows this isn't true, but we are talking about emotion, not objectivity.

Once retail buys it, literally and prices start to come down, retail is at a loss and again emotional. This creates a snow ball effect of selling that drops the market so fast it can make your head spin and it can make Wall St. a lot of money with really no investment to speak of in creating the catalyst.

So we have a few questions, but it doesn't change much. I'll try to give you a clearer picture and probabilities.

My Take

I can't get all the charts out to make the case right now and the difference between option 1 or 2 is subtle.

As far as I've been concerned, the market looks  like a short term downside correction would take place and then it would resume the upside move and that would eventually end, it would be during this stage that we'd be selling long positions (speculative ones) and starting or rather finishing the process of establishing or filling out mostly core short positions, a few longs here and there.

The other possibility is that the signals today that look like a short term pullback are distribution of higher prices and the market instead of making a correction and moving higher, essentially has made a correction through time this afternoon (lateral trade) and it continues higher as the divergences get worse.

Either way, the difference is really a matter of whether there's a short term correction, one I'm not too excited to try to trade.

I'll show you what I see later, after the close.

I'm still leaning toward the initial plan/idea for several reasons, but one is there are several potential or current shorts, GS is a good example that look like they still have a powerful upside move to make before they are ready to rollover and the other is that I have expected the market to make a powerful upside move, one that scares not only the shorts, but makes the longs feel like they missed the boat and were wrong not to buy the dip.

Either way, I do think the market will make a stronger, more emotional upside move.

Where we are right now, retail is not scared, they are shorting the market, they think this is a great place to do that and usually the market will allow them to think that and give them some downside as many won't enter the trade without price confirmation, so again, I still think the original idea is more probable, but I had to lay out the other which also relies on the idea from yesterday about "Slow boiling the frog" and essentially keeping the shorts in as long as possible on smaller upside moves until they can execute a short squeeze at higher price levels rather than lower one.


ERY Long

If you are open to a short term trade along the lines of the market move I talked about last night and talked about in many posts today including the VXX/UVXY post, you might consider  ERY long, a 3x Bear Energy ETF), again I consider it to be a speculative and short term trade (possibly a day, maybe 2, I wouldn't expect much more than that and I'd prefer not to use XLE put options, I'd prefer the leveraged, but less leveraged ERY long).


VXX / UVXY (Short Term VIX Futures)

If there's a bid under VIX futures, then we'll see it first as a positive divergence in VXX or the leveraged version, UVXY, the bid in VIX futures is a move to protection, not quite the same as a "Safe haven trade", but similar concept at the same time, when the market is expected to see some downside which I warned of last night.

First the P/L of UVXY short (because XIV long wouldn't have the leverage)


At the $72.96 fill, the P/L was for a gain of +8.9%

 VXX and UVXY are essentially the same except UVXY is a leveraged ETF. VXX 1 min is showing signs of accumulation, it is even showing signs of what is either a purposeful ahead fake move below the yellow trendline or that may have just been the market reaction to F_E_D speak today, either way both areas saw positive activity.


UVXY 1 min is direct confirmation of the positive activity as price broke under the yellow line, head fake or just a move in the market intraday, the results are the same.

VXX 2 min is seeing migration, I'd think that a little more of a "process" would occur before an upside VXX reversal and a downside market reversal as mentioned last night. I still don't see anything so far that changes last night's analysis of the downside move being anything more than noise and the move to the upside continuing after the correction is complete.

 VXX 3 min shows visually what I just said above,

" I still don't see anything so far that changes last night's analysis of the downside move (*in the broader stock market) being anything more than noise and the move to the upside continuing after the correction is complete."

The negative tone of the VXX 3 min chart is visual confirmation of that statement,

UVXY 5 min relative positive, still I'd think there would be more of a lateral process, but if this is truly just a short downside market correction, then there's really no need for much of a reversal process.

UVXY 10 min gives us a picture perfect representation of a leading negative divergence. Note price is at nearly the same level at "1" and "2", however note 3C's position at "1" and then note its position at #2, it is not just lower (which could be a relative divergence, not as strong), but it is leading below price significantly, this is the strongest divergence (leading). Beyond 1 & 2 3C is even leading the UVXY lows.

This suggests that there's still some more UVXY downside after a correction which would mean there's more market upside as I have expected.

A long UVXY or VXX position could be considered here, I may, I probably won't consider options, it depends on whether I  think I have time, whether it will distract me from the bigger picture, etc. However your position may be different, you may have plenty of time and want to make a few extra points.

 I wanted to show you this, intraday form 1-3 minutes a lot has happened today and continues, so my advice in reading 3C with this situation is to move to a longer term chart until a trend becomes evident, at the 5 min SPY chart a trend is becoming evident, from upside confirmation to the negative divegrence I spoke of last night. ***This also goes to the issue of confirming signals in VXX and UVXY as they trade opposite the SPY

SPY 5 min

I'll be Closing the UVXY Short

That means VXX and UVXY are likely to rise at least in the very near term and as expected last night, the market to pullback in the same period.


I'm considering a UVXY long, I'm not sure if I'll have the time, it would be a short term trade and probably worthwhile.

I'll have charts soon

USO Update and P&L


At the $2.07 fill, the P/L for the USO July $132.50 calls comes to a gain of  + 27%

(I will likely stick with the bulk of positions entered for this move, but I really want to start clearing out these shorter term positions and put more of my attention to the prize, that means spending more time on the core positions for the highest probability trend, which should follow the upside trend we are playing the last week or so (the one I have described as us "hitch-hiking on" and it being a means to an end).


 USO 15 min is a PERFECT example of a head fake move, there's clear resistance, USO is run above that resistance forcing weak shorts to cover, pulling in some longs and this was the last thing to happen before USO reversed to the downside from an otherwise rangebound lateral trend, this is a great example of a head fake move.

The 15 min chart doesn't look great so if I were to consider opening a new call, I'd have to have something just unbelievable considering the chart and my focus.


 USO 5 min moving from up trend confirmation (green arrow to the left) to a perfect example of a leading negative divergence in the red box, even price is a good example of a flat area where the divergence developed. Next in white a leading positive divergence, it's about two days so it's not going to support a large upside move, all of these indications are hints of what to expect, the size of the divergence, the longer 15 min chart, the length of the divergence or reversal process, etc.

Finally we have an in line/confirmation move up right now, but as you know, any new divergence like distribution of this trend, will start at the earliest / fastest charts and if strong enough, migrate across longer timeframes.


 This is the 1 min, the earliest, fastest 3C chart, clearly leading negative intraday with a flat range that helps confirm the divergence.

 That 1 min chart has some strength as it has migrated to the next timeframe at 2 mins, again before this we had confirmation with 3C and price, then a flat range and a distribution signal. I see no reason to hold an asset with as much leverage as an options with time decay as well at this point.

Finally the 3 min shows the positive divergence, note it isn't that big, it isn't leading, the uptrend is about what you'd expect for the size of the accumulation. We have confirmation at the green arrow and now migration of the negative divergence to the 3 min chart. AS or if this gets stronger, it will move to the 5 min chart next.

SLV Update

SLV is still the more advanced of it and GLD, but I suspect GLD had some more to overcome and appears to have a later start. SLV is now back above the support area broken (yesterday's close)

The green arrow is the stop run, it's yesterday's close for SLV. The 3C chart continues to improve, it's still not what I'd like to have brought out as the first chart, but it is what it is, not what I'd have it be.

USO update is coming and the market update is coming as well.

I'd consider positions in SLV, GLD or GDX/NUGT long, whether partial, whether ETFs or options, but because of the shorter term nature expectations of the move, I'd of course consider it speculative, but at this point in the market with this volatility, I think anything other than core positions are speculative and risk management should reflect that.

Have to Take USO July $32,50 Calls off the table

I'm certain I'll be back looking at USO calls, if I had a less leveraged position I may let it ride, but not with these calls with the short term USO signals. I'll try to post those as well.

GLD and Especially SLV are starting

They are starting to give that confirmation I was waiting to see, SLV is more advanced than GLD, but it does take 3C about 20 bars to catch up (figure a 1 min chart, that's about 20 mins).

NUGT / GDX are also looking good here.

I was hoping that I'd have more developed signals before putting this post up and I'll keep watching.

I'm also interested in the market, I thing it comes down as expected, the TICK is AGAIN trendless.

I think it's time to look at some other assets, support/bellwether assets

 GLD 1 min

SLV  1 min

GDX-Gold miners 1 min

HUGT 3x leveraged long GDX/Gold miners.

Both GG and SLW just lifted vertically....

GLD & SLV & Fractals

I'll try to make this quick, most of you have heard me refer to the market as "Fractal" meaning the same concepts that apply to a intraday chart will apply to a daily chart, the same concepts that apply to a 1 hour long price pattern will apply to a 8 month long similar price pattern. The reason we see this and if you look around you will see it, I believe is 100% because human nature doesn't change. The fear or greed in an investment length position are the same as a swing trade or a day trade, emotions and  sentiment (which are often indistinguishable) move the market, that's the one honest thing I think Cramer said in his Wall St. Confidential video with Aaron Task in which he admitted the many ways he manipulated the market as a hedge fund manager and how rampant it is to the point that he says, "If you aren't willing to do it, you shouldn't be in the game". The video is harder and harder to find,m but it's out there and that's the most useful and honest Cramer has ever been.

In any case as it relates to head fake moves being some of the last events we see before a reversal (the reasons why are spelled out in the two articles I already mentioned earlier today) and thus make for a good timing marker (this of course is subjective to the timeframe you are trading), both GLD and SLV look to be high probability head fake moves, I've wanted a little more confirmation, before possibly bringing them up for consideration, but so far one of the first things that is noticeable is SLW -Silver Wheaton vs SLV and ion gold's side, GG (Gold Corp) vs GLD.

Of course there are other indications that are more direct and important to me. If we get the confirmation as I suspect, it will be a hard position to enter, but at a great price point, actually lower risk as your stop can be just below intraday lows and if I confirm and I bring it up, the probabilities will be high as well.

 GLD, the reasons for a head fake move are there, evident in volume, again the concept is scalable or fractal in nature for the same reasons in any timeframe.


The same in SLV

 Here's Gold Corp in green vs. GLD in red, there's obvious better relative performance in GC and thus a divergence between the two.

And SLW in green vs SLV in red, again better relative performance in SLW and thus a divergence between those two (relative performance).

I need to watch because if it does as I expect, it will happen quickly.