The market right now looks truly confused. The only real relationship with the dollar is a directional bias, at least for the start of the trading day. The market has not fallen at all to the degree the dollar has gained, this could be due to many things. However I suspect it has something to do with the devaluation of the dollar as money is printed, it loses value. However, there's an alternate universe playing out in which the dollar is gaining on the Euro. So while it seems the dollar is stronger, it's really just the Euro is weaker. Truthfully the dollar is weaker as well. You can not print more dollars and put them into circulation and expect what was there before the printing to be worth the same. Add to that fractional reserve banking and Federal reserve manipulated inflation, and I can see why the dollar is unhinging from past relationships. I can not adequately do the topic justice, but think about when we really started to notice this? About the same time the Fed embarked on its POMO and the correlation issue seems to be worse as the Fed pumps more money into our fractional reserve banking system and the money multiplier effect is created within the banking system.
I may be wrong, but the timing and the extent of which the correlation has deteriorated seems to be about the same time and on the same scale as the Fed's market operations. As I said, I'm not qualified to give an exhaustive explanation, maybe some of our members that have more knowledge about this can consider it and get back to me with their thoughts which I'll share with you.
However, the disconnect between other historical market correlations don't stop with the dollar. Gold has long been a safe haven investment, it's somewhat rare to see a market rally while at the same time there's a flight to safety in tangible assets, most typically precious metals such as gold. This suggests to me that the rally of the last several months has been a sham perpetuated by the Fed Permanent Open Market Operations. The market rises and so do safe haven investments.
During the Dot.com craze, you can see not a perfectly inverse relationship, but it's obvious money was flowing into the market while the XAU Gold/Silver index saw selling.
As we look at the recent rally...
There's very little inverse correlation. Partly this must be due to the sentiment toward gold, but I wonder how much of it has to do with the market understanding this rally for the most part was engineered by the Fed and therefore is not a representation of value or price discovery, just a manipulated rally in which primary dealers and the Fed sent money into a select few stocks that would have the greatest influence on the upward trajectory of the market averages. I've showed you plenty of breadth charts showing fewer stocks participating in the rally; to me I view this as a manipulated market and the gold buyers may very well have seen the same thing, thus a flight to safety.
I'm thinking out loud here, but it's something for each of us to consider. 3C has been pretty consistent in it's negative divergences through out this rally, which blends with what we know about a lot of capital flows in and many out of the market. Insider selling is one of the most overlooked and important. This hasn't been a wishy washy trend that a perma-bear can point to as a problem, it's been solid as has been the 30 consecutive weeks of outflows from domestic equity funds. A bull may see this as sidelined money that could be deployed in the market at sometime in the near future, but I'm betting it is based and rooted solidly in redemptions. The fact that we see the money managers on CNBC the last week of the quarter talking about “Buy, buy, buy” backs up this notion as they desperately try to keep more redemptions from hitting their fund. In other words, funds are going into cash, they are selling stock in forced customer redemptions.
The Fed has had to have seen this trend coming. Without any action from the Fed, the net result would most likely have been a market with more supply then demand and a number of funds/banks, etc being put into positions of liquidity crunches, which would require more bailouts as that sentiment feeds on itself. I think they learned that lesson once and didn't want to be in the very unpopular position of using tax payer money to bailout more funds and investment banks. So we get an engineered Fed rally-it's not the first time.
POMO part 2 changed...
3C has shown consistently distribution-which certainly could include forced redemptions, the rally only saw a few brief periods of accumulation and that was at the start of the rally. I personally believe Wall Street was thrown a life-line and they knew about it in advance. However, the situation can't go on forever and the new POMO regime has shown that it is very different then the last. Which leads me to believe that we may be seeing the last hurrah if we haven't already before the market slides as it has already started. The Fed's mission at this point is to try to keep the decline orderly.
DIA which actually saw 3C hit the lows of the day during the afternoon ramp job.
Unlike the SPY above which did see a bit of accumulation that didn't lead too far, the DIA showed nothing but confirmation all day, no positive divergences to speak of, just a really bad negative one into the rally.
The Q's showed a very brief and small positive divergence, but nothing like we normally see everyday where there are multiple divergences that preceded the intraday ups and downs. Certainly the negative divergence was the biggest event and considering where it occurred, a suspicious one at that.
And why the afternoon pump? Again, I believe it is to try to facilitate an orderly decline. Looking at the DOW-30, it was not in a good spot to risk closing toward the lows of the day.

The channel is clearly broken, volume is up, MACD shows the loss of upside momentum, but that's clear in price itself and the support of the nearly 2 week consolidation rectangle was pierced intraday. First remember that a rectangle as a consolidation pattern (volume should decline in a consolidation pattern as it does here) has no inherent bias like some bullish/bearish consolidations. A rectangle's bias is determined by the preceding move which was a break down out of the channel, so you could certainly be given some space for assuming that the consolidation pattern is a bearish continuation pattern and a break below support and the psychologically important $11,000 level would risk a high volume break down. Our lows in the Dow were $10,929 so $11k was broken, had it been broken on the close, it's very likely the next leg down would begin.
As you can see, the S&P was in a similar situation although it did manage to hold support today.

The NASDAQ is in a little different situation, but equally if not more bearish as the flag pattern it is currently in does have an inherent bias, it's bearish and the NASDAQ 100 was also testing support. A break in the Dow below $11k would most certainly pull the S&P and the NASDAQ down through their respective support levels. I've said and we have seen, on too many occasions to count, that traders in trying to be stringent risk managers and follow the precepts of technical analysis seem to never learn that putting stops at support levels is a horrible tactic that just leads to them being stopped out, even in bullish situations. The powers that be know this and the bottom line is if these support levels were breached by a few cents, the stop limit orders would have kicked in and we'd see a mass volume sell-off through support. Please do not do what these people do and place stops right at support. Support is an area, but all too often you hear technicians talking about support and resistance in exact terms, such as $1172.99. The entire concept of why support and resistance levels appear on charts is all about human emotion, thus these levels are not exact numbers but areas in reality, but in stop order practice, they are exact numbers and this is why so many people get their stops run in a trade they would have otherwise have been correct about. This is why I encourage stops to be placed in areas that are not obvious, never with your broker if you can help it and a bit wider initially then you'd normally put your stop. This exact number support is a decades old mentality and it amazes me that the experience of having your stop run over and over again has not taught traders to adjust, it's easy more for Wall Street. However today, it may have led to a blood bath.
Back to GLD and SLV. Today is the first time I've placed an actual trade on the list for gold and it is a limit order trade, so it needs to “show me” before it is triggered. I'm mystified by the action in GLD, a bit less mystified in SLV. However, a trade is a trade, with good risk management there's no reason you can't try it, even if it ends up wrong.


To me, the above charts do not look good. However, I'm going to tell you something I've learned about trading, it's ok to be wrong. If you have and stick with risk management, you can be wrong, and you can be wrong more then you are right and still make money. If you don't take trades that look good to you, you will never get anywhere. You are paid to take risks, the thing that helps you get ahead is to take the risks when the odds are in your favor, to use risk management so a loss is easy to take while it's small and doesn't put you in a position of stress. Finally realize that if you take too big of a risk, too often you will not succeed. People do this because they want instant gratification, they want to beat the market and they want quick profits. Slow and steady is the way to win the marathon. Note I specifically used the word marathon instead of race. Quick money can be made, many people do. Go back and visit those people in 5 years and see if they're still trading. There's a time and a place to increase your position and risk and that's when the odds are dramatically in your favor and you are in tune with the market. However, knowing when to decrease your risk profile is what will allow you to make money over the long haul and being consistent with risk management. Once you dig yourself a hole, human nature is to dig faster and harder until you get to the point that your portfolio is so seriously damaged that you resort to “Hail Marys”. Like a good baseball batter, know which pitch to swing at and understand that a batting average of 40% is pretty darn good and yes, you can make good money at 40% although I hope that we can do better, ultimately it's your risk management that will give you your World Cup.
Ever once in awhile I have to say the above because we all need to hear it.
Back to the market for a bit.
So we are not seeing the normal correlations, this is not even close to a normal time. In the commodity markets, margins are being hiked. I had a friend who was a commodities broker and he swore that 90% of his clients were degenerate gamblers. However that may not be the case on an institutional basis, although we have seen examples of a few brilliant traders take their companies down with a couple of bad trades that had no risk management. When you get into the big leagues of commodities and currency trading, these people are using extreme leverage so the recent hikes in margin requirements are a serious issue for these traders.
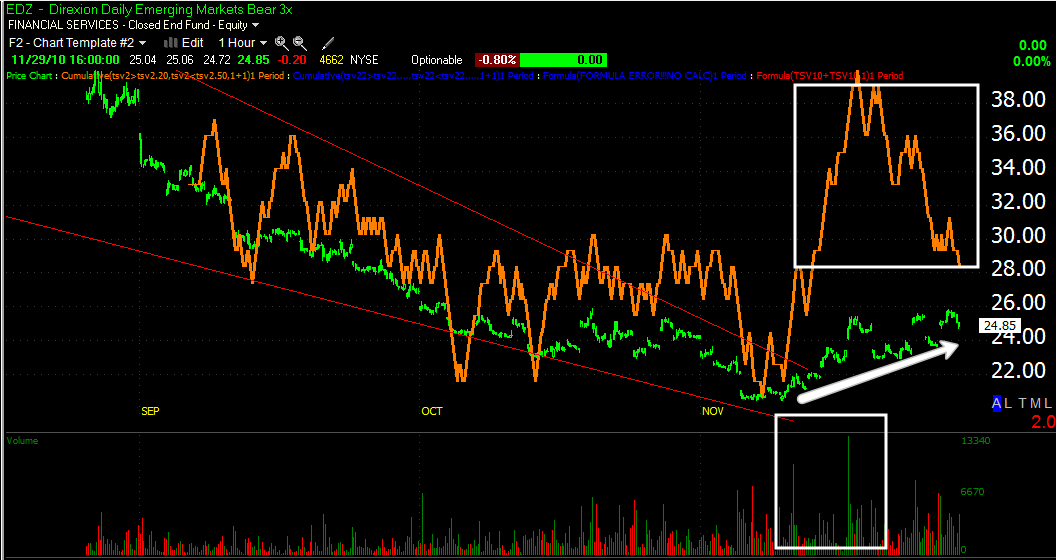
China and many other less developed or emerging markets are putting price controls in place as “hot money” seeks higher returns. These countries don't want it, what this hot money represents is inflation an bubbles so they are taking steps to curb it and China is on the edge of a rate hike and fiscal/monetary tightening. These have been the trades that have peppered the talking head's programs and interestingly to me, we have a chart like this...
This is a bearish ETF which is short Emerging Markets, it has a bullish wedge pattern that has broken out to the upside (trend reversal) on good volume and a nice looking 3C chart. It loss to me like the hype in E.M. Is being sold into. It's hot money (supposedly) vs. these government's ability and need to protect their own economies.
We also have a lot of exposed lies coming out of every corner of the earth, but the most relevant right now are those in Europe, where 6 weeks ago or so, all was fine and the worst was behind them. What is really going on is what has been most feared the risk of “contagion”. We see it nearly every day with the bond auctions commanding higher interest rates to lure in buyers. These interest rates, much like the rate the Irish received in their bailout package are expensive and there's a real fear of these countries not being able to service the debt. Why do you think our own Federal Reserve is the biggest holder of bonds now? It's because the demand at our auctions was diminishing, pushing up interest rates on our bonds (debt). So while the Fed has stated it's reasons for QE2, we can't forget what our own bond market was looking like and still looks like with the lack of direct bidders, so the Fed has stepped in to buy them. The proof of the fears that European countries can not service their debt is seen nearly every day with the CDS going higher. Credit Default Swaps are nothing but insurance should a country default on it's debt and that insurance in Europe is becoming more expensive every day.
What started as fears of contagion in what is termed, “The Periphery” just a few short weeks ago, has now started in the core E.U. Countries such as Germany. So the “Bond Vigilantes” are making it difficult if not impossible for countries like Ireland, Portugal and Spain to go out into the market and raise cash with their bond offerings because they simply can not afford to borrow at those rates. So what happens next, bailouts. This distrust in the E.U.'s ability to service debt and get past contagion is seen very easily every day by watching the value of the Euro plummet.
Here's another recent trade idea...
This is an Ultrashort 2x leveraged bear bet against the Euro and it's got a great 3C leading divergence and has changed trend.
Or....
This is a daily chart and it just broke its 200 day moving average. Currencies trend better then stocks so this reversal is important . I think when we see a break of $1.30, we'll see real selling in the Euro, despite GS lofty targets they set, I think $1.54? We're at $1.3126 now, not too far.
So Portugal, Spain, Italy, Belgium and Germany are seeing concerns set in. We cold be looking at the collapse of the EU. If Spain needs to be bailed out, the EU emergency lending mechanism will be broke without adding significant funds to it and politically, many of the core countries are not in the mood to finance other country's debts. Watch for this to escalate rapidly and you'll probably see a lot of news reels that make protests at the IMF look like a family picnic. This situation could end up being more volatile then we can presently imagine or speak of without sounding like nutcase alarmists.
North Korea is coming to a head, both internationally and apparently domestically. Coupe? Maybe. The south's leadership is under heavy domestic pressure to take a stand. “When the missiles fly it's time to buy” may not hold up in the Korean situation because it has so many ramifications an is so unpredictable. Keep your eye on the news. I also added a short on China for more then one reason.
Finally, the US. I'm sure the politicians are happy with all the other distractions around the world, but there's change coming here. Real Estate (which I've added a short on) looks a lot like the second shoe is about to drop and apparently for the first time, Wikileaks is going after a MAJOR US Bank. I'll be watching 3C for signs of who this might be, but with the Attorney General entering the banking scandals today, things are getting hot. Remember that much of the bailout funds that have been needed by European nations are to stabilize their banking system. I think that's what the Fed has been trying to do in advance with POMO and QE, but will it be enough and what will money mean when these lawsuits and criminal charges start piling up? Unemployment isn't really getting any better and just from my own perspective with the family business, I can tell you that there are a couple of people who were making money in the area of $40-$60k a year. I don't want to get too personal, but they are now working for minimum wage or just slightly above and part time at that! Just six months ago we were staffed with young college kids, that needed part time hours and beer money, now we are staffed with corporate managers and architects. So despite the jobs numbers I can tell you from the ground floor, things aren't getting better and this is in one of the most affluent cities in the country! I always have said, “if you want to make money, you have to go where the money is. My mom had a beautiful house in Ormond Beach years ago when the economy was good. She had the Ocean a few blocks away and a national park right at her back yard. The house was 4 bedrooms and beautiful. She had to move because to find work, she had to travel over an hour a day. Well we are in one of those places where the money is, and look who's working for us. That's not to degrade these people, their great employees and I'm sure they were competent in their old careers, but that's a big step down they HAD to take.
We'll see what's cooking tomorrow. Right now the little bump up we saw in the Euro most of the day is starting to get volatile and looks like it's about to make lower highs and lower lows.
If you haven't read this article, or maybe haven't read it recently, this is my take on
RISK MANAGMENT.
If nothing else, perhaps it will serve to get you thinking about what suits you. RISK MANAGEMENT IS THE HOLY GRAIL OF TRADING, YOU DON'T HAVE TO LOOK ANY FURTHER.


 | Theme by Thur