Thursday, February 27, 2014

USD/JPY Breaks $102, That didn't take long

Not too long after what seemed to be "helped highs" and on a schedule, the USD/JPY has broken for a 3rd time in the last 24 hours under $102, I don't think it's much longer for holding above the pivotal level.


Daily Wrap...The Crazy Ivan

Yesterday in this article Remember the Steering Divergences? I posted this chart with some excerpts...

"There are two scenarios, a normal straight head fake and a Crazy Ivan , "B" would be the normal head fake move which is a broad and general term, the specific head fake created here would be a bull trap just as the one that proceeded this monster rally was a bear trap which I will show you.

"A" is a variation on the head fake move called a Crazy Ivan shakeout which gives the head fake on the upside a little more momentum by running stops below the triangle and engaging some shorts before moving up and forcing the shorts to cover and those who were stopped out to buy back in creating stronger upside momentum, but the entire point is "C", to get above the triangle where retail will buy on "Breakout confirmation" or chasing.

Stops will usually be placed just inside the triangle, at the apex (point) of the triangle or just below or below the lower trendline of the triangle. As price rolls over and engages those stops it creates downside momentum the same way a bear trap creates upside momentum through a short squeeze, at some point on the way down shorts enter creating more momentum just as in the last move up longs enter creating more momentum, it's the EXACT SAME CONCEPT, JUST IN REVERSE."

That's exactly what was posted yesterday, when I said," a Crazy Ivan shakeout which gives the head fake on the upside a little more momentum by running stops below the triangle and engaging some shorts before moving up and forcing the shorts to cover and those who were stopped out to buy back in creating stronger upside momentum,"we actually saw that today , not only with the break below which looks like a failed bullish triangle, but as I mentioned several time today, there was a near perfect little bear flag created...

From today's SPY Triangle Update...

"however what is impressive is how cleanly it is bear flagging along the triangle's resistance trendline."


Again as a reminder, you have a bullish (as far as Technical Analysis rules go) continuation triangle, and as laid out yesterday, " a Crazy Ivan shakeout which gives the head fake on the upside a little more momentum by running stops below the triangle and engaging some shorts before moving up"

There is of course more to the entire scenario if you read the entire excerpt, what I did find strange was the schedule the market seemed to be on to get this done today, for instance...

 Even on the day it looks a bit odd, the last 10 minutes...

Take a closer look...
 This is a 1 min chart, that just does not look natural by any means, I can almost hear, "OK, Ten minutes to get this done, get moving!!!".

And while the EOD volume appears to be large, it's nothing special at all, take a look...

This is most of 2014.

I figured we were so close they'd hit that level, but I expected some more excitement, this seemed like a real job.

I don't know what the time schedule was about, perhaps it had something to do with the USD/JPY...
 The USD/JPY and ES were perfectly in sync all night and in to pre-market as seen above (FX is green and red and ES in purple), however that all halted as the USD/JPY would move no further.

 The Carry Funding Pair broke $102 and was promptly rescued along with Index futures, but the support that HAD held this week at $102.20 is now solid resistance and $102 is just below, with the USD/JPY breaking $102 perhaps it was imperative to get the SPX new high done before the overnight session sets in and who knows what happens to the pair.

To get the job done they did break out what they needed to or were able to, such as HYG...
 HYG obviously pumped the last 5 minutes and one of the other SPY Arbitrage assets, VXX (TLT was unavailable)...

VXX was smashed lower the last 5 mins, taken with HYG that creates a positive SPY arbitrage to move the market up, so it seems this didn't come naturally at all, it was worked for and they used every trick they had available those last 5 minutes.

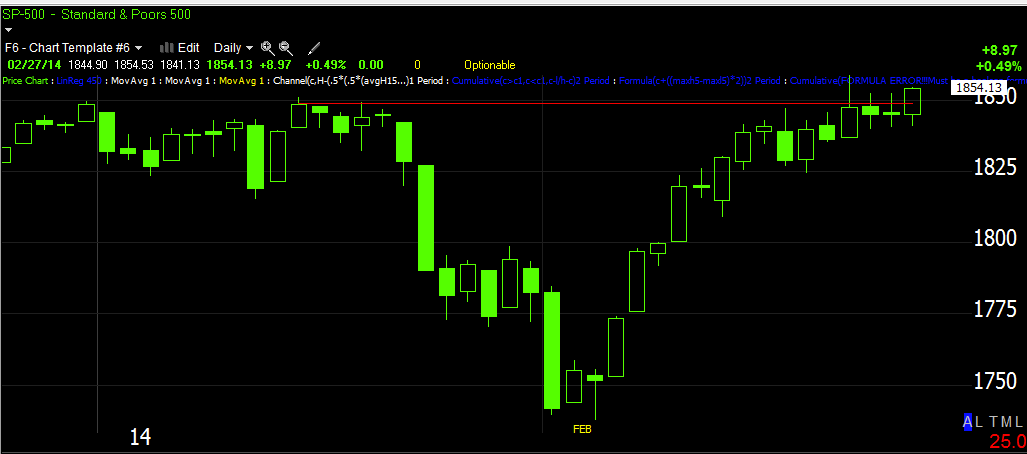
Still what we have left on a daily chart...
Still looks very much like a mature reversal process (as opposed to a "V" shaped event) as the tops are broader than the tighter bottom reversals. Of course all of this was on no economic or fundamental data, this is why I think the Crazy Ivan and triangle showed up when they did.

As shown earlier, sentiment hasn't bought this week (pro)...
In fact it's headed the opposite direction, just as TLT and the safe haven assets in bonds were headed the opposite direction to what you'd normally expect, sending Yields (one of my favorite leading indicators) lower yet, which are already severely dislocated fro the run that started Feb 7th, but was pout together starting January 27th.

Also seen earlier in Leading indicators other than TLT outperforming the SPX correlation, VXX (short term VIX futures) were outperforming as well.
 TLT gives a reversal (leading signal) at the top and then underperforms the inverted SPX correlation until the last week in which it outperforms as a flight to safety apparently and in some size.


VXX (VIX short term futures) are also seen outperforming recently. It seems they are bid for protection, but from what we just made an all time new high right?

Tonight's Dominant Price Volume Relationship was among all 4 major averages, 14 of the Dow 30, 55 of the NDX-100, 618 of the R2K and 220 of the S&P 500, the relationship was Close Up/Volume Down which is the most bearish of the 4 possible combinations and usually acts as a 1-day overbought condition with the next day closing lower.

We do have an op-ex Friday to contend with tomorrow.

As for futures, I don't put a lot of faith in 1 min charts overnight for Index futures, but I thought I'd show them just because a couple of them are so extreme and maybe check up on them a bit later.

 ES is showing a VERY sharp leading negative divegrence, it's one of the sharpest, but it also had the most work to get done today.

It will be interesting to see if these amount to anything.

 NQ is more just in leading negative position, not that extreme, but...

TF, Russell 2000 futures are seeing just as extreme a leading negative divegrence as ES, I'm pretty sure it's going to move futures, the question is, "Is it the start of something bigger?" USually on an overnight basis I wouldn't give it much thought, but after seeing the struggle the last 10 minutes, the apparent time table and now these, I'm wondering.

I'll check in in a bit if Futures are looking interesting.


Something About FAZ (long) or XLF (short) Looking Very Interesting

Again, there's a lot of action this week, I'm not going to go through the entire line of timeframes for FAZ, we have some very large (double-base-like charts in 30-60 min), it's the closer timing timeframes that are interesting.

The first 3 charts are all 3 min, XLF, FAS and FAZ, XLF and FAS should look the same, FAZ should be the opposite or inverse of the first two for confirmation. You'll notice it's all this week as well.


 XLF 3 min

FAS 3x long Financials 3 min

FAZ 3x short financials 3 min

FAZ 15 min double bottom

FAZ 60 min double bottom.

Kind of an interesting looking position, FAZ long.

Market Update

This is just a quick look, but this week has been characterized by the pump ad dump, on a lot of these charts you can see clear increased divergences through this week.

Futures
 ES intraday


 NQ intraday

 TF intraday

 DIA 3 min P&D

DIA 5 min

IWM 3 min deteriorating more

IWM 5 min deterioration

QQQ 5 min P&D

QQQ 30 min cycle

SPY 1 min distribution on the pump, there are some timeframes still in line, no divergences, but in line.

SPY 2 min, again a clear round of distribution in to higher prices, otherwise known as pump and dump, 4 days in a row.

Trade Idea: GS

I'm going to go ahead and open GS April $165 Puts, about half the normal position size, I like where it's at, I just want to be able to track it, I think when we get down to the SPX 200 m.a. I'll be looking at some of these for longer term positions, right now I want to capture volatility, but I do like GS as an equity short as well.

Goldman Sachs Looks Interesting (Short)

I'd have to take a longer look at the entire chart history as far as core or trade, but it looks like an entry in this area might not be such a bad entry for at least a trade or perhaps a put position.

SPY Going for Crazy Ivan- Leading Indicators

While the SPY is making the run for a Crazy Ivan (years ago we'd rarely ever see anything like this in Technical trading), I checked out Leading Indicators quickly. While SPY Arbitrage isn't being used, HYG is as it has been for some time..

Other than that, there are a few interesting Leading Indications specific to this week, which is also to say, specific to the sym. SPX triangle.

 Here we have short term VIX futures in blue vs the SPX in green, since they trade opposite each other I've inverted the SPX's price so the correlation between the two which would normally be almost exact, can be seen. There's a clear bid for protection in VXX / VIX futures .


 I've left the SPX prices inverted to compare to TLT which also traded opposite the SPX and is considered a flight to safety trade, it is outperforming the correlation with the SPX today, but more importantly as you remember the 60 min 3C charts...

Also on a much larger scale with much of that being this week specifically. Why would a risk on market see such a flight to safety?

 Sentiment has flopped back and forth, but there seems to be a clear trend emerging, again specific to this week vs the SPX.

 And Yields, the equity magnet as you can see to the left are dislocated intraday, but keeping in mind the 60 min charts...

Yields have called every move on this chart from down to up to the worst leading negative dislocation right now calling for the SPX to move down.

Now that we have some movement in the market and a couple of hours left, I'm going to take a look at the near term and opportunities.

USD/JPY

ES and the USD/JPY held their correlation overnight and on the break of $102, apparently on Ukraine tensions. The USD/JPY carry is so close to the $102 level ($102.09-broken below this week's earlier defensive line of $102.20), I'm wondering if the market is just afraid to push too much further in case $102 is broken again, the market action is very dull which ALWAYS makes me very nervous.
USD/JPY 1 mi chart including overnight to present (red and green bars) vs ES (purple line). The correlation has been tight as it normally is and ES has tried to push off, but doesn't seem to want to move too far away from a USD/JPY that is so close to such a significant level.

For all that we are watching so closely, don't forget about where the probabilities are or the big picture.
SPY 60 min in a fairly mature reversal process (rounding top), which always seem to be bigger as tops than bottom reversal processes.


MARKET UPDATE

This is a little like watching paint dry. In any case, the last we saw the SPY looked like it was going to head above the triangle, it seems to have gotten bogged down, there's some more deterioration in the IWM as well and all intraday Index futures are running negative divergences too.


 SPY 2 min is perfectly in line, no positive or negative, but new divergences start on the earliest timeframes, even intraday.

The SPY 1 min is seeing some deterioration, I wouldn't call this a smoking gun, but just to keep you up with what's happening or how little is happening.

 QQQ 2 min looks roughly the same, seeing a little dump.

This is the IWM 5 min I pointed out earlier...

The 3 min chart is joining it in that deterioration as well.

As I said, on an intraday basis, all index futures are running in the negative as well.

Closing MCP Trading Position, Leaving Core Long position in place

With volatility about to increase even more, I want my trading positions to take advantage of that. I had a feeling MCP would pullback/consolidate and I should have removed it from a trading portfolio then. If I had only 1 MCP position or if I had a smaller portfolio and I was trading MCP for the longer term to keep down transaction costs, I'd stick with it as I do love it for a primary bull trend asset, for instance...

 There are VERY few 60 min charts leading positive like this in this market and basing, so I believe in MCP, it just doesn't belong in a model that's for trading right now.

The core MCP position is up 10%, the trading position is down -1.23%.

Basically I want to make some room for quicker trades that should do well on increasing volatility soon.

Crazy Ivan

For those who do not know, a "Crazy Ivan move in price is a shakeout of both sides of a price pattern, for a triangle like we have in the SPY now it's a break below or above the triangle first and then a break in the other direction hitting stops and limit orders on both sides.

I named it that after the movie "The Hunt for Red October" in which Russian Submarine captains were said to make abrupt U-Turns to "Clear their baffles", meaning to detect any sub that might be following closely in their prop wash that cannot be heard using sonar. Since naming it that, I've seen a few other sites calling the price move the same thing, I don't know if they came to it on their own or not and it doesn't really matter.

In any case, we didn't get any significant SPY divergence indicating such a move, just a very clean. clear bear flag that intraday technical traders would expect to break lower, instead it seems to be pulling the Crazy Ivan proposed yesterday.

And near the SPY's Apex, it "seems" we are getting a C.I. move.

At least we have some movement that we can start to look in to.


QQQ and IWM

The intraday charts on the QQQ and IWM are , well at least in the IWM's case, not surprising until we get to its 5 min chart, then it's a bit surprising.

Take a look...

 QQQ 1 min is similar to what we saw late in the day yesterday in the IWM.

QQQ 2 min shows the same, but much smaller

And the 3 min the same, but much, much smaller. There's a huge difference between 1-3 min charts and a 5 min chart. Now look at the IWM.

 This is what we saw develop late yesterday in the IWM intraday charts, 1 min

Same in the 2 min, you can see the previous pump was quite a bit larger.

At 3 min it's loosing some of the sharpness.

Something interesting happens at 5 min where the larger institutional trades can be picked up on an intraday basis.

The pattern of pump and dump is slightly out of scale to fit this new divergence in, but this new area is leading negative as of yesterday's strong move in which the IWM led, this is clear deterioration away from the pump and dump seen on short term charts and don't forget we already have significant deterioration on charts that really count like 60 min.

I'm not sure what they are up to exactly, but I'd be on my toes and looking for decent entries in positions you like and remember they have been dumping.